
| Home | Log In | Register | Our Services | My Account | Contact | Help |
You are NOT currently logged in
Register now or login to post to this thread.
Davai - 18 Apr 2012 11:13


Thread designed to record set-ups and targets on index and FX pairs.
'A market is only your enemy until you understand it, then it becomes your best friend.'
Any questions, please feel free to ask.
From time to time i may openly state an opinion regarding direction of a set-up and wish to add that in no way am i recommending a trade. I am sometimes only in trades for a matter of minutes and can't always update as to entry/exits taken.
As always, markets are dangerous places to be and must be respected as such. Always use stop losses and never over-leverage; 3% of your pot as a maximum per trade. As always, YOU are responsible for your own trades! Happy pip hunting!
Click HERE to visit me at FXtechnicals.net
Davai - 18 Apr 2012 11:16 - 2 of 423
I will start by posting a few set-ups that i have predicted in the last week or so. Feel free to ask any questions. Other than that, i will use this thread to record my thought process and success/failures etc...
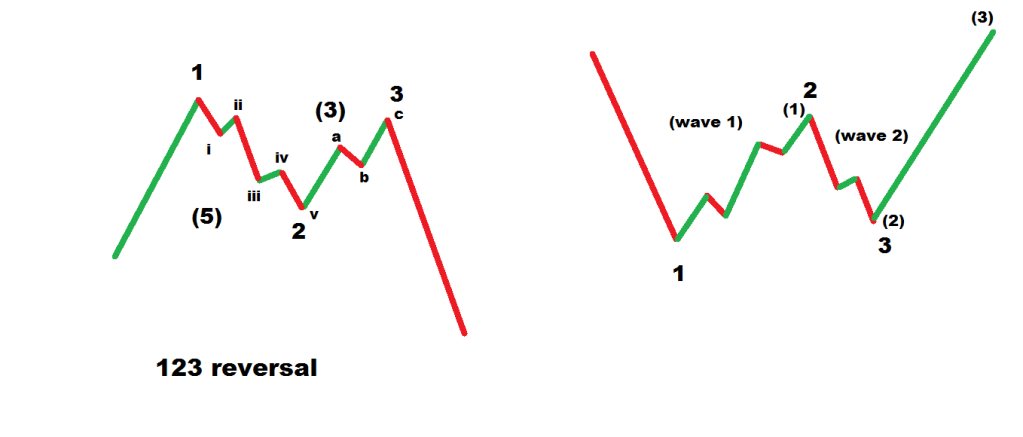
Here i was looking for a 123 reversal pattern (as circled) to confirm my thoughts of a next leg up...

update and result;

Here i was looking for a 123 reversal pattern (as circled) to confirm my thoughts of a next leg up...

update and result;

Davai - 18 Apr 2012 11:17 - 3 of 423
Just a little further on now and the original analysis was correct;


Davai - 18 Apr 2012 11:18 - 4 of 423
A simple 5 move impulse advance and an obvious 3 move 'abc' corrective to follow;

Update;


Update;

Davai - 18 Apr 2012 11:20 - 5 of 423
Here, i have a system generated target. Price often reverses after the TP (target price) has been met, (lower black line);

Update


Update

Davai - 18 Apr 2012 11:22 - 6 of 423
Again; a couple of corrective moves joined together to give a target of a previous flagline;

Update;


Update;

Davai - 18 Apr 2012 11:30 - 7 of 423
Cable this time and a sequence which meant a HH (higher high) had to be printed;

The result (overnight action inbetween);


The result (overnight action inbetween);

Davai - 18 Apr 2012 11:53 - 8 of 423
Cable again and an earlier set-up today, which had already triggered long before the unemployment data, curiously that probably means the figures had to be good, therefore the market already knew... hmmmmm, anyway 1st target met very quickly and now fully expecting 1.6000 to be hit;


Davai - 18 Apr 2012 12:35 - 9 of 423
UsdJpy; looks like it could be breaking out of recent corrective moves (as do a couple other Yen pairs). Yen weakness could be the theme for the short term then, but with some possible 1st waves nearing completion, poss tomorrow/Friday. Just recording this for a mo, cos if it does play out, i will expect a three wave corrective retracing a good chunk of this weeks gains, get that out of the way and we are good to go (long). Still looking for evidence right now;


Davai - 18 Apr 2012 13:19 - 10 of 423
Very speculative for now, but having been in a complex corrective move for so long (and i consider it a 4th wave on the daily), it must be ending soon! If this is a 1st wave (in 5waves) we might see something like this; I have shown it as an extended 5th subwave as opposed to the 3rd being the longest;

might be far simpler;

or could still be corrective!

might be far simpler;

or could still be corrective!
Davai - 18 Apr 2012 13:34 - 11 of 423
Further to post 8;
'hmmmmm, anyway 1st target met very quickly and now fully expecting 1.6000 to be hit;'
Update;

'hmmmmm, anyway 1st target met very quickly and now fully expecting 1.6000 to be hit;'
Update;

Davai - 18 Apr 2012 18:56 - 12 of 423
Basis for trades, determining the trend first and then look for a retracement, Risk : Reward is 1 : 1 ratio, but using a trend confirmation indicator, it is very high probablity trading;
Example given is obviously for shorts, reverse for longs;


Example given is obviously for shorts, reverse for longs;


Davai - 18 Apr 2012 20:48 - 13 of 423
Very clear 5 wave advance on the EurJpy, if this corrective move plays out it will be good to go long and strong;


Davai - 19 Apr 2012 10:32 - 14 of 423
Yen pairs still trending well even when corrective, in particular the GbpJpy is being very kind to the system, with every target getting met;
Two short set-ups in the down channel. The green arrows are merely to highlight that a retrace normally occurs just after target is met, purely to create a fresh set-up;

After the last significant high (before the recent low) is breached, we swing long;

Two short set-ups in the down channel. The green arrows are merely to highlight that a retrace normally occurs just after target is met, purely to create a fresh set-up;

After the last significant high (before the recent low) is breached, we swing long;

Davai - 19 Apr 2012 14:48 - 15 of 423
Audi is tricky, but possible count;


Davai - 19 Apr 2012 15:37 - 16 of 423
£ is looking likely nearing a couple of tops (cable and vs Yen) so could start a decline soon.
Davai - 19 Apr 2012 17:19 - 17 of 423
Here i have a long set-up on the FTSE, which went according to plan perfectly.
We are looking for an ABC retrace within the whole corrective move. Once the last significant LH (lower high) is breached we swing long and can look for a flag to form. If this breaks in a certain way and i get a trigger from my 'trend indicator' it is a confirmed set-up. Stop is a pip below the lowest point of the pullback and target is identical distance to the risk (ie; 1:1). Again, look how price gets there by a mere handful of points before retracing. I'm now short too.

We are looking for an ABC retrace within the whole corrective move. Once the last significant LH (lower high) is breached we swing long and can look for a flag to form. If this breaks in a certain way and i get a trigger from my 'trend indicator' it is a confirmed set-up. Stop is a pip below the lowest point of the pullback and target is identical distance to the risk (ie; 1:1). Again, look how price gets there by a mere handful of points before retracing. I'm now short too.

Davai - 19 Apr 2012 18:44 - 18 of 423
Just a spectator to this one as i missed the entry, target of 19,875;


Davai - 19 Apr 2012 19:20 - 19 of 423
We don't know what shape the next leg of the correction will take yet, so this is highly speculative, however, it certainly appears that whatever form it will be, it has at least now started;
This from yesterday;

This from yesterday;

Chris Carson

 - 19 Apr 2012 19:22
- 20 of 423
- 19 Apr 2012 19:22
- 20 of 423


Aye good call.
Davai - 19 Apr 2012 19:53 - 21 of 423
Yeh thx Chris. I closed the FTSE short ten minutes ago for +40. Its right on a flagline, which i'm watching closely. I might get a validation trigger candle tonight which, if so, means more short side will be nailed on...
Chris Carson
- 19 Apr 2012 20:04
- 22 of 423
I closed @ 5710.5 + 24 cheers again.
Chris Carson
- 19 Apr 2012 21:05
- 23 of 423
That was some comeback on the Dow, didn't trade it scares the shxt out of me :O)
Davai - 19 Apr 2012 21:20 - 24 of 423
Lol! Yep, that's why i closed short, still expecting much more downside but will wait to see if i get the set-up in the morning. Dow has been a bit jumpy today though!
Davai - 20 Apr 2012 07:30 - 25 of 423
Further to post 10;
Looks like a possible 1&2 with wave 3 soon;

Complete conflict to last nights thoughts, however, i don't particularly like the structure of wave 1, with the retrace roughly halfway, however, even if an 'AB' of a corrective move, we should still head higher for a 'C' wave.
Biased long, but a break of either black line will make it more obvious.
Davai - 20 Apr 2012 07:57 - 26 of 423
There again, the FTSE doesn't look similar and looks more like this;
meaning an ABC on the Dax (with 'C' to come)... lets see

meaning an ABC on the Dax (with 'C' to come)... lets see
Davai - 20 Apr 2012 09:34 - 27 of 423
Somewhere along the lines of this fits;

I have a small DAX long with stop at 6630 (pip underneath point 'B')

I have a small DAX long with stop at 6630 (pip underneath point 'B')
Davai - 20 Apr 2012 10:42 - 28 of 423
Bigger version of 'A';


Davai - 20 Apr 2012 14:48 - 29 of 423
Given up on the Euro some time ago. Not trending nicely at all and has an algo in play that gives me an entry right into a corrective move, so straight into a loss almost to stop out before turning. here is a perfect example of this, (despite it looking like a valid set-up, i can do without the stress!) The algo comes and goes, but it hasn't been flavour of the month for a while now;


Davai - 20 Apr 2012 14:49 - 30 of 423
Didn't think this was likely when i thought about it earlier, but now seems it is a possibility;


Davai - 20 Apr 2012 21:34 - 31 of 423
Poss daily count, Euro;


Davai - 20 Apr 2012 21:45 - 32 of 423
Alternative Dow;


Davai - 21 Apr 2012 13:20 - 33 of 423
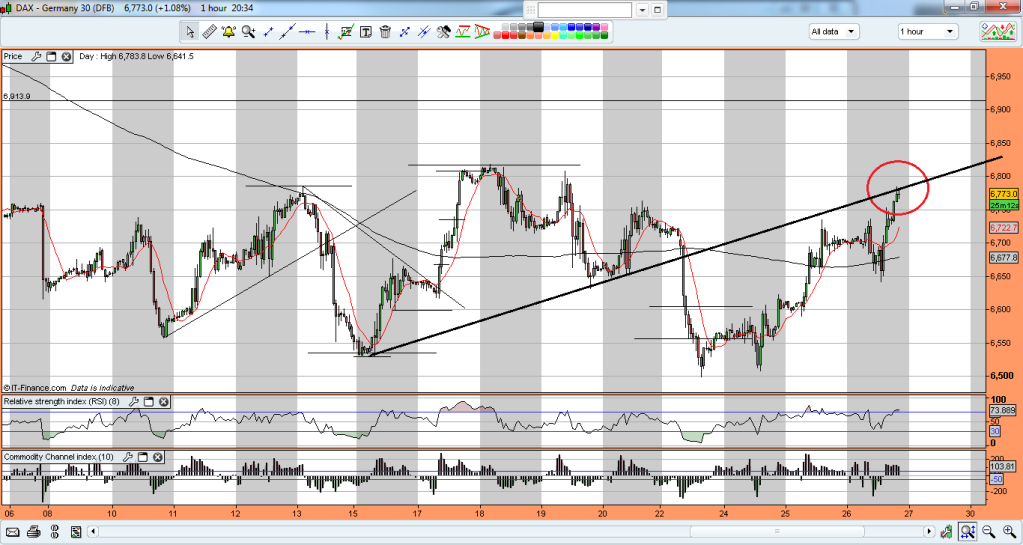
Looking for a bullish day on Monday to give a nice set-up. here i'm looking for an hourly candle to finish at 6775 area and give a target of low 6900's, within the next two sessions...


Davai - 21 Apr 2012 13:22 - 34 of 423
Obviously complete contrast between the last two charts, so i need the market to show its hand. Will post an exact set-up as it happens. No trigger, no trade. Discipline and patience are equally as important as reading charts in a traders world.
Davai - 23 Apr 2012 10:21 - 35 of 423
Fridays action on the Dax (in particular) was puzzling if it was indeed to be as i had labeled it (a 'i'&'ii' leading to (sub)wave 'iii'), (bigger red circle);
Although powering up in the morning, there was simply no continuance. I was expecting something like i have shown, but instead we got the action within the blue circle, which was at least a red flag so to speak.

I closed the long and although i was tempted to re-enter as it drifted down in the evening, i thought it better to wait for more evidence.
Well, from the off this morning it looked like the alternative count was indeed the way forward, (this on the Dow, but they all make the main moves roughly in conjunction with one another);
Sure enough i got a short trigger on the FTSE at 08:01 and would consider we have quite a way to drop over the coming week. Perhaps a little too early to make that assumption, so the first requirement is a LL on the Dax (6529 req'd)
Davai - 23 Apr 2012 12:48 - 36 of 423
Updated FTSE probability;
The only thing i don't like is that, again, its not very easy to make an obvious 5wave counter with 'A' and subsequent abc 3wave for 'B', (should be a 5-3-5). Certainly tricky right now and thus it best to keep taking small profits as and when the market gives the next clue. Trying to second guess the longer move right now, is simply not possible, with far too many connotations.

The only thing i don't like is that, again, its not very easy to make an obvious 5wave counter with 'A' and subsequent abc 3wave for 'B', (should be a 5-3-5). Certainly tricky right now and thus it best to keep taking small profits as and when the market gives the next clue. Trying to second guess the longer move right now, is simply not possible, with far too many connotations.
Davai - 23 Apr 2012 13:08 - 37 of 423
Now have a system generated Dow target, but trusting these whilst in complex corrective waves is dangerous, so small short position for now and would look out for a possible retest of the underneath of the lower TL;


Davai - 23 Apr 2012 16:15 - 38 of 423
Just trialling a small tweak and want to see how price reacts at targets (if at all)...


Davai - 23 Apr 2012 18:16 - 39 of 423
Ok, so using this as a diary to log my thought process. I have a system that works perfectly during trends, being able to dictate a TP (target price) with a very high success rate and thus, have never bothered trading the corrective moves as the chop makes it somewhat unreliable, however, i have deemed it necessary to continue to trade such times as they can indeed last for months. This has seen me have to concentrate more on studying Elliott Wave. It is obvious that you can't try to predict too far ahead during complex correctives, due to the endless connotations available to the market, however, it is very useful indeed to have a plan beforehand and then to reduce the timescales and look for shorter term set-ups. Here's a chart of the £/Yen that i have labelled... My thoughts with regard to the recent gain is that it is still corrective and we will see lower to come after completing a 'B' wave, however, i'm struggling to label last weeks rise as a full 5 waves. I thought the pullback today might be a 'iv', however it just doesn't fit and rather think this is as per the chart. Lets see how it plays out and at least i can compare afterwards to see where i went wrong...
(or curse that i never traded it, if it plays out correctly!)

(or curse that i never traded it, if it plays out correctly!)

Davai - 24 Apr 2012 10:29 - 40 of 423
Lets revisit this one;
Davai - 19 Apr 2012 18:44 - 18 of 39 edit this post
Just a spectator to this one as i missed the entry, target of 19,875;
Update; (target achieved);

Davai - 19 Apr 2012 18:44 - 18 of 39 edit this post
Just a spectator to this one as i missed the entry, target of 19,875;
Update; (target achieved);

Davai - 24 Apr 2012 12:34 - 41 of 423
Going back to my chart of the £/Yen in post 39;
To zoom in now on my 'suspected' 3 legged (abc) 'B'wave (of the 5-3-5), in particular what i expect to be the 'c', we can label it in 5;

Not so sure about allowing my subwaves 'i'&'iv' to overlap, but its not important. the interesting thing i have noticed on many occasion is that the subwave 'iv' of 3, is very often a smaller version of the pattern to expect in the 4th, (as shown in the red circles), in this case a flat abc correction...
Davai - 24 Apr 2012 22:26 - 42 of 423
With ref to above, slightly confusing, but i think it can be labelled differently, but with the same HH outcome (as was the case). Knackered right now, so will do it in the morning.
Davai - 25 Apr 2012 10:07 - 43 of 423
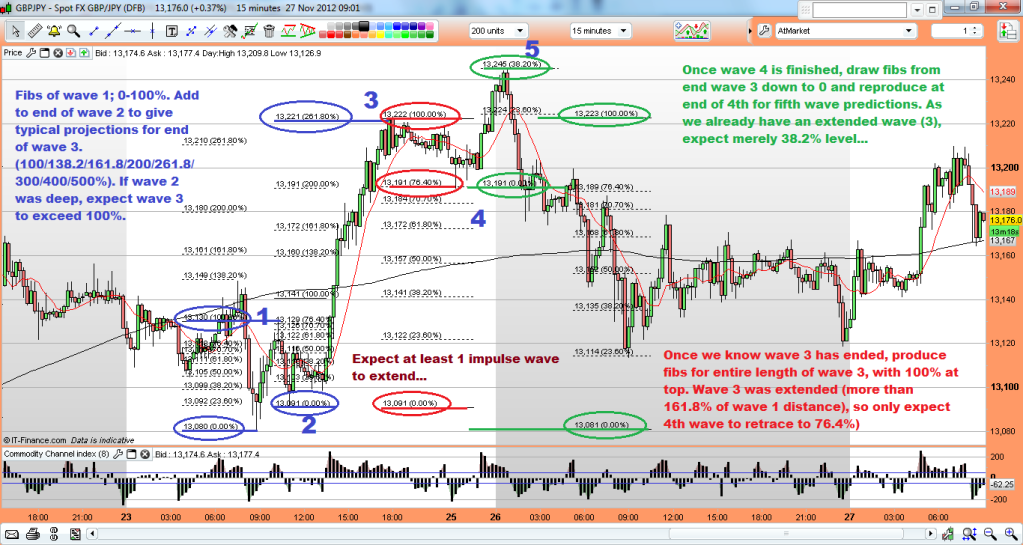
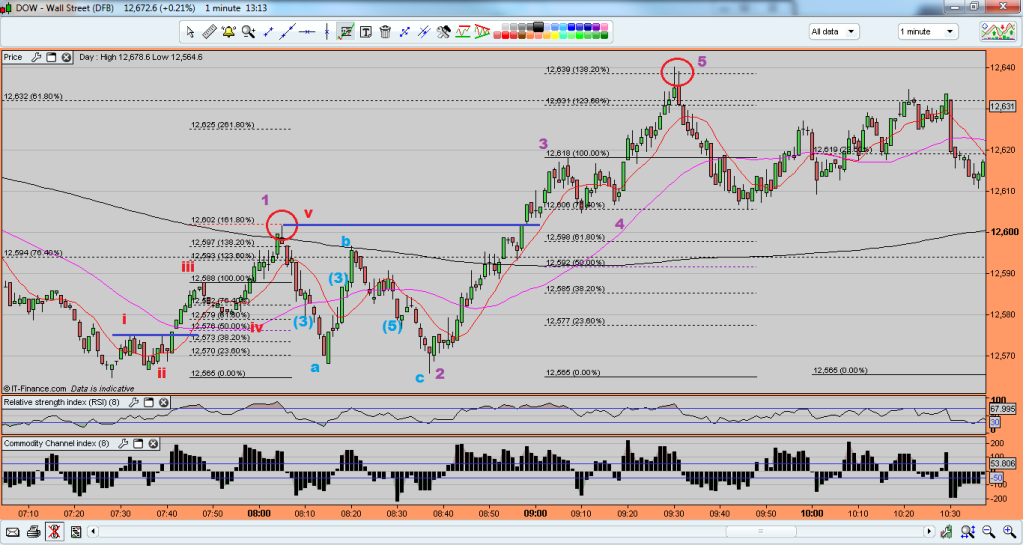
Ok, so without trying to label every last minuette subwave, this is how it looks. It's obvious to me that extended 5th waves occur frequently during corrective cycles, so point learnt. I have shown this in the following chart. I was right to expect a HH as per post 41, but didn't realise we were printing a larger (and somewhat out of proportion, it has to be said) 4th, (red circle)... Whilst looking for an end to the 5th, i look out for what is essentially a 123 reversal. As explained before, it is basically waves 1&2 of the next move, (blue circle)... the 123 is numbered 5,1&2 in that order, within the blue circle. Entry is upon break of point 2 and stop a pip above point 3... I went short earlier @ 13,120 using this popular reversal pattern, the poor GDP data sped things up a tad!


Davai - 25 Apr 2012 10:22 - 44 of 423
So back to post 39 when i posted this;
and now you can see how i first have a plan to work to and then scale down to follow PA in more detail. The updated chart (overall plan);

so far, so good...
and now you can see how i first have a plan to work to and then scale down to follow PA in more detail. The updated chart (overall plan);

so far, so good...
Davai - 25 Apr 2012 14:47 - 45 of 423
Update to trade and i think the markets done me a beauty. Originally banked a whack from the sharp drop this morning, but a bit of ill-discipline later and i find myself shorting free-style within what i presumed was a 4th wave, feeling safe in the knowledge a 5th wave and LL (lower low) was to come. Except, it took me far too long to accept or realise that the move wasn't flat enough. Pullback of '2' was quite sharp as per last chart, so '4' should be flat. Looking at the following chart, we have what i believe was a short 4th, (now shown as 'iv') with the 5th ('v') ending exactly to the tenth of a pip level with '3' ('iii'). This means back in 3 waves corrective for an ABC to form a much larger 1&2... I decided to close out giving back a large chunk of what i had gained earlier!... follow me so far?!
The chart;

I could have raised my stops, but would rather let it play out and look for more confirmation instead. I'm watching two fib retracement levels (orange and red) for a bounce, (the orange 61.8% being favourable as it should be a resistance turned support level). We then go back to looking for another 123 reversal pattern to form subwaves 1&2 of the 3rd. If correct a much larger drop should ensue. lets see...
Davai - 25 Apr 2012 15:13 - 46 of 423
The bigger picture of above;


Davai - 25 Apr 2012 16:06 - 47 of 423
Right now, its a case of waiting to see how it pans out. Next requirement is a clear 123 which will be subwaves 'i' & 'ii' of the 3rd, if my reading is still correct. I want to see a fairly clear 5 & 3 structure within it and then the trigger will be a break of wave 'i', (or point 2 as a 123);

Davai - 25 Apr 2012 18:05 - 48 of 423
Wouldn't surprise me at all if it reverses between the blue lines;


Davai - 25 Apr 2012 20:11 - 49 of 423
Could be time to get excited soon with cable. Just a case now of working out where the current rise will end (if it hasn't already) and we could be good for a very rapid descent...


Davai - 25 Apr 2012 20:44 - 50 of 423
Just getting the impression that there is a big rush on to complete some wave counts. Cable has (so far) only made a HH for its final 'C' wave of the corrective move, over point 'A' by a mere 16 pips. You may be scratching your head as to why its higher now than when the dire GDP data came out earlier showing we are back in a recession! That is your answer! It has to complete its obligations. Looking for 123 reversals and need a small one which will be subwaves 'i'&'ii' of a larger 1&2. I may even try to get a decent swing trade on the go to run alongside my system trades.
Davai - 25 Apr 2012 21:44 - 51 of 423


Davai - 25 Apr 2012 23:18 - 52 of 423
Maybe a bit further to go yet?


Davai - 25 Apr 2012 23:32 - 53 of 423
Maybe another good indicator for a reversal; target met, although it might have a little further push for a HH by a handful of points yet if my workings are correct, still more than likely today has been an 'A' and 'B' correction with a down day tomorrow...


Davai - 26 Apr 2012 09:16 - 54 of 423
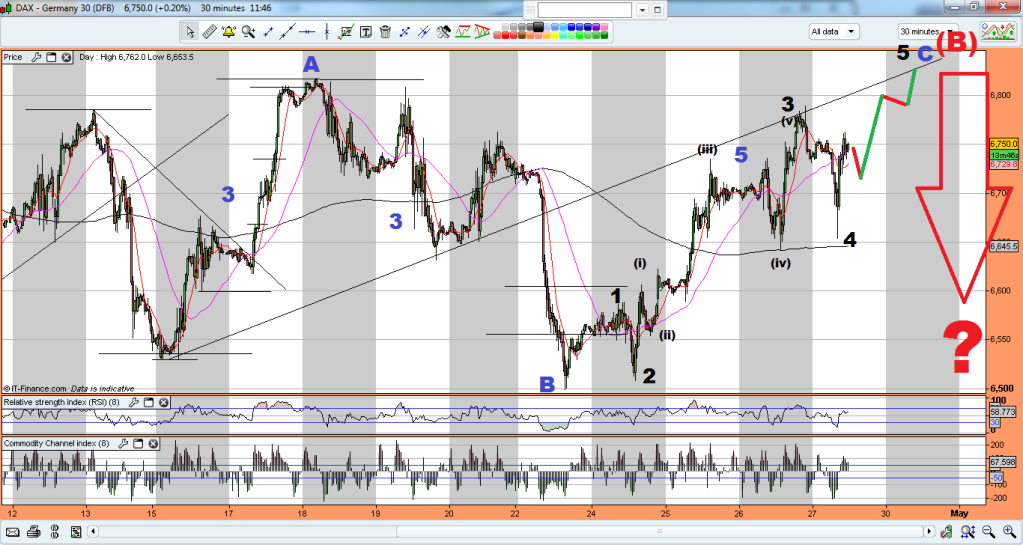
Possible plan;


Davai - 26 Apr 2012 09:31 - 55 of 423
In more detail, (but still very speculative);


Davai - 26 Apr 2012 17:29 - 56 of 423
I should have shown 'C' as 5 waves, thus a triple 3, (11 moves). I'm currently trying to determine if according to the rules, 'x' is allowed to breach a 'b' within the cycle. If not and you get your counts right, it would make for an absolutely fantastic high probability/low risk trade right now. If the minor 'c' of the final 'x' wave has to make a HH over minor 'a', but can't breach the previous 'x', (between the blue lines), we can short there knowing there is one more abc to come and put our stop merely a dozen or so points above, (a pip above 'b'). Target is around the previous low of 'A' as this is a flat corrective. Watching;


Davai - 26 Apr 2012 20:36 - 57 of 423
Couple of things making me wonder if we are about to head down sharply;


Chris Carson
- 26 Apr 2012 21:50
- 58 of 423
Davai - I like this chart better, I am no technical analyst (no shit I hear you say :O) but if, a very big if, volume was to increase dramatically isn't it just possible Dow could go higher to close to 5yr highs? I'm not trading it to find out scares the shxt out of me.
Chris Carson
- 26 Apr 2012 21:56
- 59 of 423
Chris Carson
- 26 Apr 2012 21:56
- 60 of 423
Davai - 26 Apr 2012 22:24 - 61 of 423
Chris, in short, i am expecting higher to come this summer, but probably not a fresh high over 2007 level. This whole move since October 2007 is corrective and we still have a final leg up before it completes the 'B' wave, (well, my reckoning anyway), there are a couple of different ways to label it, but it might see us well into late summer/autumn, hell, even into 2013 before the death spiral of wave 'C' back down to new lows...
Right now, my thinking is that we are in a complex corrective wave, of which A is finished and to repost my chart from earlier (below) i actually think tonight sees us end wave B too. That leaves us free to weave our way back down to a new low (12,700 area) before starting a more orderly climb back up.
Of course these are just my own workings and thus an opinion.
Chris Carson
- 26 Apr 2012 22:28
- 62 of 423
Thanks for that Davai, interesting.
Davai - 27 Apr 2012 09:12 - 63 of 423
Back to post 56 now;
Davai - 26 Apr 2012 17:29 - 56 of 62 edit this post
'I should have shown 'C' as 5 waves, thus a triple 3, (11 moves). I'm currently trying to determine if according to the rules, 'x' is allowed to breach a 'b' within the cycle.'
'Target is around the previous low of 'A' as this is a flat corrective. Watching;'
-----------------------------
Ok learnt a couple of things. The market mixes it up enough to make it difficult to label the moves for certain before they are completed, therefore better to keep your stop above either the last known 'X' or better still a pip above point 'B'
I'm happy with the way i've labeled the following chart and it says to me that 'X' can breach the previous 'b', but obviously not the previous 'X'
If you strip all the workings down, then the important part was this,
'Target is around the previous low of 'A' as this is a flat corrective.' ('A' being the low to the left of the chart)
So, with your stop above point 'B' (after the abcde wave) we had a target of approx point 'A' because we had determined this was a flat corrective move.
Some overnight news caused some very rapid movements, but the second chart shows in detail the last abc move to print the target req'd;


Davai - 27 Apr 2012 15:24 - 64 of 423
The Dow made a HH this morning and thus invalidated the possible set-up that i mentioned last night. The pullback was actually abc corrective (label ('iii'),('iv') & ('v') as a,b & c respectively. Here is a chart as to what would have been a great set-up. Its this kind of thing that i look for constantly. The primary 123 can be traded in its own right, but they occur quite frequently and don't always give the points, so i prefer to use them as a 'heads up' of a larger 1&2 (secondary 123). Entry is the break of point 2 (by a full pip), stop above point 1, (or 3 aggressively and only if the pullback was deep)

Anyway, moving on, we may still be a whisker away from an intermediate top; possibility for the Dax. Last nights short off of the line gave a good hundred pips plus, but was a likely abc 4th wave instead, therefore we might have the scenario in the bottom two charts;
last night;
this morning;

and how i view it right now;

wave 'B' in close up;

Davai - 27 Apr 2012 19:48 - 65 of 423
Something was bugging me earlier. The GbpJpy usually correlates to the markets and as my charts suggest, i reckon there is a good blast north around the corner. However, i have also posted i expect the markets to tank shortly. Well, its possible we will have a couple more days or so yet and end up with an irregular correction on the Dow, ('B' wave making a fresh high), with 'C' a slightly LL and probably a flat for the £/yen. All three that i watch correlate closely together with this particular count which involves the Dax and the Dow reaching a 1.62 fib extension of their 'a' of the 'B' wave.
Here's all three charts;
(as prev posted), £/yen;
the Dow plan;

and the Dax;

all three give us probably into the middle of the week for more gains before a major turn, with the £/yen in particular looking good for some great gains. Well, its only analysis at this stage, but at least with a plan i can now look on smaller timescales to see if it works out and of course trade it accordingly.
Davai - 27 Apr 2012 20:49 - 66 of 423
Chris, i reckon you stand a very good chance of winning the M&S vouchers this month mate!
Chris Carson
- 27 Apr 2012 21:04
- 67 of 423
Well it would be a first Davai, I'll believe it when I see it mate :O)
As regards Monday never mind next month I haven't got a clue where the indeces are going. To be honest just wish it would stop bloody raining so I could play some golf. Good luck with your trading.
As regards Monday never mind next month I haven't got a clue where the indeces are going. To be honest just wish it would stop bloody raining so I could play some golf. Good luck with your trading.
Davai - 27 Apr 2012 21:28 - 68 of 423
Just got a feeling it might add 30 odd points on Monday, but lets see! Have a good weekend!
Davai - 30 Apr 2012 18:43 - 69 of 423
So, bit surprised by todays moves, still biased for upside soon and am wondering if its looking for the 1.62% level of 'a' for the target. Decisive break of this and its a completely different count entirely, with another fib level at 12890 being the 61.8% retrace of the recent move up. As it is, its just back to how i envisaged it last week;

last week;

last week;
Davai - 30 Apr 2012 19:22 - 70 of 423
So, the alternative count. Although i would even consider this a more natural looking corrective move, (retracing 50/61.8% of wave 1) for wave 2, i struggle to accept the final part ('c') of the 'B' wave being the recent 'abcde' expanding triangle move, (although it is in 5 waves). It also appears massively out of symmetry. So i will try to see if its possible/likely,


Davai - 01 May 2012 16:03 - 71 of 423
Ok so reminder of the chart in post 69;
Now i can show a reversal which is ongoing from this fib level;

Now i can show a reversal which is ongoing from this fib level;

Davai - 01 May 2012 16:19 - 72 of 423
So, now in closer detail;
The reversal was easy to spot. Three 15min candles with a bit of impetus and on closer inspection gave me a fast 5wave impulse move, the pullbacks of each being so minor, it was clearly showing the way, (these i have listed as (i) through to (v) of '1'). Then follows another clear abc corrective move, before climbing up to trigger the set-up long on a break of point (v). Reading it as a 123 reversal; this is point 2. Stop is a pip below point 3. the ISM data did the rest;

The reversal was easy to spot. Three 15min candles with a bit of impetus and on closer inspection gave me a fast 5wave impulse move, the pullbacks of each being so minor, it was clearly showing the way, (these i have listed as (i) through to (v) of '1'). Then follows another clear abc corrective move, before climbing up to trigger the set-up long on a break of point (v). Reading it as a 123 reversal; this is point 2. Stop is a pip below point 3. the ISM data did the rest;

Davai - 01 May 2012 16:29 - 73 of 423
Looking at the above again, but this time concentrating on the Fibonacci retracement levels, you will see how accurate they can be for expected reversal points. I have circled the more important ones in orange;


Davai - 02 May 2012 09:28 - 74 of 423
So you've realised that the £/Yen is my favourite pair for trading right now.
This may be repetitive from yesterday, but the count became clear from the overnight action, so i want to post the relevant charts and updates;
Expected reversal point from Mondays action;
update;
Updated update (with overnight action);

and in closer detail with the wave counts etc;

That is surely proof to any doubters that charts and Elliott wave do work!
Davai - 02 May 2012 13:11 - 75 of 423
Current thinking;


Davai - 02 May 2012 13:11 - 76 of 423
Arguments for long/short;


Davai - 03 May 2012 14:37 - 77 of 423
Could be a great set-up in progress. This is what i'm watching;


Davai - 03 May 2012 17:04 - 78 of 423
Next push for the markets imminent???

Better post this one on here as well i guess. Possibile alternative play on the Dax with a triangle in play. This shows far less upside before the drop;


Better post this one on here as well i guess. Possibile alternative play on the Dax with a triangle in play. This shows far less upside before the drop;

Davai - 03 May 2012 19:07 - 79 of 423
Back to post 39;
Davai - 20 Apr 2012 21:34 - 31 of 78 edit this post
Poss daily count, Euro;
Update;

It all looks as though we are heading for some possible Euro strength soon.
Davai - 20 Apr 2012 21:34 - 31 of 78 edit this post
Poss daily count, Euro;
Update;

It all looks as though we are heading for some possible Euro strength soon.
Davai - 03 May 2012 19:12 - 80 of 423
This might explain why yesterdays pullback looked like it was in 3 (abc);


Davai - 04 May 2012 16:58 - 81 of 423
Confirmation of count;


Davai - 04 May 2012 17:30 - 82 of 423
Interesting to note this;
(from last night's analysis);
'Better post this one on here as well i guess. Possibile alternative play on the Dax with a triangle in play. This shows far less upside before the drop;'
Indeed, the 'E' wave was very short underlining the weakness of the markets today. Similar happened on the Euro, with a very short 'C' wave before the drop...
Davai - 10 May 2012 08:25 - 83 of 423
Fib levels of 'A' reproduced onto top of 'B'. Confluence is easy to spot;


Davai - 11 May 2012 16:06 - 84 of 423
Unfortunately, looks like more downside next week for index's (and thus strength for dollar). Getting close to some great long entries on a few pairs. The Loonie looks like it wants up from here...
Davai - 11 May 2012 16:14 - 85 of 423
So we have been in a WXY flat move for the last few days. Could well head up later in the week after we have finished the current corrective move within the downtrend, but fully expecting ABC down first, before the start of the big bounce. Could completely screw my FTSE comp entry!


Davai - 14 May 2012 20:33 - 86 of 423
So the sell off late last Friday was the start of the ABC move down, the first 5waves completed today. I would expect the B move to end overnight too and a down day tomorrow for the C wave. The converse being the case for the Loonie, of which i have labelled here;


Davai - 14 May 2012 21:30 - 87 of 423
Back to; Davai - 18 Apr 2012 20:48 - 13 of 86
Very clear 5 wave advance on the EurJpy, if this corrective move plays out it will be good to go long and strong;
Update;

and now im watching the small 5 wave advance since hitting my blue line earlier. Hopefully we will get a clear abc and a bounce off of a fib level. I must add, i'm expecting dollar strength tomorrow though therefore the Eur needs to be somewhat resilient, (or it may do a 100% retrace, so long as it doesn't make a fresh low), this just may be the start of a lengthy run for the Euro, (yes, just when all the current Greek problems seem to mean the opposite)...

Davai - 15 May 2012 11:41 - 88 of 423
Back to the loonie as of last nights chart (above);
and in closer detail, for this morning;
and in closer detail, for this morning;

Davai - 15 May 2012 12:24 - 89 of 423
Extending diagonal on the (5th of the) minuette 1st, bit of pain yet before the 3rd!


Davai - 15 May 2012 20:19 - 90 of 423

Davai - 15 May 2012 21:01 - 91 of 423

Davai - 16 May 2012 13:36 - 92 of 423
If the first small 'i'/'ii' is too risky to determine, we look for a follow on 5w up, half position entered long on pullback to a fib level. In this instance such a deep pullback, gives a fantastic low risk entry at points 'a' & 'c', wave structure here is very important, with 'a' being down in 3, it was going to be either a flat or irregular correction, sure enough, 'b' heads right back up nearly retracing all of 'a' and 'c' making a slightly LL. More confirmation comes with a break of the top of '1' by a full pip, enter second half of position long and look to fibs for target once the 3rd can be determined...

Davai - 16 May 2012 19:50 - 93 of 423

Davai - 18 May 2012 08:37 - 94 of 423
Respite for the markets. This is a perfect 5w count;


Davai - 18 May 2012 08:38 - 95 of 423
Davai - 15 May 2012 21:27 - 8189 of 8202
I do have a primary target for the Dow;

Update;

I do have a primary target for the Dow;
Update;

Davai - 18 May 2012 10:58 - 96 of 423
Get ready for a small pullback on the Dow;
12,500, 138.2% fib obvious target. Round number and was support yesterday, therefore, def resistance today

12,500, 138.2% fib obvious target. Round number and was support yesterday, therefore, def resistance today

Davai - 18 May 2012 11:57 - 97 of 423
Further to post 94, for extra confirmation of the end of the 5th wave, (not that its needed in this instance), but... draw a line connecting bottom of waves 2&4, then drag a parallel line touching end of wave 3, wave 5 will usually slightly exceed the line;


Davai - 18 May 2012 13:22 - 98 of 423
My plan to work to for the summer;
(need to move the red 'B' across to incorporate the wedge, leaving red 'C' as a 5w down)

(need to move the red 'B' across to incorporate the wedge, leaving red 'C' as a 5w down)

Davai - 22 May 2012 14:47 - 99 of 423
A perfect trade;

After a recent short target was reached on the above chart, coinciding with my Cad target (above) and the Dow twin Fib targets, i was suspecting a bounce;
(Davai - 18 May 2012 08:37 - 94 of 98
'Respite for the markets. This is a perfect 5w count;'),
So we watch for an ABC. The important part is that 'A' breaches the last significant high, (as shown by the blue line in the above chart), now we wait for 'B' to retrace and then turn back upwards, to start wave 'C'. This will be in 5 waves. With that knowledge, we wait for wave 1 to end and draw our fib levels, wave 2 should retrace in 3 minor waves and bounce off of one of those fib levels. we can now draw a flagline starting from the top of 'A' and touching the top of wave 1. Using my system, i get a trigger upon breakout where i can determine a target price for the set-up. Stop is a pip below the lowest point of the pullback ('B'), target is equal distance away from entry, thus a risk:reward of 1:1, but very high probability. This rises still further when you look at the fib level of 261.8%. This is often a target off of wave 1 for either the end of the 3rd wave or even the whole 5 waves, look how it is identical to my system generated target...
It looks like this is ABC of A, followed by tonights drop being ABC of 'B', so a larger 5 wave C to come over next couple of days, this should also mean higher yet for index's before one more drop...
Davai - 23 May 2012 08:06 - 100 of 423
Trending perfectly and reversing after each target is achieved;


Davai - 24 May 2012 20:00 - 101 of 423
Davai - 24 May 2012 10:11 - 8240 of 8247
My current thoughts are with my original chart of last night. We have just played out an abc 4th, which was far longer in timescale due to overnight futures. We head up for a 5th and then back down in an abc corrective (probably tonight), this would mean much higher early next week;

(with regards to above comments; i forgot that it is Thursday today! Tomorrow should be a big up day, prob Mon/Tues for reversal back down, but too early to tell just yet...
Davai - 25 May 2012 08:14 - 102 of 423
Update to above, (as of last night);

This morning has also seen a spritely start!

This morning has also seen a spritely start!
Davai - 25 May 2012 14:18 - 103 of 423
Ok, was expecting a normal 5w impulse move for C, but now looks more likely a diagonal;


Davai - 26 May 2012 10:21 - 104 of 423
(copied across from the other thread)
Davai - 26 May 2012 10:15 - 8257 of 8257
Look how easily the pattern changes hinged on the length of the (iv)th, its now likely to be an expanding diagonal;

I do have a system target of 1348, but watching with interest as we are in an ABC counter-trend move and thus i don't have enough evidence yet to call that with conviction... If it does reach that level, it will surely reverse thereabouts...
Davai - 26 May 2012 14:58 - 105 of 423
The Loonie also looks like down from the open on Sunday night, (dollar weakness = markets up);


Davai - 27 May 2012 21:48 - 106 of 423
NzdUsd leading the way tonight and similar to the above index chart predictions;


Davai - 28 May 2012 11:47 - 107 of 423
Update to above;


Davai - 10 Jun 2012 22:45 - 108 of 423
Remember this?;
Davai - 27 Apr 2012 19:48 - 65 of 107
the Dow plan;
Well i think we may have reached the bottom, (speculative for sure right now and need evidence)
Davai - 10 Jun 2012 22:18 - 8343 of 8343
Here are my current thoughts as to the Dow. The FIB levels are reproduced from the length of 'A' (not seen to the left of the chart), it looks as though we have completed a full ABC retrace within the uptrend, with the first part ('A') of the correction starting 27th March. This is of course, speculative, but the FIB levels have been deadly accurate for the whole of wave C.
I'm looking for the last Lower High (prev wave 4 as per chart), to be breached tonight/tomorrow for further confirmation, then we can look for a large ABC retrace to begin. This can be sharp/shallow, zigzag/flat or irregular, but if it forms a clear 3-3-5/5-3-5 and doesn't make a fresh low, we are in business for a Higher High to come in a month or so's time and higher for the rest of the summer at least...
Sound crazy with everyone expecting new lows with all the Spain/Euro probs??? Yep that's how it will catch everyone out. I would expect the ABC to be a deep zigzag, just to scare everyone, but if no LL, we are good to go.
here's the chart;

Davai - 21 Jun 2012 17:02 - 109 of 423
Well, after identifying the recent 5w advance, it is clear that it wasn't followed up by a typical ABC retrace (as per above). Instead, we got a faster 'B' wave pullback and another 5w advance ('C') to follow. This may have already completed, or perhaps have one last move up to go.
If this is correct and it certainly looks it right now, we could be about to start a very nasty sell off. Possibly a couple thousand points to come off of the Dow in the coming weeks...

If this is correct and it certainly looks it right now, we could be about to start a very nasty sell off. Possibly a couple thousand points to come off of the Dow in the coming weeks...

Davai - 21 Jun 2012 17:12 - 110 of 423
Adding to that, the Euro appears to be rolling over. Time to look for a small 5-3 move (down and retrace)...


Davai - 21 Jun 2012 17:25 - 111 of 423
Cable should start to look sick soon too;


Davai - 21 Jun 2012 18:41 - 112 of 423
Now the Audi joins in, reflex point breached by a full pip, trend changes to short. Look for an ABC retrace back up now to get short;


Davai - 21 Jun 2012 19:03 - 113 of 423
Nzd, likely outcome;


Davai - 21 Jun 2012 19:18 - 114 of 423
Reflex point breached above (NZDUSD) and now the Loonie joins in... the evidence is growing;


Davai - 27 Jun 2012 04:29 - 115 of 423
Things looking ripe for some red today!
*edit* A day out with timing and some corrective moves completed by the looks. Markets want up and looks to be the real deal, so now over-rules previous posts. This will probably mean original plan, with a HH to come for the Dow...
*edit* A day out with timing and some corrective moves completed by the looks. Markets want up and looks to be the real deal, so now over-rules previous posts. This will probably mean original plan, with a HH to come for the Dow...
Davai - 06 Oct 2012 11:36 - 116 of 423
Ok, lets try to show workings behind a great trade yesterday...
Firstly, here is a chart of the hourly Audi;

I could have shown a 4hr which would identify this as a complex corrective phase and the likelihood of us being in a 5 wave move ('C' wave).
We are nearing the end of this move (as per the chart). Here we can clearly label the move as the market is being very kind right now and literally signposting each move.
Once we have finished the powerful 3rd wave, we can look for an ABC 4th. In this instance wave 2 was short and simple, thus we can expect alternation and a longer more complex wave 4. I have attempted to label that in the chart below, but first lets observe a couple of things. Draw a line connecting the end of waves 2&4, then drag a parellel line across to the end of wave 1, (blue lines), this will give a likely target for the end of the whole 5 waves... In this instance i believe we may get a second touch as its unlikely that we have finished the move and have just encountered our 4th (subwave) of the 5th just before the close...
Now to look in more detail at the 4th wave and the break out into the powerful 3rd (subwave) of the 5th wave;

Here we can follow the structure of the 4th wave in a 5-3-5 ABC formation. Its even possible to clearly label the subwaves within the 5th wave of 'C'. This set us up for downside early on yesterday, (subwave 1 of the 5th), but after a&b (of subwave 2) and with the need for a corrective 'c' to come around the time of 'Non Farms', (I also had the Euro pegged to go up at the same time), so i wasn't expecting bad news. Surprise surprise, up we go. The Audi made a steep retrace, but couldn't breach the start of point 1 of course (stop placement). Once completed it was time to start subwave 'iii' (of the 5th). At this stage we don't know what shape it will take as 5th's can develop in many fashions, but once it started dropping sharply it was obvious it was impulsive, we would get a clean break of the flagline and likely drop in a strong move. Shorting the rise of the 'C' wave (of subwave 2) with stop above start of point 1 is a great trade. Equally shorting the break of the flagline, (bigger points risk, but more evidence)
chuckles - 06 Oct 2012 23:59 - 117 of 423
Going back to June Davai it seems like all of your predictions were, err, wrong? No nasty sell off, entirely the opposite in fact.
Davai - 08 Oct 2012 13:04 - 118 of 423
True.... that's the purpose of the thread though to be fair... put it out there to be able to look back and learn from. To be fair, i generally only ever trade on small timescales and thus am only really interested in short term movements...
Apologies, I will try to get it right next time! )
Apologies, I will try to get it right next time! )
chuckles - 08 Oct 2012 20:17 - 119 of 423
All fair comments Davai, my post was more aimed at the inaccuracies of Elliot Wave Theory, give 10 practitioners the same chart and all 10 would have different outcomes :-)
Davai - 11 Oct 2012 11:48 - 120 of 423
Not going to disagree with any of that. Now... just recording some thoughts here;
They are that we have just completed a 5wave down and are now in an ABC retrace. Of that we are printing abc (of 'A'). System target is 12904, but obvious target would be 12920 (the 38.2% fib retracement level), before we start an abc 'B' back down...
I am labeling this as an expanding wedge. I brought my stop up to BE too soon (after system entry) and got stopped out to the exact pip on the downleg of 'D', this was exactly entry point, the market knows this and thus why it did a second retest of this point. Observation is to bring stop up to a pip below point 'B', thus reducing risk by two thirds, but staying clear of the probability of a stop out. If stopped then the entire set-up and thinking is invalid anyway, with risk at just one third of original entry, i should have been able to live with that.... I recognised the pattern merely 30 seconds after stop out, but PA had already risen and gone away from that level.... the trade had gone... I swear i will recognise it earlier next time!
Result; market went to target quite quickly without me onboard... pissed off? yes, but another feather in the cap as it were... carry on...

*Edit* In trying to determine the correct labeling, i am preferring some kind of double or possibly even a triple zigzag. Info says expanding triangles shouldn't occur in a 'C' wave and a diagonal would be contracting. PA also didn't conform within the lines, so a triple zigzag in an 'X' wave it shall be... same conclusion as to stop placement and same result with system target having now been met.
Davai - 12 Oct 2012 09:19 - 121 of 423
Hmmmmm, EW working well recently. Again, draw your lines from point 2&4 and run a parallel off of 1 to find likely target for 5. In this instance no valid trigger occured out of the flagline of 4. It is highly unlikely that this current hourly candle will print higher than the previous candle as it would trigger a far higher target.
We can expect an abc 'B' wave back down later, but probably a HH to come yet;

*Edit* there has been absolutely no further evidence of a turn so far and it looks like the last HH could be breached thus a 3rd wave to the longside...
We can expect an abc 'B' wave back down later, but probably a HH to come yet;

*Edit* there has been absolutely no further evidence of a turn so far and it looks like the last HH could be breached thus a 3rd wave to the longside...
Davai - 16 Oct 2012 09:29 - 122 of 423
Continuing from last post and also recording a couple of thoughts;
As above; we came back down in an ABC corrective (B) wave and have since printed what i suspect is another 5w up, (of which we may have just seen the top (speculative for now);

So, my overall thoughts are that we have possibly completed waves 1&2 of a large 'C' wave with the rest to follow shortly. If correct, this can take many forms, so again the next couple of charts are highly speculative. I'm posting them just to be able to compare to the actual event in a couple of weeks time...
It does however mean that i have something to work to and will now look for more evidence, starting with a LL/LH combo's.

or perhaps something like this;

I'm using this thread purely as a diary. This is not to try to claim guru points! Been there and made myself look silly on far too many occasions. EW has a way of presenting a case for both directions, however as i see it, what we have now looks very much like a 5-3-5 complete or nearing completion, so i am certainly looking for a trend change and some pippage to the short side soon with the possibility of the above scenario playing out... If it doesn't then at least i can look back and study to see what was different and how i can apply it to future analysis. There is STILL a case for 'B' being a fresh wave 1 and thus reality could be the exact opposite! with it being time to get long and strong, but i don't think so; it looks too much like its in a 3 wave move (corrective)...
As i have previously pointed out, i actually only play the smaller timescales and thus look for the HH/HL or LL/LH combo's and try to suss 5w/abc moves intraday, so its a case of building a picture and trading accordingly. Regardless, its nice to have a general plan to work too...
Just to include a further chart, here i can see we have reached a Fib retracement level of the larger 5w move down, coinciding with a trend line of an expanding diagonal, ending at the point 'E'.

*Edit* A fresh HH invalidates the above.
Clearly, the labeling in the last chart was wrong; '3' would be '5' (top of wave 1) and '4' was wave '2'. This makes me think the recent down move was a 4th and we are now playing out the 5th...
One possibility;

But i now prefer this : Daily;

Davai - 18 Oct 2012 10:11 - 123 of 423
Using Fib retracement levels to determine likely end of corrective moves, in this case with the UsdJpy, the main phases (2&4) retrace 50% of the previous impulse wave (1&3) and the subwave 'iv's of 3&5 retracing 38.2% respectively...
Next step is to look for some likely targets for the 5th;

Next step is to look for some likely targets for the 5th;

Davai - 18 Oct 2012 10:20 - 124 of 423
25/10/12
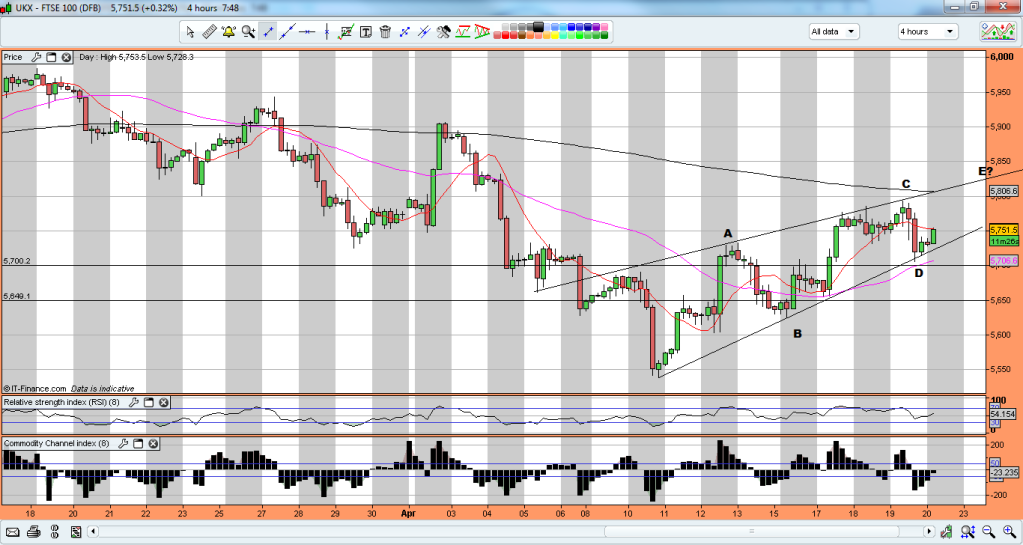
Possibility of an expanding diagonal 'C' wave;

bigger picture;

If so, be wary that 'E' might be somewhat truncated, it might only just make a fresh low. The 61.8% fib of wave 'A' is common for length of the 'C' wave (red circle) or 76.4 could meet the trendline etc... of course 100% and more is poss too... but if it reverses off the top TL, expect a big down day tomorrow.
Davai - 31 Oct 2012 15:37 - 125 of 423
Update;


Davai - 24 Nov 2012 17:46 - 126 of 423
Post 122, i was looking for a 5 move 'C' wave;
In actual fact the 'B' wave was slightly longer, made a clear 5-3-5 and thus made a HH (looks far more obvious now!), before starting the drop for the 'C' wave. I was a little optimistic with the length perhaps, although the chart was meant purely to show the idea of the 5w 'C' (and not necessarily to scale);

and as this was from a few days ago, i can now see that we had a 'truncated' 5th wave to end with...

Davai - 01 Dec 2012 14:42 - 127 of 423

Update, ending diagonal 'C' wave, finished a little short of expectation, but the 5w followed as suspected;

The bigger picture suggests there is a mountain of downside coming;

*Edit 03/12/12* The above chart shows what was the 5th subwave of the third, thus the pullback seen was the fourth, another high followed also adhering to the rules;

Davai - 01 Dec 2012 15:08 - 128 of 423

Update, bit more difficult to follow, with 'irregular' corrections for both waves 2&4, but 5w up as suggested;

Davai - 01 Dec 2012 15:23 - 129 of 423

Davai - 01 Dec 2012 21:12 - 130 of 423
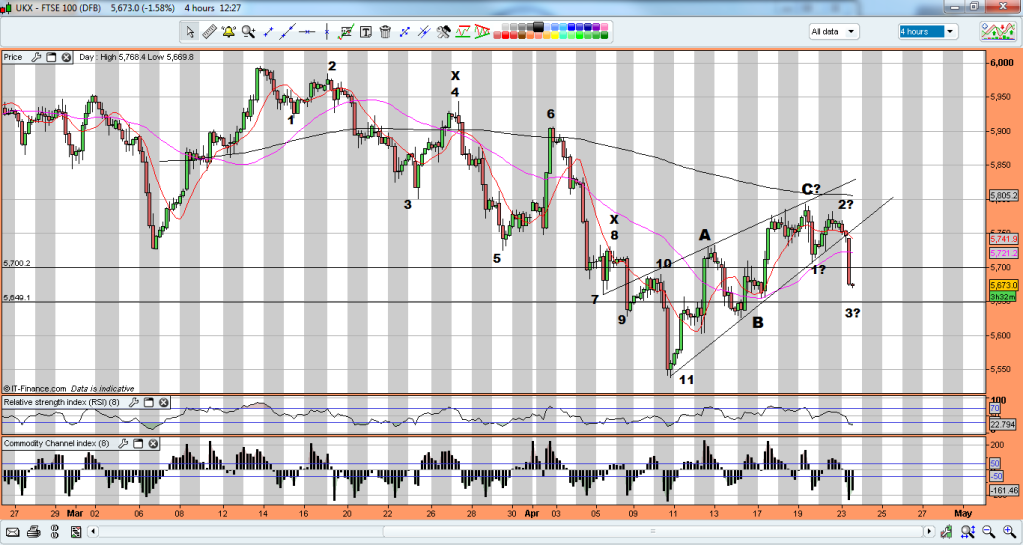
I dont normally trade index's, but catching up on Cinners thread earlier i thought i would run my eye over the FTSE. My belief is that the down move has been corrective and we have now completed a 5w advance, which means we will now correct in another ABC. The caveat right now is that we don't know what form this will take;

The fifth looks to have reached its target and zooming in on the final 5th wave, the evidence is stronger again;


The fifth looks to have reached its target and zooming in on the final 5th wave, the evidence is stronger again;

Davai - 04 Dec 2012 09:58 - 131 of 423
GbpJpy Update;

EurNzd; Difficult to determine right now, looks like a 5-3-5, which would mean an 'X' wave and thus a triple zigzag, with the 'Z' to come... more upside yet?
Second set just completed;

Will update NzdUsd later, looks like a bigger ABC than expected, still with 'C' to come?

EurNzd; Difficult to determine right now, looks like a 5-3-5, which would mean an 'X' wave and thus a triple zigzag, with the 'Z' to come... more upside yet?
Second set just completed;

Will update NzdUsd later, looks like a bigger ABC than expected, still with 'C' to come?
Davai - 05 Dec 2012 10:06 - 132 of 423
Post 129; NzdUsd;

Update; as suspected, it looks like we're well into the 'iii' of the 3rd now...

Update; as suspected, it looks like we're well into the 'iii' of the 3rd now...

Davai - 06 Dec 2012 13:25 - 133 of 423
Post 127, Ref EurNzd;
'The bigger picture suggests there is a mountain of downside coming;'

followed by, post 131;
'EurNzd; Difficult to determine right now, looks like a 5-3-5, which would mean an 'X' wave and thus a triple zigzag, with the 'Z' to come... more upside yet?'
We have since had some decent downside and a new low a moment ago, (breach of the low to the left of the chart), i would think negates the possibility of it being an 'X' wave.
As always a picture (chart) says a thousand words;
The drop;

Glad i got this one right, cos i completely f*cked up the FTSE predictions. The drop is coming, but no LL/LH combo's yet, in any case, i have since realised what i did wrong and learnt a little more from it, so its not all bad...
'The bigger picture suggests there is a mountain of downside coming;'
followed by, post 131;
'EurNzd; Difficult to determine right now, looks like a 5-3-5, which would mean an 'X' wave and thus a triple zigzag, with the 'Z' to come... more upside yet?'
We have since had some decent downside and a new low a moment ago, (breach of the low to the left of the chart), i would think negates the possibility of it being an 'X' wave.
As always a picture (chart) says a thousand words;
The drop;

Glad i got this one right, cos i completely f*cked up the FTSE predictions. The drop is coming, but no LL/LH combo's yet, in any case, i have since realised what i did wrong and learnt a little more from it, so its not all bad...
Seymour Clearly
- 06 Dec 2012 19:34
- 134 of 423
Thanks for these Davai. I tend to trade cable, fiber and chunnel only. Any particular reason for trading the currencies that you do?
Toya
- 06 Dec 2012 19:46
- 135 of 423
Very impressive Davai! So: short FTSE then...?
I daren't trade forex, though if I did I would probably expect the Euro to go down vs the US$ - in the light of today's comments by Draghi
I daren't trade forex, though if I did I would probably expect the Euro to go down vs the US$ - in the light of today's comments by Draghi
Davai - 07 Dec 2012 14:22 - 136 of 423
Hi guys (&girl/gals!), well... i've been learning all this intensely for a while now, but having swung away from my flag trading system to focus more on Elliott. The mistakes are coming thick and fast still, however, the info i've acquired recently has unlocked a huge part of it, i'm on information overload right now and my head is going to explode soon, of that, i'm sure!
SC, thanks! I basically look for pairs which respond well to Fib ratios, so i'm not tied to any in particular. They all fade in and out with regard to accuracy... i guess the market wouldn't want to make it easy?! On top of that, i need the wave structures to be clear... again this comes and goes, but the EurNzd in particular is proving to be a dream right now... Unfortunately its still managed to lose me in the last day or so, with regard as to where we are within the phase... I should have simply stayed short...
Toya, thankyou! With regard to the FTSE, i closed the chart the other day and haven't looked back! I think there was another set of waves in the making, (more upside yet?), so i'm not too sure. If i get the chance later i will take another gander!
Longer term, i think the Euro will achieve parity with the $, but loads of time yet and lots of decent (large) corrective pullbacks along the way...
Davai - 07 Dec 2012 14:30 - 137 of 423
Loads of info here... I was actually concentrating elsewhere, so although this was on one of my monitors, i didn't make any use of it. This is hindsight info, but it will certainly stick in my mind as of now... I was certain the rise earlier this morning (to the RHS of chart and off of the 261.8% fib of wave A), was a 5w signalling the end of the corrective move, so entering the trade on (what i deciphered as) the abc decline and with my stop a pip below the previous red bar (ending by the 261.8% fib and red line), i watched as it drifted down and took me out of the trade... I point blank refused to move my stop down to a pip below the start of the advance (point 0).
I set about investigating the 4 hrly & daily and realised this whole upswing is corrective. I was just working out what to do when the jobs data came out and unfortunately missed the massive rise.
Its always nice to get it wrong and lose some dough every once in a while isn't it?! )
The great thing about this kind of trade is, get it wrong and you will always find you are only stopped out by a mere handful of points, then watch it head very rapidly in the original direction without you on board, maximum pain and a great left hook applied by the market me thinks... the safe stop placement was as i said above, a pip below point 0... I should have known better!
Anyway, with the previous wave 4 (of 'C') now breached to the upside, it should be proof enough that this is the start of a larger 3rd wave and hence a lot more upside yet for this pair.... Now to find a low risk entry (as i keep saying... nothing is set in stone!)
Here's what i'm talking about;

Davai - 07 Dec 2012 15:58 - 138 of 423
Trouble with posting a chart or thought, is that when it changes, i am compelled to update it/them!
I'm now actually suspecting i may have been right with my expectation of the 5w short count, finishing where i suspected but possibly not as a 'C' wave... an 'A' of a larger correction. It fits with the rise, drop and subsequent rise being an 'abc' 'B' wave and also permits the previous 4th to be broken... Gonna stay out and watch instead...
*chart to follow*
Seymour Clearly
- 07 Dec 2012 17:00
- 139 of 423
I could never get the hang of Elliott! I'm much more of a 'look at the chart and follow the pattern', support, resistance trendlines, occasionally fib levels, MACD, rsi etc. Don't make many trades, just like them to be glaringly obvious when I do.
Davai - 07 Dec 2012 17:40 - 140 of 423
Agreed.... Elliott on its own doesn't amount to much imo. The problem being that Corrective moves look exactly like the inverse of Impulse moves with ABC's also respecting similar fib levels.. but knowing which fibs to apply and where is a huge part of the jigsaw.
You make a very valid point, however... most people feel compelled to trade whenever they are in front of the screen... having the discipline to sit and wait and stick to what you know is an art itself!
You make a very valid point, however... most people feel compelled to trade whenever they are in front of the screen... having the discipline to sit and wait and stick to what you know is an art itself!
Toya
- 07 Dec 2012 18:59
- 141 of 423
That's very good advice you two :) and one that I need to adhere to more often!
Davai - 07 Dec 2012 20:02 - 142 of 423
Toya, i looked at the FTSE and its got me a bit stumped, seems to be resistance just above us, which appears significant, it keeps trying to break above so if it does, a retest and we should be good for higher, otherwise i suspect we roll over and may actually have already begun... so to sum up i think it may go up... or down )
To try to explain my previous post, or at least to record my own thoughts. I have switched to the EurJpy. I think i was right to consider long (short term) on both this pair and the GbpJpy as per my original idea (the 4th of the 'C' wave down, on the Gbp, being breached on the way back up, on the jobs data spike earlier), however i think its trend change time and its actually only going to be an ABC correcting yesterdays/todays 5w down. I cant explain what i perceive to be the A&B waves beforehand though, so i will be a watcher for a mo... anyway, my reason for thinking this is from labeling the Eur tonight... first the daily;

So the bigger picture... the double ABC's around the middle fits with being first the 4th (subwave) of the 3rd and then the full 4th shortly afterwards once the 3rd was complete... all the measurements fit. With that in mind and switching to a smaller timescale to concentrate on the 5th wave;

so we have wave 3= 100% of wave 1, 2 is irregular, wave 4 retraces 50% of wave 3 and wave 5 has reached its popular 38.2% extension. The pullback appears to say that was the top... of course this is just my opinion based on what i've highlighted and its too early to trust it. I have had a nightmare day and probably should be having a beer right now instead.... anyway, i guess the next move is to concentrate on the move back up, of which we look to have completed the A&B already. If 'C' is in a small 5w and doesn't make a new high, we can look out to have started a larger ABC which will correct the whole 5w move since July (which was around 1400pips), even if its shallow, or Irregular its gotta mean 600+ pips south of here over the coming weeks, before we gear up for a fresh complete 5w back up higher... thats the theory... right where's that beer!
*edit 08/12/12; hmmmm there may be a possibility that i'm one count out... the 3&4 above might be 'iii'&'iv' of this particular third, with the 5th being the end of the 3rd. I've made this mistake a few times recently... will do some more work on it later*
Davai - 07 Dec 2012 20:26 - 143 of 423
Breaking it down even further, here is the 5th wave of the 5th wave (of the 5th wave!);

Looking at even this cycles minor 5th, it all fits. I will look at Fiber next to see if the recent drop is likely to continue (all imo!), but its time to unwind now. Have a good weekend all...

Looking at even this cycles minor 5th, it all fits. I will look at Fiber next to see if the recent drop is likely to continue (all imo!), but its time to unwind now. Have a good weekend all...
Toya
- 07 Dec 2012 20:45
- 144 of 423
I'll leave the forex to you, Davai! Couldn't begin to do all that analysis... But I agree we've been testing around 5920 on the FTSE - I feel we may have reached the top there for a while; we'll soon see if that's correct!
Davai - 08 Dec 2012 10:20 - 145 of 423
Copied edited remark from above post 142;
*edit 08/12/12; hmmmm there may be a possibility that i'm one count out... the 3&4 above might be 'iii'&'iv' of this particular third, with the 5th being the end of the 3rd. I've made this mistake a few times recently... will do some more work on it later*
The more i look at it, the more it looks more likely... the double ABC again same as with the daily. I was obviously too tired last night! Honestly... mental state is also a big part of trading! It will mean that we are in the 4th (or just finished) right now and still have a blast north yet for the 5th of this degree. This can of course be extended, so its obvious to me the only safety will be to rely on the small time scales.
The reason for all of this? I'm looking to trial a bit of swing trading and see if i can ride a much longer phase. It goes against my usual style as i absolutely hate to stay in corrective moves and watch precious profit disappear time and time again, preferring to be in and out in succession. The problem is often missing the larger move while 'out' of a trade. That means an awful lot of work making small amounts and missing the larger portion...
All of the above charts are workings as to try to find the next big trend. As you can tell, however, it can be tricky and requires more (at this time) experience than i currently possess. This is a work in progress!
Trying to trade a wave 2 pullback to be positioned for wave 3 is proving to be lethal. The best trade and easiest to recognise is after the powerful wave 3 itself. If wave 3 doesn't extend (is not more than 1.618% of wave 1), and wave 4 retraces 38.2% of wave 3, you have a fantastic low risk trade, going with trend off of this fib level to trade the 5th wave. Your stop is a couple of pips inside wave 1 as wave 4 mustn't cross into this territory, therefore should be around a 1:3 R:R...
hilary
 - 10 Dec 2012 07:58
- 146 of 423
- 10 Dec 2012 07:58
- 146 of 423

The reason that you probably find the kiwi generates easy to follow chart patterns against the greenback is that it's what I would describe as a 'single sided' pair.
By that, I mean most pairs and crosses are influenced by two distinct sets of newsflow. For instance, if you're trading fiber, then Europe's events will influence the pair, as will the newsflow out of the US. If both sets of newsflow are either positive or negative, then the pair can be a bit choppy until the market decides which side's newsflow carries most weight. If one side's newsflow is positive and the other side's newsflow is negative, then the moves will be more exaggerated as a result.
However, New Zealand as a country carries no real economic influence. It has no mineral resources, there are more sheep than there are humans, and they make some nice butter. But that's about the extent of it. The kiwi has historically been used sometimes for carry trades, but not at the moment. Therefore, there's unlikely to be any news coming out of NZ which is going to have any impact on the NZD/USD, and the pair is going to be almost totally influenced by the newsflow out of the US. This single-side aspect is what makes the chart easier to read and interpret.
The downside of this is that the minimal liquidity in the pair means retail punters will generally have to pay high spreads. Everything I've said about NZD/USD also applies to the EUR/NZD cross.
Davai - 11 Dec 2012 12:18 - 147 of 423
FTSE S/R line. Rejected yesterday, but teasing with it again now;


Davai - 11 Dec 2012 12:41 - 148 of 423
Very difficult to call wave structure with accuracy and i'm not getting many levels lining up, (usually means something is amiss), so not to be trusted, but just putting this out there;


Davai - 11 Dec 2012 13:09 - 149 of 423
I can't see an end in sight yet!
If the above is correct and regardless of whether its the 5th of the 3rd or the overall 5th, we should head higher from here (after a brief pullback this afternoon/evening), in a 3rd wave;

If the above is correct and regardless of whether its the 5th of the 3rd or the overall 5th, we should head higher from here (after a brief pullback this afternoon/evening), in a 3rd wave;

Davai - 11 Dec 2012 13:26 - 150 of 423
Somehow i managed to **** this trade up, despite watching it closely yesterday, pretty annoyed with myself, especially as i stated merely three days ago, its my fave trade, (the 4th wave pullback), admittedly, there was a bit more risk as wave 3 was extended;

Wave 5 might not be finished yet, but the 38.2% was primary objective, 16,100 being a round number was also going to provide res...

Wave 5 might not be finished yet, but the 38.2% was primary objective, 16,100 being a round number was also going to provide res...
Davai - 12 Dec 2012 09:39 - 151 of 423
Euro about to turn down again?

Current move would be A&B (not 1&2) with 'C' to come

Current move would be A&B (not 1&2) with 'C' to come
Davai - 12 Dec 2012 09:58 - 152 of 423
Turning back to the EurJpy again, its looking likely that i labeled the 4th of the third as the 4th itself again. Explains the confusion late last week. When i noticed it reversed at the 50% projection, it leads me to believe it was likely end of the 5th. If this is correct, we wont breach the blue line, so possibly a good risk/reward trade at present. Breach of this (a fresh HH) and its rethink time, there is still a count meaning the previous 1&2 was an A&B... I would prefer to wait to see a minor 5w short/abc retrace first off of the fib level (red line).

*Edit* Ok, a fresh high, so either 1&2 was an A&B, or its a much larger irregular. Can't see it being irregular as it would mean the down move was 'A' in three waves...
(I'm writing this for my benefit, i doubt anyone is following me and nodding in agreement!)
*Edit x2* sussed it i think... a small wave 'C';

No wonder i've been turned inside out with this one. Far too many possibilities until the HH earlier. Especially with an irregular 'B' wave. So a long at the lows got stopped out and a short at the highs likewise. Nice one. Malodyets mr.Market... Thie is why i'm preferring to stick with the 4th wave trades... far easier too determine and goes with the immediately preceding trend...
Davai - 12 Dec 2012 10:27 - 153 of 423
Same mistake again and again... previous labeling for cable, for the 3rd wave only. It doesn't change the respective levels, so the workings are all good, just that there was the 'real' 4th and 5th to come;


Davai - 12 Dec 2012 14:29 - 154 of 423
Fifth waves (and 'C' waves) can be tricky to trade, presenting themselves in several different manners; diagonals, expanding and contracting, (both of which can see wave 4 cross into wave 1) or in a regular impulsive structure. Here, breaking cables 5th wave down on a lower time frame, the 3rd wave gives it away again, leading to another set-up. Don't forget its not about pips, its about percentages;


Davai - 14 Dec 2012 08:27 - 155 of 423
Dax again, in post 149, i was expecting a small ABC pullback that afternoon/evening (11th). It happened but not before having a further blast north, so no brownie points there;

The larger ABC (4th) is not the one i have shown (expecting) in post 148. The size of this current cycle makes me believe it is indeed a 5th wave and probably finishing off (the larger) wave 3. That would mean a HH to come followed by a longer, deeper and more complex retracement, possibly lasting a week, before back on track to finish the year... The caveat is (and there has to be one with this kind of trending!), is that, if the previous larger ABC (ending on the 9th) was something more substantial, we could be playing out the overall 5th right now and once finished, get ready for a big drop... personally i don't think so... I reckon Mid Jan before putting the hats on... Just an opinion )
PS, the blue line... Wave 4 not entering wave 1 territory; what a fantastic R:R trade!
Davai - 16 Dec 2012 20:09 - 156 of 423
Might have to change my above view. Looks like it might be the overall 5th afterall. Got a few charts looking like some tops very near indicating dollar strength about to return. Risk off again?

16190 also relevant.
My earlier Euro call was dreadful and influenced slightly by the EurJpy chart, After i worked that one out i didn't bother to update the Euro chart. I now think the breach of the prior ABC can be explained like this;

The 4th wave allowed to breach the (iv'th) of the 3rd. I would normally expect only the 61.8% level for the top (as we reached on Friday afternoon), however, channel lines leave headroom for a little bit more. The channel lines (blue) working perfectly for predicting the end of wave 3 (connect 2&4, draw parallel off of top of 1 for end of 5), the second set obviously wont work the same due to the pullback of 2, thus we go off of the top of 3 for our parallel line... Well, we shall see... )
Davai - 16 Dec 2012 21:12 - 157 of 423

Davai - 17 Dec 2012 08:56 - 158 of 423
When we reach the end of this cycle, it will be the first 5 wave of correction, expect a zigzag ABC 'B' wave retracing typically 50% of the whole upswing (approx 500pips currently), before a further 5 waves up;


Davai - 17 Dec 2012 12:12 - 159 of 423
Post 156 Cable;
Update;

*Edit* A cluster of Fibs, 2nd/3rd and now 4th degree are lining up at 16,230 area.
Update;

*Edit* A cluster of Fibs, 2nd/3rd and now 4th degree are lining up at 16,230 area.
Davai - 17 Dec 2012 13:47 - 160 of 423
Bit of fun with everyone's favourite;
First the weekly;

There is of course the possibilty the labeling after the 1&2 could be for for the 3rd wave, thus we are in the 4th right now, but i doubt it. Wave 5 being exactly 100% of 3 for a start...
Daily (concentrating on the 5th);

Shows we have clearly finished wave A of the corrective move.
Now to the 4hr to look at the corrective move;

This is very tricky to call, it's nigh on impossible right now to rule out a very short, quick 'B' wave having already finished, however, i would imagine not and we have merely completed minor wave 'A' (of 'B') and are somewhere close to the end of minor wave 'B' right now (either a flat or an irregular). It is a 3-3-5 move and thus once we turn, we should head back up to make a HH to complete the larger 'B' wave (not to time scale). I have the blue line penciled in, if the label for the 5th minor of the 'A' wave is correct, being extended, we should correct back to that cycles wave 'ii'... Lets see... Certainly not taking a trade off of this yet. Once we know for sure we are in wave 'C' its time to get short some more... $35 middle of next year anyone?
Davai - 19 Dec 2012 10:21 - 161 of 423
GbpJpy made a partial 'gapfill', after a clear ABC (where the EurJpy did indeed gapfill), we get a flag set-up and target;

The result;


The result;

Davai - 19 Dec 2012 11:05 - 162 of 423
How much further can we go? Combining some channel lines on the Dow;

and scaling in;

an approximation, i see the lines have slipped a bit from being produced on the 4hr... IG's charts... grrrrrrrrr

and scaling in;

an approximation, i see the lines have slipped a bit from being produced on the 4hr... IG's charts... grrrrrrrrr
Davai - 19 Dec 2012 11:38 - 163 of 423
The thing that would concern me here is that we haven't had an extended wave of the 3rd (yet), its highly likely that the 5th could be. Raising the channel line off of the top of the 3rd gives more scope, but 5 going to 100% level wouldn't surprise me;

I will be keeping a close eye on smaller timescales to watch for a reflex point to be broken in a minor 5w move south, until this happens its go long off of every ABC...
I have another set of channel lines off of the whole move, but we would need a 300+ point up day to get anywhere near them...

I will be keeping a close eye on smaller timescales to watch for a reflex point to be broken in a minor 5w move south, until this happens its go long off of every ABC...
I have another set of channel lines off of the whole move, but we would need a 300+ point up day to get anywhere near them...
Davai - 19 Dec 2012 14:03 - 164 of 423

Davai - 20 Dec 2012 08:30 - 165 of 423

So first 5 wave move short and breach of previous reflex points (as has happened on index's and various dollar pairs), followed by an ABC , suggests more downside to come, (after the 'C' of 'B' finishes)... either the second 5 wave move ('C' wave), if corrective, or perhaps the start of something a little more severe...
Davai - 20 Dec 2012 10:20 - 166 of 423
Could that have been a big ole 4th?


Davai - 20 Dec 2012 12:49 - 167 of 423
Back to this afternoon and the more immediate plan, i'm hoping for a clean trigger out of the flag for virtually gauranteed target. Lots of waiting for the trade to materialise, but at least the plan is in place... no trigger, no trade... lets see;


Davai - 20 Dec 2012 13:10 - 168 of 423
The chart in post 165 is actually awesome, despite looking like a bloody rainbow!
Using channel lines on top of Fib's can build a deadly picture. GbpJpy this time, same outcome, (this is done in hindsight, i must confess... i was elsewhere at the time);

Using channel lines on top of Fib's can build a deadly picture. GbpJpy this time, same outcome, (this is done in hindsight, i must confess... i was elsewhere at the time);

Davai - 20 Dec 2012 15:47 - 169 of 423
Post 167; It presently looks as if we are playing out the 'C' wave of the correction. I don't like the way it made a clear 5w short, ruling out a flat or irregular 'B' wave and yet clearly retraced well in excess of 61.8% of 'A'. It would normally mean, that instead of it being a 5-3-5 correction, it was actually waves 1&2 of a new down move, however as i have shown in workings earlier, the bigger picture, i believe trend is still 'up' right now...
It looks far more likely we have just created a lovely angle for a flagline (long) and this 'C' wave will be somewhat short, possibly even with no fresh low. Its too difficult to call right now, but the extended 'B' wave earlier effectively ended the hope of a flag trade and thus we must adapt to the new PA...
I did short this 'C' wave, but have already banked profit, as i can't read the wave count right now. It could be creating a much larger leg (short), but i don't think so, time to watch and wait for more evidence. The market will still be there tomorrow and to be fair, i would now rather be looking for this scenario instead (*subject to change!*);

The 61.8% level of 'A' (for total of 'C') puts it currently right on the lower blue flagline.
Davai - 20 Dec 2012 15:52 - 170 of 423
Incidentally, these were the workings to determine the likely end of minor wave 'C' of the 'B' wave;

Minor wave 'C' was 238.2% of minor 'A'.

Minor wave 'C' was 238.2% of minor 'A'.
Davai - 20 Dec 2012 16:05 - 171 of 423
Hopefully if any lurkers are following you can understand me?! Take the chart in 169, (i kept it simple), delete the A&B and replace it with 1&2 and you can see the opposite scenario exists, it would mean we are now in the 3rd and could go a long way south. Unfortunately, as easy as the Euro was to read last night, its currently not so obvious. When in doubt stay out... a bit more PA and it should become obvious!
My thoughts are that we didn't reach any important Fib level that i could see to call a top. There are many counts that this pullback could conform to and thus still be merely corrective. We will know soon enough.
My thoughts are that we didn't reach any important Fib level that i could see to call a top. There are many counts that this pullback could conform to and thus still be merely corrective. We will know soon enough.
Davai - 20 Dec 2012 16:11 - 172 of 423
Just as an aside, it might be a bit early to state this just yet, but, right now the Dow has also bounced cleanly off of its lower channel and as previously stated, i reckon it has further north to go yet and this is a corrective move... PA a little difficult to determine right now, but by rights we should now be in our 'B' wave, a clean break of the lower TL will gain attention.

I'm currently watching to see if i can recognise a minor 5w up or down. Again this afternoons data has made things a little harder to decipher... time for a cuppa instead!
*Edit* late Thurs eve, looks like being in minor 'C' of 'B', so 5w short to come?

I'm currently watching to see if i can recognise a minor 5w up or down. Again this afternoons data has made things a little harder to decipher... time for a cuppa instead!
*Edit* late Thurs eve, looks like being in minor 'C' of 'B', so 5w short to come?
Davai - 20 Dec 2012 19:54 - 173 of 423

Davai - 21 Dec 2012 09:06 - 174 of 423
Wow, some nasty spike down on the Dow. Hmmmmm, sometimes being GMT+2 can be a right pain in the arse! I feel that working 12 hours a day is quite enough! I felt last night, before shutting down, that we were in minor 'C' of 'B' with the 'C' wave short to come. However, it could have dragged on for all night for all i knew and my disciplined approach means i can't take a 'freestyle' short, there has to be the minor 5w down first to enable a stop placement (pip above the high). On top of that, who knows how severe the 'C' wave will be? It could be shallow, long, slow, diagonal etc etc, but its always annoying to wake up and see a really fast and deep one missed!
Ok, my own words, the market will still be there tomorrow...
It looks likely the top of the 5th of the 3rd was indeed reached as with the breach of the previous lower TL last night, it makes this a likely 4th. A break of 13,013 negates, (which also makes the low of the spike one hell of a good R:R trade), no good seeing it in hindsight admittedly, however!).
We should now be able to re-adjust our channel lines and start looking for projections as to a 5th wave;

As always, nothing is set in stone. The one thing to stress is that, views, targets change with more PA, a plan is exactly that, it can later be proved wrong, but so long as we adjust accordingly and only take the low risk trades, then we can beat the market. Its obvious that one wrong count can throw everything out and cause losses, that's where the discipline kicks in...
Right, looks like i'm missing tonnes of 4th waves right now... lots to do, little time!
Davai - 21 Dec 2012 09:09 - 175 of 423
Possible Cable;


Davai - 21 Dec 2012 09:32 - 176 of 423
That will teach me... posting on here instead of working... just missed what appears to be a 4th wave trade on the GbpJpy. Remember yesterday? A clear 5w 'A' down move. Obviously followed by B&C;

Now a close up of 'C';

Bit hastily done, so will try and determine a minor 5/3, in case its not too late for a trade...
*Edit*, hmmmm the 'C' wave of 4 isn't clear enough, so will watch this one with hands sat upon...

Now a close up of 'C';

Bit hastily done, so will try and determine a minor 5/3, in case its not too late for a trade...
*Edit*, hmmmm the 'C' wave of 4 isn't clear enough, so will watch this one with hands sat upon...
Davai - 21 Dec 2012 11:07 - 177 of 423
Quick update, post 155; Dax;
(The '5' was as far to the right of the screen as i could manage and not meant to be to scale!) I'm not pretending to be able to call the wave structure in advance. I never took this trade as i missed the best entry point (again!), the point is it that the prediction was higher to come... even banking at point 'a' would have seen a handsome profit. I need to get sharper...
Update;

Davai - 21 Dec 2012 14:17 - 178 of 423
Post 176, GbpJpy... A frustrating day, missed entry by couple of minutes and the minor wave 2 was complex, thus impossible to read, todays missed trade;
Earlier;
Update;

That's 80 pips gone begging (and an original 35pip risk, although any deeper than the 38.2% retrace level and its highly unlikely to have been a 4th wave any longer, so feasibly, you could have reduced that to 10pips)
Primary target (the 61.8% extension) has been hit, not being able to read the 5th wave, would have seen me exit here. Nothing wrong in leaving a bit for the next man if it continues lower. It may head to its lower TL and the 100% level, but if the trade had been taken, i know in my heart the profit would have had to have been banked here! Look for the next set-up i guess...
Davai - 21 Dec 2012 16:44 - 179 of 423
Ok, so who shot Cable then? Come on, own up! I thought there was lower to come, but i didn't realise how poorly it was feeling.
Ok, well, time to get off of here. My friends King Kavod and Baron beer are here, so its better for all if i refrain from posting anymore tonight!
Have a great weekend all... )
Ok, well, time to get off of here. My friends King Kavod and Baron beer are here, so its better for all if i refrain from posting anymore tonight!
Have a great weekend all... )
Davai - 24 Dec 2012 17:00 - 180 of 423
One last one this side of Christmas! I say that, but for me, where i am, Christmas is 7th Jan and a very traditional affair... nothing to do with giving of gifts at all, so its not feeling particularly Christmassy for me at all right now, (apart from the fact there is three feet of snow outside)
Anyway, hour and half ago;

Update, (slight adjustment of lower TL req'd);

Merry Christmas all )
Anyway, hour and half ago;

Update, (slight adjustment of lower TL req'd);

Merry Christmas all )
Davai - 03 Jan 2013 13:12 - 181 of 423
So a Happy and (hopefully) prosperous New Year to everyone.
Euro; and i was getting all geared up to look further south earlier (after an ABC retrace)

however i notice that, looking on the daily, the 5-3-5 (Y wave) shown above (100% of each other) doesn't reach any Fib level of the first set (W) wave;
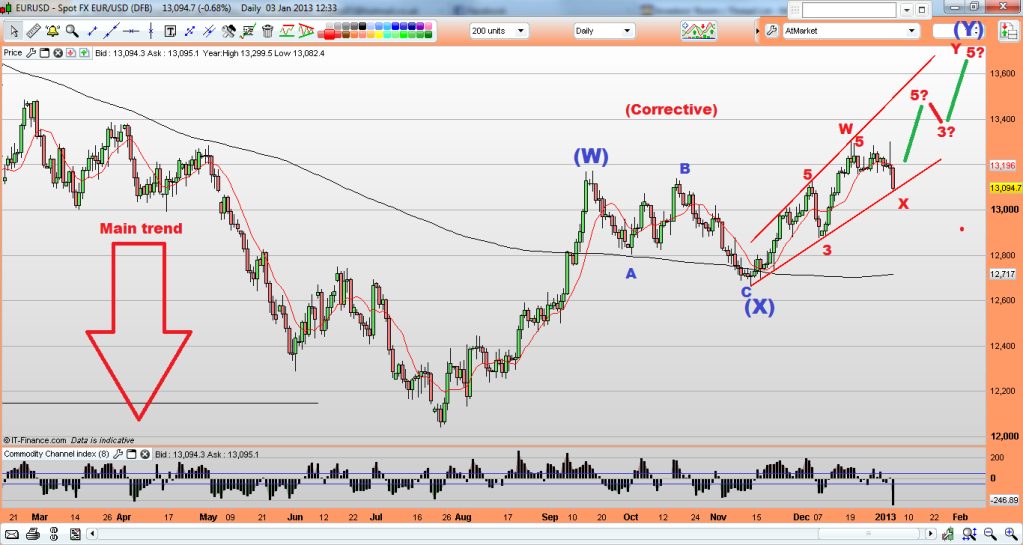
Therefore it is far more likely to be broken down into a further W-X-Y move of which we are near the end of the 'C' wave of the 'X'. This would see a further complete 5-3-5 to come (on the daily) taking us to approx 13,800 which will be 100% of the original 'W' wave...
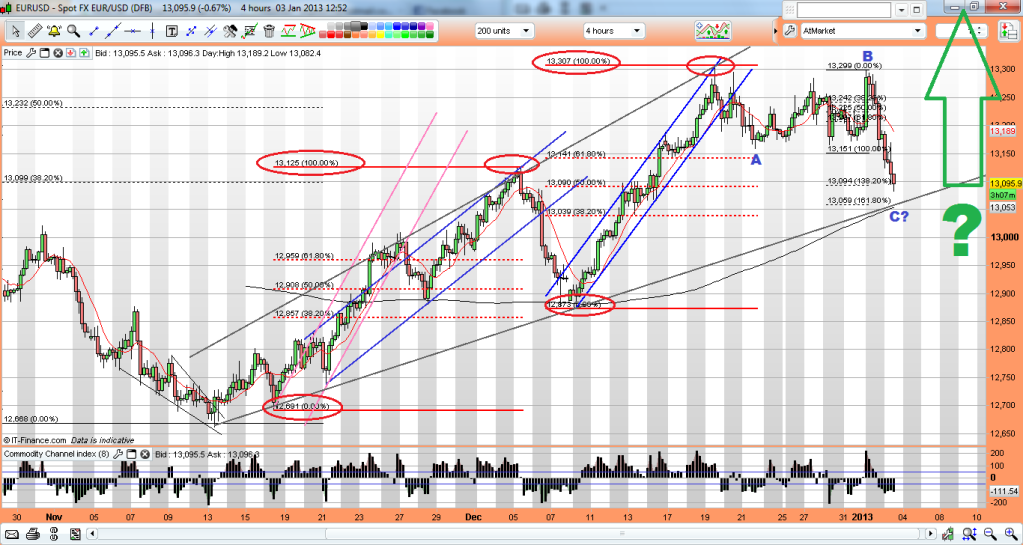
The recent ABC count looks far more likely (imo).
Ok, so this is looking longer term and merely an overall plan; The next thing to look for will be minor 5 waves up ('A') breaching the prior 4th wave (reflex point), after a smaller ABC retrace ('B') we can get long, knowing at least we will have a 5w 'C' to follow.
Failing this, an (irregular) ABC will signal further weakness.
Davai - 03 Jan 2013 14:09 - 182 of 423
Bit of fun with the Dow, needs more evidence yet, but the way it respected the 61.8% & 38.2% fib levels on the recent pullback, looks ominously like ('A' & 'C' corrective waves);
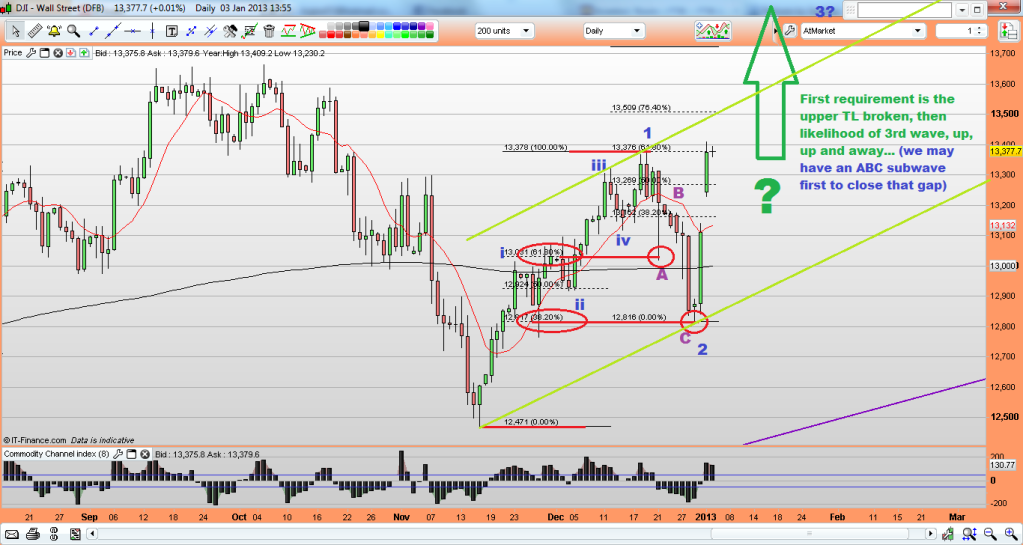
Remember we have a couple of months yet before the 'Fiscal Cliff and debt ceiling prob's will resurface, so it's certainly a possibility... still lots of shorters around to fuel the rally...

Remember we have a couple of months yet before the 'Fiscal Cliff and debt ceiling prob's will resurface, so it's certainly a possibility... still lots of shorters around to fuel the rally...
Davai - 03 Jan 2013 20:12 - 183 of 423
Ok, so i've mentioned having an overall trading plan, but that i trade on smaller timescales. Here is an example;
Post 181, earlier this afternoon contained this chart;
Its the 4hr Euro showing the fibs of wave A replicated to wave C. I also have a trendline (in grey) meeting the common 161.8% extension at approx 13,060, so this was a valid target.
Now looking closer at the C wave, i have my Elliott channel lines and fib extensions drawn in. I also have a 61.8% extension at the 13.060 level. Add to this that the PA this afternoon (purple circle) looked decidedly corrective, it started to look even more like a certainty...

Here i have zoomed into that area to further explain;

I couldn't label it any other way than to be corrective and breaking down the subwaves, it was possible to have confidence in entering short near the top of the 'C' wave. With the channel lines in place, the stop point was just above the top TL (nothing is set in stone!).
However, shorting at 13,115, stop at 13,140 and target of 13,062, was both high probability and also good R:R.
An earlier flag system trade also gave a lower target of 13,046.
The Euro has certainly been weak the last couple of days and i'm struggling to label the wave count right now. Being able to determine corrective pullbacks whilst within the channel lines is all that is really necessary. When the top TL gets broken, its time to stop shorting! I have no idea right now if the grey TL will provide support or if the 61.8% level (mentioned above will provide the bounce). This is why i wouldn't advocate just going long at an area that you perceive to be a target. Better to gather evidence first. A trade requires planning, so its either short the next pullback if corrective, or if not, the impulsive 5w advance should breach a prior 'reflex' point to confirm trend change...
Davai - 06 Jan 2013 12:49 - 184 of 423
Couple of updates;
The Euro went further in its channel to its 200% level of 'A' which co-incided with 13,000. Like i said earlier, stay short until it breaks out of the channel. We get a nice CCI trigger at the same time;

The Audi also bounced off of its 261.8% level for 'C' ending with a nice flag trade too;

Update;

Davai - 07 Jan 2013 10:25 - 185 of 423
Been looking at the best pair to get positioned long this morning. The picture does appear to be long almost everything, but of course that doesn't mean take any old position. Patience is still required so as to get a low risk entry. The EurJpy looked to be the pick of the bunch;

It appears to have the 5w up after breaking out of the corrective down channel last week, followed by a nice ABC back down overnight/this morning. The A&C waves respecting Fib levels along with the minor 5th of the 'C' hitting its 61.8% simultaneously. I missed going long right there, so waited for another minor 5w up, abc back and went long on a fresh high treating it as a 123 reversal. Stop is below the indicated point 'C' so quite low risk, but not as ideal as going long off of the Fib level itself with a typical 10 pip stop. Lets see what happens. I'm evidence gathering right now and only have an initial small position, i want to get heavily long if possible. A flag trade would be nice, failing that it looks like it will take out the prior 4th and then retrace yet again. If i can follow it on a small timescale and determine another abc, we should really be able to have confidence in this trade....

It appears to have the 5w up after breaking out of the corrective down channel last week, followed by a nice ABC back down overnight/this morning. The A&C waves respecting Fib levels along with the minor 5th of the 'C' hitting its 61.8% simultaneously. I missed going long right there, so waited for another minor 5w up, abc back and went long on a fresh high treating it as a 123 reversal. Stop is below the indicated point 'C' so quite low risk, but not as ideal as going long off of the Fib level itself with a typical 10 pip stop. Lets see what happens. I'm evidence gathering right now and only have an initial small position, i want to get heavily long if possible. A flag trade would be nice, failing that it looks like it will take out the prior 4th and then retrace yet again. If i can follow it on a small timescale and determine another abc, we should really be able to have confidence in this trade....
Davai - 07 Jan 2013 10:32 - 186 of 423
The point about EW is not that it is some miracle way of trading. Having only one count in mind is dangerous and will undoubtedly lead to failure. Its a case of adjusting to the PA as it unfolds. I am using this thread as a diary. My thoughts change consistently as various points get breached and its difficult to record every change in my thought process. Right now i am biased long on the Euro, the Yen pairs, the Audi, Kiwi, markets.... yep just about everything... that is a dangerous thought and i'm still mindful of deep corrective moves, so discipline remains key. Placing a trade and hoping is pointless as is not having confidence behind your trade. I am looking for a flag trade because i have a system which gives very very high probability if triggered correctly, its these trades that breed the confidence to stake heavily and make a real difference.... Right back to the screens...
Davai - 08 Jan 2013 12:16 - 187 of 423
Euro;

Breaking down the ABC;

If so, some very deep 4th waves. (subwave 'iv' & 4 itself) of 'C' retracing to the absolute max within the rules, ie, to within a pip of their respective wave 1's.
This is possibly only the abc of 'A' as its quite short, so 'B' & 'C' to follow, (of which 'B' might have completed.
We have a flag trade setting up above which should only trigger when the full ABC is complete, lets see...
Davai - 08 Jan 2013 16:11 - 188 of 423
EurUsd 'C' wave extending. EurJpy count has changed. This looks most likely;

Everything fits, so need the 4th wave (of 'C') at some stage. I've circled a bounce off of the 161.8% level, but it might just be a reaction. Lower to come as a 5w move, i think is for certain.

Everything fits, so need the 4th wave (of 'C') at some stage. I've circled a bounce off of the 161.8% level, but it might just be a reaction. Lower to come as a 5w move, i think is for certain.
Davai - 08 Jan 2013 16:31 - 189 of 423
Similar on the GbpJpy pair. No sign of a 4th yet, surely it means lower to come? Maybe a bounce now off of the 100% of 'A' level...


Davai - 09 Jan 2013 08:32 - 190 of 423
Lost a bit yesterday through my mistake. Really annoyed with myself, because i never liked the look of trying to label the full ABC in one single down channel in the first place. I think i was influenced by the EurUsd's action, which had already printed A&B. Reminder to oneself, never underestimate what separate pairs (but sharing one common currency) can do in regards to variation...
I was calling an end to the ABC whilst 'C' was still to come. The rather less obvious 'B' wave was the culprit here, ending with an expanding diagonal which didn't make a further high.
Post 188;
Anyway, my 4th&5th to come call was good and i clawed some back overnight. More satisfying perhaps is that i set my limit at the 38.2% of my 5th wave projection which coincided with a flag trade target. It hit with just a couple pips spare before reversing, whilst i was in the land of nod. That is EW at its very best;
Update;

Notice the reversal after the flag trade target was met. This is very common. Combined with a common Fib target, it can be deadly accurate.
No point updating the GbpJpy as it was a similar story, although it didn't extend. So wave 'C' was 100% of 'A'. With all this looking like it certainly was ABC corrective on both Yen pairs and the thinking is that they have both ended, we look for a way to get long. Plenty of time yet to get that low risk entry. They have both sprinted off the line overnight, but we need to get our wave 2 established next. Then together with some channel lines, we should be able to hit the longside heavily over the coming days...
Davai - 09 Jan 2013 16:16 - 191 of 423
Reckon we may have a bit of downside imminent on the Index's. Looks like an 'Irregular' B wave (poss a tad higher first) and corrective 'C' to follow. It could be shallow and i've circled a likely target area, but of course, occasionally we have a deadly 'C' wave, so a bigger sell off is certainly a possibility. The reason i say this is because i am mindful of the gap on the Dow chart that i mentioned in an earlier post which still needs filling. I think (from memory) it was around 13,140ish;


Davai - 09 Jan 2013 16:39 - 192 of 423
The above all depends on the ABC count being correct. It looks like the move up started with a 3w move (3-3-5) therefore merely the 'B' of a corrective move and as i've stated above, but i wouldn't stake my house on it. If it moves up sharply from here instead, we are in the 3rd wave and you don't want to be trying to short it. A minor 5w down and 3w back should give the evidence needed and hopefully a flag trade, (not that i trade index's, but i know most others here do). I will try to keep an eye on it to update if poss...
Davai - 10 Jan 2013 08:12 - 193 of 423
I don't generally read news articles, or listen to analysts etc. My trading is purely technical and i believe the market has its own agenda. There is scope within wave structure to extend or shorten, but how often do you see bad news and expect a market to react badly only to watch in bewilderment as it seemingly gets interpreted differently and it goes up instead. My case in point.
That said, i had an email this morning from something i must have registered with some time agonand decided to read an article. Some interesting reading and lots i could relate too.
http://www.dailyfx.com/forex/fundamental/article/special_report/2012/12/24/forex_education_top_mistakes_of_2012.html
The part about reducing your flexibility or thinking after you have publicly stated or printed a chart/analysis rings true for me. I try to use this as a diary and occasionally look back at charts from 3/6 months ago... its astonishing how many mistakes i can see that i used to do... surely that has to mean progress?!
I'm still making many mistakes on a regular basis, despite having a system that is successful probably 75% of the time! Why don't i just concentrate on that? Well, it takes massive discipline because whilst i'm waiting for a set-up, other stuff keeps happening that i think i recognise. Again, trying to get in before and thus predict a 3rd wave is costing me dearly and time i leave it alone to concentrate on my 4th/5th system me thinks... Patience and discipline Dav....
Davai - 10 Jan 2013 11:17 - 194 of 423
Right then, back on track, a small loss overnight on a UsdJpy short, trying to pick a wave 2 retrace again, has been replaced with a winning Euro long trade this morning. It turns out it should have been a far bigger winner, had i spent just a little more time researching, hey ho...

We have a 5w move short, followed by the ABC corrective move, at least that's how it looks. I actually merely noticed just the 3w 'A' followed by the similar 3w 'B', which started around 15:00GMT yesterday afternoon. Early this morning, we get a nice easy to read 1&2 waves, followed by a sharp rise.
I have ten charts open on 15min timescales on monitors in front of me. A quick scan every now and then is all it takes to recognise a 3rd wave in process. Once identified, i can open the chart on the main screen to do a little research behind the move. Its literally impossible to keep tabs on so many pairs and keep an opinion as to what phase they are likely in, so this is what works best for me. This is the key to the system. Ignore everything else, just look for a string of red or green candles together moving rapidly and its most likely to be a 3rd wave of some degree...
Run the fibs and channel lines, then hope it doesn't get too far extended. If it doesn't we can look for a likely 4th wave pullback. If it looks likely to retrace to either the 61.8% level (sorry that means if it retraces 38.2% of wave 3) or the 50% level and coincide with the support of the upper channel line drawn off of waves 1&2, you're good to go. Discipline is required to ensure it meets at least some of this criteria... the more the better. Go with original direction, stop is a couple of pips within wave 1 territory. Draw fibs for likely target for end of wave 5 and poss channel line confluence. Et voila. More detailed chart to follow...
Davai - 10 Jan 2013 11:42 - 195 of 423

Now firstly, i want to point out, the labeling looks to be incorrect now. I doubt it was an extended fifth, rather that the pullback earlier was a subwave 1&2 of the whole 3rd. I have left it as i saw it at the time and i was very lucky that, if it was indeed just a subwave, that it didn't go deeper and stop me out. If it wasn't the 4th it didn't have to obey the crossover rule, so could have easily cost me. There is little to do about this risk. The price corrected cleanly off of the 223.6% projection of wave 1, not one of my faves to be fair, but it was to the pip and led me to believe it was indeed starting the 4th.
I also bottled it a little early, keen to make up for my overnight loss and banked before my circled target of the 61.8% projection coupled with the upper blue channel line. Its a bad trait, but one i'm sure anyone reading this can sympathise with. I was glad to register another winner, but had i left it just three minutes longer, i would have seen the strength of the rise and possibly ran it a little longer. Hey ho, i do like to leave a little for the next man... but not that much!
It was only then that i realised the 5w count as highlighted in the previous post and saw that it needed to correct the whole of this move. I was watching elsewhere yesterday and had lost my foothold on the Euro somewhat.
Davai - 10 Jan 2013 11:49 - 196 of 423
You can perhaps also see why its easy to stray from the trading plan. If i'm so sure it is purely corrective, why don't i just go short the Euro now?!
Maybe with a bit more experience i will work out when it is right to do so, but the variations available to the market make it very difficult to be certain. Over-trading almost always creeps in.
As it is i want to concentrate on the 4th/5th trades and maybe limit trying a wave 1/2 trade to every now and then.
*Edit* somehow the apparent 3w move up was wrong... hindsight shows us it has to be impulsive and thus a 5w move. Utterly ridiculous, but again, that's probably why i should just stick to the system. It also means it wasn't a 5w move short and a larger ABC itself. Nobody said this was easy. Nice move this afternoon.
Davai - 10 Jan 2013 14:50 - 197 of 423
Right, lets keep in mind the bigger picture. Previously posted, i was expecting the ABC (as an 'X' wave), and then higher to come. The market successfully shook me out of being prepared for the move. Once again, it uses the boredom/stealth combo.
Malodyets mr.Market.
Post 181
smaller scale (showing X wave to be a WXY move) and subsequent breakout;
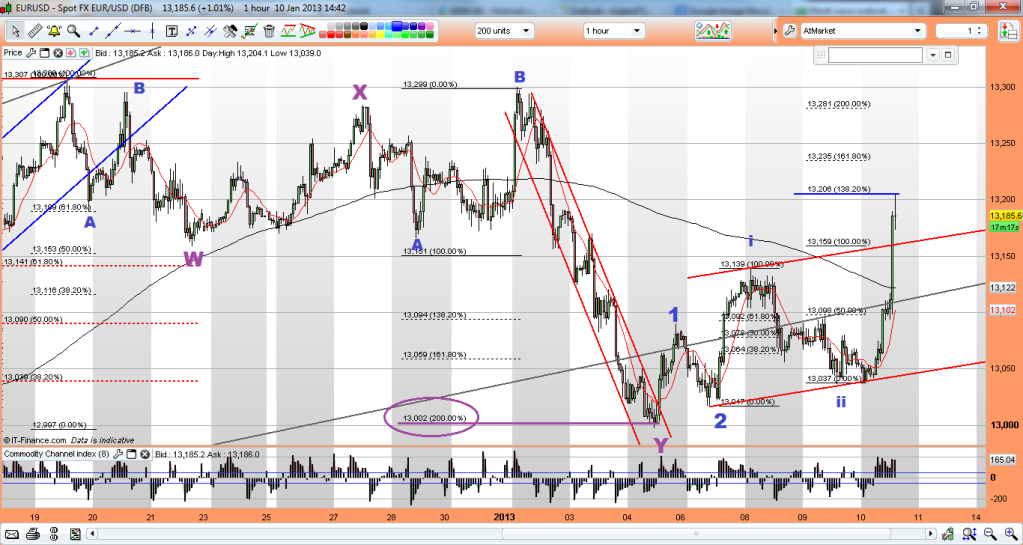
I've been saying for several days now, time to look long on the Euro pairs. Need to get the acceleration channel sorted, to be able to judge pullbacks...
Malodyets mr.Market.
Post 181
smaller scale (showing X wave to be a WXY move) and subsequent breakout;

I've been saying for several days now, time to look long on the Euro pairs. Need to get the acceleration channel sorted, to be able to judge pullbacks...
Davai - 10 Jan 2013 15:06 - 198 of 423
Hmmm post 183. The ABC ('X' wave) is broken down to the above WXY move;
Davai - 10 Jan 2013 16:05 - 199 of 423
Having missed todays fun, i find myself now with the puzzle of that 3 wave move up yesterday afternoon (15:00), it does point to this being corrective, within our recent downtrend. Could we be in a larger 'X' wave? I wont be joining in the fun just yet until i can work this out. To be fair, that is the safety of the system i described earlier. I simply don't think trying to hold for the bigger moves is for me. Most people concentrate on number of pips bagged. For me its all about percentages. You can make the same money (and have similar risk) with a target of 100 pips or just 10. I would rather miss a whole load of PA in order to be able to trade confidently in a direction for just a small distance. Anyway, this is whats worrying me... as i said... that 3w move makes me now think that this move this afternoon is corrective;

I will be the first to acknowledge that i have covered both directions and thus my point... Ok, i have missed this rise, but all i want is to recognise 3rd waves on much smaller scales!

I will be the first to acknowledge that i have covered both directions and thus my point... Ok, i have missed this rise, but all i want is to recognise 3rd waves on much smaller scales!
Davai - 10 Jan 2013 17:01 - 200 of 423
Possibility, but i think wave C was def in 5... so not so keen...


Davai - 10 Jan 2013 20:30 - 201 of 423
Ok, gonna put this out there and make it obvious that this view could change with further PA, however, Euro; here is why i think that's your lot (or thereabouts) for upside (for now) Earlier i expressed problem with the upswing starting with a 3w move, this move therefore is 'C' of a further X wave (imo). I also think that Cable has only completed one leg down so far and thus needs to do another set;

and the euro wont diverge massively in the opposite direction to Cable, so it backs up my X wave call. Maybe dollar strength will be back for a short blast? Little bout of risk off for a mo? Ok, well, bear in mind this is just an overall plan, so lets see if we can validate it.


and the euro wont diverge massively in the opposite direction to Cable, so it backs up my X wave call. Maybe dollar strength will be back for a short blast? Little bout of risk off for a mo? Ok, well, bear in mind this is just an overall plan, so lets see if we can validate it.

Davai - 10 Jan 2013 21:28 - 202 of 423
Above, does however conflict with the wedge on Cable daily. Catching these big moves is certainly tricky.

So the alternative bullish count for Euro is;
Tomorrows action will reveal enough i think, strange that it appears to have reacted exactly at the 161.8% level on prev chart though... Gonna stick with shorter term movements.

So the alternative bullish count for Euro is;
Tomorrows action will reveal enough i think, strange that it appears to have reacted exactly at the 161.8% level on prev chart though... Gonna stick with shorter term movements.
Davai - 11 Jan 2013 08:23 - 203 of 423
I won't update the FTSE any more. It simply hardly ever trends well with EW and hence i don't trade it. Any attempt to label it must be over confidence on my part! It may be worth keeping an eye open for a set of channels though. Could be some already;

Incredible how your thoughts chop and change along with PA. My outlook at the turn of the year was bullish everything (to get long on Yen pairs/Euro pairs) and bullish about the markets even if i don't trade them, (from post 186, 7th Jan; 'Right now i am biased long on the Euro, the Yen pairs, the Audi, Kiwi, markets.... yep just about everything...'
Somehow holding for anything longer than a few hours simply doesn't suit my style and so getting positioned for such moves as yesterday (Euro pairs) will require a change of tact. Fast moves come with little warning, usually after days of boring grind.
To be fair, this is a marathon, not a sprint and i know i need to concentrate on the system i highlighted yesterday. I've traded three set-ups so far this week and each one was a winner. I have also taken four other trades of various phases/styles and lost on each of those... the answer is right there staring at me!
One quick chart possibility for the Euro, but i think its time to tone it down with regards to predictions. As the analyst posted in that link i provided yesterday, sometimes by posting such analysis, you make a rod for your own back so to speak. Its time to find those 4th wave set-ups and ignore everything else. Becoming a successful trader requires much more than to know what you are doing! It means very little if your execution is poor, or discipline is lacking....

Good luck whatever your trading, but don't fight the trend!
Davai - 11 Jan 2013 08:38 - 204 of 423
One more;


Davai - 11 Jan 2013 09:16 - 205 of 423
Just a little extra work on above;


Davai - 11 Jan 2013 15:09 - 206 of 423
Awesome charts last couple of days, (i missed entry yet again!);


Davai - 11 Jan 2013 16:22 - 207 of 423
Valid trigger on a flag trade to end the week with, time for a beer;


Davai - 14 Jan 2013 11:13 - 208 of 423
The easiest wave to recognise is the 3rd. If it doesn't extend (not more than 161.8% of wave 1), look for a great low risk wave 4 trade. Use channel lines off of 0&2 replicated off of 1 to indicate likely support for 4. Then try to tie in the 38.2% retracement. Stop is a couple pips inside wave 1 territory (be mindful you're not in a 'C' wave in case of a diagonal cross over). With wave 5 to come we can also project likely targets. I also combine a flag trading system which if triggered adds to the picture to make it a very high probability trade. remember, its not about pips, its all about percentages. 3% each trade regardless if its 200 pip target or 20pips. Why wait for days for a set-up, they happen several times a day on small timescales...


Davai - 14 Jan 2013 12:14 - 209 of 423
Its possible to use channel lines for a further target, if you can follow the wave structure. Connect 2&4, then replicate parallel off of 1 for likely end of 5);

*Edit* Its a little later on and it kept dropping. It might still be an extended 5th, with a throwover (you can also replicate the lower TL off of the peak of wave 3), but looking far more likely to label it a WXY move. The point is that after the breach of the last HL (on prev chart) it confirms trend down. I missed entry to this trade on this occasion (whilst on me turbo trainer), so am cursing! Right then... look for next one.

*Edit* Its a little later on and it kept dropping. It might still be an extended 5th, with a throwover (you can also replicate the lower TL off of the peak of wave 3), but looking far more likely to label it a WXY move. The point is that after the breach of the last HL (on prev chart) it confirms trend down. I missed entry to this trade on this occasion (whilst on me turbo trainer), so am cursing! Right then... look for next one.
Davai - 14 Jan 2013 14:07 - 210 of 423
Euro is looking corrective. Couple of counts that look valid right now;

or poss;

Or, we could be in a further 'X' wave of a larger WXYXZ move, though i find those rare. I prefer the first chart. Look at how in the second set ('Y' wave) the 'B' subwave reacts to the fib levels.
I will wait for (hopefully) a valid flag trigger on the way up...

or poss;

Or, we could be in a further 'X' wave of a larger WXYXZ move, though i find those rare. I prefer the first chart. Look at how in the second set ('Y' wave) the 'B' subwave reacts to the fib levels.
I will wait for (hopefully) a valid flag trigger on the way up...
Davai - 14 Jan 2013 19:53 - 211 of 423
A possible monthly view for Cable;

and more, speculative, but recently a potential end of the wedge;


and more, speculative, but recently a potential end of the wedge;

Davai - 15 Jan 2013 14:50 - 212 of 423
Euro little bit of up first;

Followed by a lot of down;


Followed by a lot of down;


Shortie - 15 Jan 2013 15:31 - 213 of 423
Hi Davia, whats you take on the EUR/GBP pair? More strength or upper channel hit and should now weaken. I'm thinking now might make an entry point for a shot play..
Davai - 15 Jan 2013 15:40 - 214 of 423
Hi Shortie, i will get back to you on it later. You had to pick one i don't watch! I don't usually find it easy to interpret, but will run a ruler over it in a bit. Just waiting on a couple of other set ups for now...
Shortie - 15 Jan 2013 16:08 - 215 of 423
Thank you Davai, much appreciated...
Davai - 15 Jan 2013 16:36 - 216 of 423
Sorry Shortie, didn't realise the timing of that... i see its just sold of in the last 45 mins...
Not sure what i can tell you to be honest. Don't like to give an opinion unless it fits something i can use. It does look like higher to come with this being a 4th of some degree, so possibly limited downside for a mo, unless 8280 breaks.. there is both a Fib level and a reflex point there...
Not sure what i can tell you to be honest. Don't like to give an opinion unless it fits something i can use. It does look like higher to come with this being a 4th of some degree, so possibly limited downside for a mo, unless 8280 breaks.. there is both a Fib level and a reflex point there...
Davai - 15 Jan 2013 19:51 - 217 of 423
Ok earlier;
My view hasn't changed, but i really really want to see the last HL breached to give the green light for lower to come;

It will make an awesome H&S;

My view hasn't changed, but i really really want to see the last HL breached to give the green light for lower to come;

It will make an awesome H&S;

Davai - 15 Jan 2013 20:03 - 218 of 423
The concern about the bounce off of that fib level is that it was the target for the end of a 4th wave... I seriously can't count the A&B at the start of the move as a 1&2, but could it really be? If so, we have just finished the ABC 4th and are good to go higher for our 5th... hmmmm, this is why i need to see that last HL breached first (reflex point)... otherwise, trend is still up.


Davai - 15 Jan 2013 20:22 - 219 of 423
I must re-iterate... i cannot make that a wave 1, it simply has to be a 3-3-5 abc (A) as per other charts. That last HL must be breached.
Davai - 15 Jan 2013 20:55 - 220 of 423
Ok, little more work and this is a real possibility. A truncated 5th of the previous X wave.
Certainly would be foolish to rule out that we have just finished wave 4. I will be looking ofr a flagtrade long to trigger tomorrow if so...

Certainly would be foolish to rule out that we have just finished wave 4. I will be looking ofr a flagtrade long to trigger tomorrow if so...

Davai - 15 Jan 2013 20:57 - 221 of 423
If so, it will also mean possibly as much as 200 pips to come north on the Euro by middle of the day Thursday;


Davai - 16 Jan 2013 08:18 - 222 of 423
Still not particularly happy with the prev truncated 5th chart, so will be happy to be proved wrong. That means i expect the prior short scenario... anyway...
Trading complex corrections is certainly a difficult task. For me, the only cycle worth attempting is 'C' waves because we know they will be in 5. If something is unreadable, look for another.
Here is a possibility i have noticed this morning on the Kiwi. Fibs indicate we have just seen an A&B wave, so 5 down to come?

*Edit* looks like an irregular 'B' after the minor 5w to start.
Davai - 16 Jan 2013 08:42 - 223 of 423
A closer look at that irregular 'B' from above;

An irregular 'B' wave often leads to a following extended wave, so expect wave 3 to be longer than 161.8% of wave 1.

An irregular 'B' wave often leads to a following extended wave, so expect wave 3 to be longer than 161.8% of wave 1.
Davai - 17 Jan 2013 08:21 - 224 of 423
EurJpy to have a down day?
Possibility of a zigzag 4th (overall daily) with target of 11,230ish area;

and on hourly;

Not many fib levels lining up though, so word of caution. It could still morph into something else. (
Still i have flaglines on both this pair and the GbpJpy, so hopefully get confirmation this way...
In any case, anything corrective, the only wave to trade is a 'C'. There are simply far too many possibilities for an A&B, so wave structure is by far the most important feature to watch for.
Davai - 17 Jan 2013 09:16 - 225 of 423
Ok, so i better post the other scenario to cover my own ass!
Back to original thinking as a 3-3-5 ABC, of which we are in (minor 'c') of 'B';

Back to original thinking as a 3-3-5 ABC, of which we are in (minor 'c') of 'B';

Davai - 17 Jan 2013 10:38 - 226 of 423
Ok so after this mornings PA, we have confirmation it wasn't as i first stated (a 5w 'A' of a zigzag). A couple of possibilities;

Slim chance of it becoming an irregular with a fresh high, but unlikely looking at minor wave 'c's current action.
Also poss;


Slim chance of it becoming an irregular with a fresh high, but unlikely looking at minor wave 'c's current action.
Also poss;

Davai - 17 Jan 2013 11:02 - 227 of 423
Important to always be sceptical of labeling a 4th wave after it has travelled further than 38.2% of prior wave 3. Especially after 50%, it will usually become a 'B' or an 'X'.
Case in point this morning. No trade was placed, but now we have a little more clarity.
I am now looking for a low risk entry short on the EU and EJ. When i say 'low risk', i mean i won't freestyle short. We need a stop placement first, so we wait for a minor 5w down/3back (wave 1&2 of the following 'C'). Stop above the high.
Then i hope to get a flagline off of the point of 1 and minor 'b' of wave 2, once broken we can short with confidence. I will post a chart if it materialises.
Davai - 17 Jan 2013 11:12 - 228 of 423
Earlier;
Update;

Update;

Davai - 17 Jan 2013 12:14 - 229 of 423
Guess where the 200% projection of 'a' gets us? Double top anyone?


Davai - 17 Jan 2013 12:53 - 230 of 423

Davai - 17 Jan 2013 13:44 - 231 of 423
Ok, so wave 3 = 261.8% of wave 1, so more likely;


Davai - 17 Jan 2013 15:28 - 232 of 423
Really difficult to determine...
The choices;

where wave 'B' has finished. This has wave 3 reaching 200% of wave 1, but a tiny wave 4 which i don't like. Or;

This is preferred. We have just had a def 5w short move, but was it a fresh wave 1 (of the larger 'C')? or was it 'c' of the 4th?
The choices;

where wave 'B' has finished. This has wave 3 reaching 200% of wave 1, but a tiny wave 4 which i don't like. Or;

This is preferred. We have just had a def 5w short move, but was it a fresh wave 1 (of the larger 'C')? or was it 'c' of the 4th?
Davai - 17 Jan 2013 15:29 - 233 of 423
Looking at it on the 1min chart and it looked corrective, but a wave c doing 361.8% of wave a???! Hmmmm enough to scare me out of the trade. Oh the market is so sly;


Davai - 17 Jan 2013 16:25 - 234 of 423
So earlier, i had my fibs for pullback of subwave iii ('iv') and it reached the 70.7% level. Usually i enter a part position here, but today, i decided to have more discipline and wait for it to hit the 61.8% level. PA looked like a really fast abc which i reckoned would just be the A wave of the corrective wave. It wasn't, it went higher without me.
Later, i am waiting for what i consider is the wave 4 proper. I have my fib levels ready. Wave 3 was extended, so often we only reach the 76.4% level. Further (as above) we have a really shallow A&B wave, so naturally i think it wont drop far. I mistook a small 5w minor for the C, coinciding with the 76.4% level and open part position. It then tanked south as you can see in the chart, i opened another part position at the 70.7% and a final one at the 61.8% level. This time it went deeper. I started to doubt with the speed it was traveling and the possibility of the alternative count where we had possibly finished wave B, that i could be wrong. I close and recognise the loss. Now it heads off up without me.
Knowing what is likely to happen sometimes isn't enough. I have been waiting all afternoon for the wave 4, to get onboard long. When it happened, it was far far deeper than i imagined and a lot swifter. Once again the market uses speed as scare tactics... works a treat. I need to be more mechanical. To lose money going long on the Eu today is mental when you look at the rise. Poor trading and i'm disappointed with myself.
Davai - 18 Jan 2013 08:23 - 235 of 423
Ending diagonals, flavour of the day?
Yesterday;
Today;

Yesterday;
Today;

Davai - 18 Jan 2013 08:44 - 236 of 423
Or simpler;


Davai - 18 Jan 2013 11:13 - 237 of 423
Above but on the 5min;


Davai - 18 Jan 2013 11:15 - 238 of 423
and the possible bigger picture;

The reason being is that it looks certain it was a 3w move up, this should be corrected by a 3 wave back down possibly to make it either a flat or irregular. The 261.8% fib (of 'A') would be nice. Building the picture, but looks like we might have our wave 2 in progress. An X wave instead would change things substantially, so caution req'd as the drop might not be so large. Certainly will be looking to get short if i can determine the end of the 5min 'c' above.

The reason being is that it looks certain it was a 3w move up, this should be corrected by a 3 wave back down possibly to make it either a flat or irregular. The 261.8% fib (of 'A') would be nice. Building the picture, but looks like we might have our wave 2 in progress. An X wave instead would change things substantially, so caution req'd as the drop might not be so large. Certainly will be looking to get short if i can determine the end of the 5min 'c' above.
Davai - 18 Jan 2013 13:40 - 239 of 423
Post 237;
So the 'b'wave was deeper than i expected. Apologies, i will try to be more accurate in the future! )

So the 'b'wave was deeper than i expected. Apologies, i will try to be more accurate in the future! )

Davai - 18 Jan 2013 14:39 - 240 of 423
Little bit more thought gone into this and now i see this;


Davai - 18 Jan 2013 15:13 - 241 of 423
Remember this?
Update;

Update;

Davai - 18 Jan 2013 18:03 - 242 of 423
Earlier;
Think that's your lot for downside for a while;
5-3-5 ABC, with 'C' = 138.2% of 'A';

Think that's your lot for downside for a while;
5-3-5 ABC, with 'C' = 138.2% of 'A';

Davai - 18 Jan 2013 18:05 - 243 of 423
Also GbpJpy, looking like finishing its WXY corrective move. Incidentally it also came down to within a pip of breaking its prior reflex point;

Could be good for some upside, lets see... I'm long with stop pip below the low.

Could be good for some upside, lets see... I'm long with stop pip below the low.
Davai - 20 Jan 2013 13:47 - 244 of 423
Ok, gonna have to rely on small timescales, cos i'm now sure we need to correct downwards. The 4hr says to me that we have already had a 5-3-5 (W) move and then an 'X' wave to connect the next set (Y), of which the first move was clearly in 3, so should it not become a flat/irreg?, that would mean a bad week for the Euro ahead;


Davai - 22 Jan 2013 20:03 - 245 of 423
At last the FTSE throws up something recognisable )
I have a 4th wave abc retracing 38.2% of prior wave 3, so now in the 5th of this cycle. Fib extensions are drawn in. The 61.8% is the common target, but its not possible to predict that until the structure of this wave becomes clearer. It looks initially like a normal impulse move, but 5ths can morph into all sorts. I have also made the abc corrective a very simple zigzag, but of course it can be anything... flat/irreg/wedge etc... Lets see, but i have highlighted a target;

I have a 4th wave abc retracing 38.2% of prior wave 3, so now in the 5th of this cycle. Fib extensions are drawn in. The 61.8% is the common target, but its not possible to predict that until the structure of this wave becomes clearer. It looks initially like a normal impulse move, but 5ths can morph into all sorts. I have also made the abc corrective a very simple zigzag, but of course it can be anything... flat/irreg/wedge etc... Lets see, but i have highlighted a target;

Davai - 22 Jan 2013 20:09 - 246 of 423
Was stopped out of GbpJpy yesterday, trading complex correctives is actually not a sensible idea, the discipline req'd is substantial. Very poor results recently. Here was a slightly better one earlier;

Update;


Update;

Davai - 22 Jan 2013 20:18 - 247 of 423
FTSE;
We have just hit our head against both 6200 and the upper Elliott channel line. The wave structure doesn't look to me to be finished yet, so we might just correct back slightly first before giving it a better test tomorrow. As suggested 5th's can be difficult to determine because they can morph into ending diagonals and allow crossover between 'i' & 'iv'. Here's an example;

We have just hit our head against both 6200 and the upper Elliott channel line. The wave structure doesn't look to me to be finished yet, so we might just correct back slightly first before giving it a better test tomorrow. As suggested 5th's can be difficult to determine because they can morph into ending diagonals and allow crossover between 'i' & 'iv'. Here's an example;

Davai - 23 Jan 2013 07:47 - 248 of 423
Ok, well 61.8% ext target achieved, but not as i thought it would, (i did say that it's difficult to determine unless we can read the structure!). It's possible the 5th might be complete already, but i can't make a decent count for a 'iv', so it's more likely it has higher to come yet. Tough call tbh. The other possibility is to extend a further parallel line off of the top of the 3rd and i think this now looks likely. It also means the 5th might yet extend and reach 100% level, (or even further). Can't advise, but you have to agree that the way it reacted to the 61.8% level was canny )
Trying to predict structure at mo is impossible, but just for fun, i am showing another poss, where you can see that now the 5th of the 5th can also extend;

Trying to predict structure at mo is impossible, but just for fun, i am showing another poss, where you can see that now the 5th of the 5th can also extend;

skinny
- 23 Jan 2013 07:58
- 249 of 423
Thanks for the FTSE viewpoint.
Davai - 23 Jan 2013 08:26 - 250 of 423
You're welcome big bloke )
I am certain the 'iv' is correct, so wasn't difficult to predict the 61.8% as a min target. Fifth's can grind on up mercilessly and continue to have extended subwaves, so its difficult to call an absolute top for this cycle, but i would imagine if, it goes higher again now, it will bang its head on the upper trendline drawn off of the top of the 'iii' wave.
Ej reacting nicely to its fibs reproduced off of corrective wave A. Just bounced off of the 100% level, but i doubt it is finished yet. A few more common targets below;
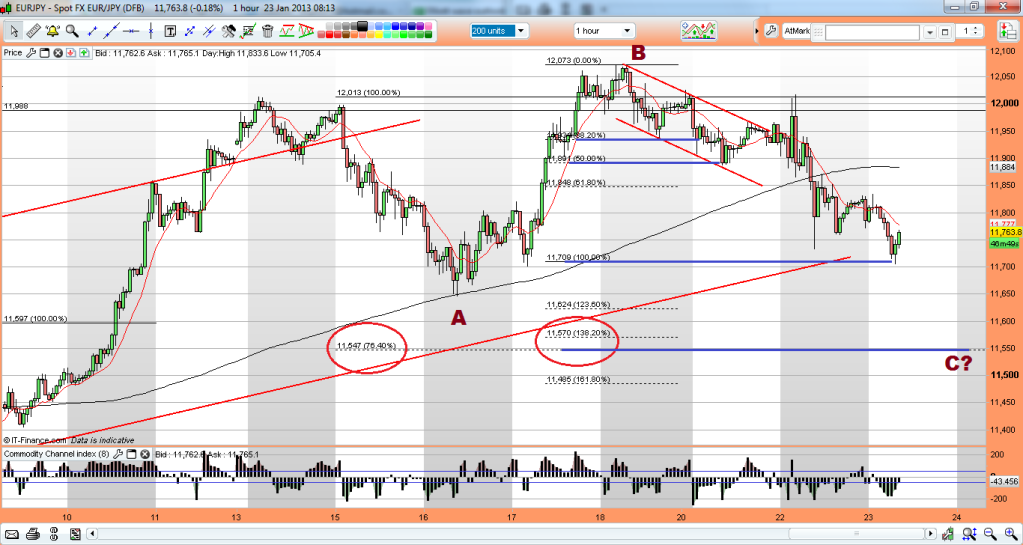

Davai - 23 Jan 2013 09:11 - 251 of 423
Remember this;
well, it seems, i was guilty of what i have been preaching elsewhere recently; the tendency to label everything impulsely. We are correcting and thus, it is a WXY move (2 sets of abc together with an 'X' wave in between). I believe we are within the 'C' of the second set now;
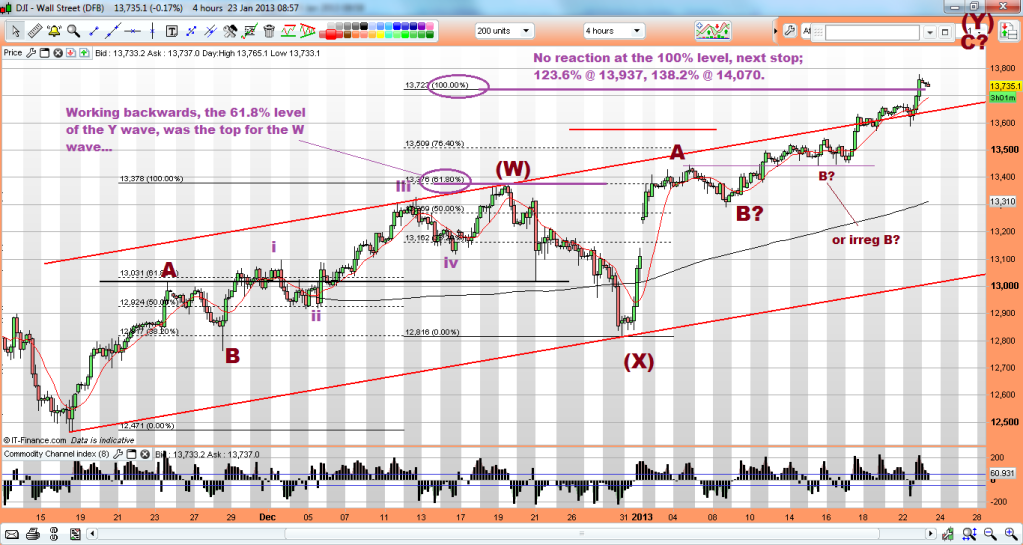
Fairly obviously, the converse to the 61.8% top mentioned in the chart is that we simply retraced 61.8% of the W wave for our X wave.
Davai - 23 Jan 2013 09:21 - 252 of 423
Without labeling every last detail, you can see A=5 waves, B corrects in 3 waves, C is always in 5 waves (labeled on chart 'i' to 'v'). I have reason to believe the second 'B' wave (of the Y wave) was irregular and have labeled it as such in this next chart. It looked too small in the above. Now apply fibs from wave 'A' (of Y) and project off of end of 'B' and hey presto, we get the 100% level coinciding with the 138.2% projection of entire set ('W') for end of 'Y'. Hmmmm certainly a possibility;
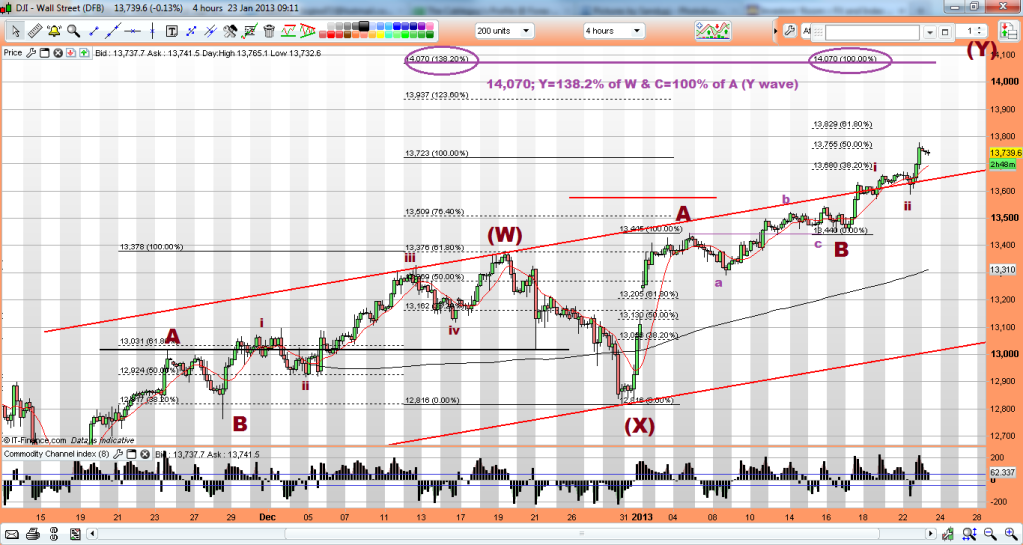

Davai - 23 Jan 2013 09:47 - 253 of 423
I have a little theory for cable. Its only an idea, but i can easily make a case for us not having completed the wedge yet. there is a tonne of bearish talk about the death of the £ for the foreseeable future, but i reckon we have room for one last high yet;


Davai - 23 Jan 2013 09:53 - 254 of 423
I love the way, it broke its lower parallel channel line for a bit, then waits til it coincides with 15,800 to obey it again, 100% level of W wave been providing support for last couple of days too;


Davai - 23 Jan 2013 10:02 - 255 of 423
Don't forget, i am only highlighting observations and sharing thoughts, mainly for myself to use as a diary. I can already look back to the start of the thread and laugh at how i used to label things. That was the whole purpose and the progress has been rapid thus far.
The market has so many phases and being able to adapt quickly to each one as it happens is key to success, as is, not being tied to one count or view.
Happy pips to all, but don't allow my views to alter your own. I have posted many many charts here that have been wrong! Good luck.
The market has so many phases and being able to adapt quickly to each one as it happens is key to success, as is, not being tied to one count or view.
Happy pips to all, but don't allow my views to alter your own. I have posted many many charts here that have been wrong! Good luck.
Davai - 23 Jan 2013 18:45 - 256 of 423
Would ideally like to see the Eu print 100% of wave W for wave Y. It would also mean a fresh low, but without breaching the last HL which is a reflex point;

It would actually predict a turn literally to the pip. We haven't bounced off of a fib level, so reckon its high poss.

It would actually predict a turn literally to the pip. We haven't bounced off of a fib level, so reckon its high poss.
Davai - 24 Jan 2013 10:55 - 257 of 423
Ok so, yesterday i posted a chart of the EJ, showing 'Y' = 100% of 'W' (i labeled it simply as an ABC), we have now just made a lovely 5w move off of that very line;

Also, the GJ has bounced cleanly off of its 70.7% level of the prior 3rd wave and made a similar perfect 5w advance;

The bigger picture;

I like this chart a lot. Now, is it the real deal, or has the market played a trick with an irregular 'B' wave beforehand? (thus this would be an ending 'C' wave ready to drop further...). It's difficult to imagine it to be fair and the more likely scenario would be to say that both Yen pairs have now ended their corrective moves...
I might cast my eye over the UJ...
Davai - 24 Jan 2013 11:17 - 258 of 423
It would be nice to see an extended 5th of current cycle on EJ reaching 12,024...
Davai - 24 Jan 2013 11:38 - 259 of 423
EJ bigger pic so far;


Davai - 24 Jan 2013 12:19 - 260 of 423
Can't believe it, but i may have to contradict myself again. Looking at the longer term EJ chart. I believe my 1&2 to be correct, as it leads to wave 3 = 200% of wave 1.
Now, wave 2 was long, simple and shallow, therefore by rule of alternation we should expect wave 4 to be fast, deep and complex;

That looks far more likely (imo)
Now, wave 2 was long, simple and shallow, therefore by rule of alternation we should expect wave 4 to be fast, deep and complex;

That looks far more likely (imo)
Davai - 24 Jan 2013 14:11 - 261 of 423
With so many conflicting thoughts on the overall direction right now, i need to remind myself of a good trade;

This is exactly what i'm looking for and want to make a note.
I think a lot of the best trades are towards the end of each cycle. I always said the easiest wave to recognise is the 3rd (and subsequently the 4th). That is obviously scaleable into each of the subwaves.
Once we have a set of Elliott lines, we can look for an abc counter-trend and whenever the likely end of a 'c' wave nears the lower channel trendline you can go long with stop some pips below the TL (or vica versa for short).
Here i get the added benefit of a valid trigger out of the flagline, this together with the break of the 38.2% Fib ext gives a virtually gauranteed target for the flagtrade generated target and next fib level... It may be just 30 pips, which to most doesn't seem like a big deal, but as i keep mentioning, its not pips, its percentages. That is as good a 1/2% risk:3/4% reward trade as you can find anywhere, with high probability outcome when executed properly.
Find net two wins like that a week and you are banking 5/6/7% a week or 20/25% gain a month... That's realistic too. I empthasise 'net' wins, 4 trades, 3 wins, 1 loss and a favourable R/R ratio to boot.
Add exponential growth to that and the figures start to multiply well. You don't need to look to catch huge moves, just to add several things together to find a high probability trade.
Been a tough couple of weeks. I really thought i was good enough to trade complex corrective moves, but i've been chewed up and spat out by the markets.
So to highlight the above makes me feel a little more relaxed again.
Davai - 24 Jan 2013 15:41 - 262 of 423
Post 250;
FTSE;
'Fifth's can grind on up mercilessly and continue to have extended subwaves, so its difficult to call an absolute top for this cycle, but i would imagine if, it goes higher again now, it will bang its head on the upper trendline drawn off of the top of the 'iii' wave.'
here's what i meant;

FTSE;
'Fifth's can grind on up mercilessly and continue to have extended subwaves, so its difficult to call an absolute top for this cycle, but i would imagine if, it goes higher again now, it will bang its head on the upper trendline drawn off of the top of the 'iii' wave.'
here's what i meant;

Davai - 24 Jan 2013 15:46 - 263 of 423
It doesn't mean its the top, but it was always going to be a target, once it broke the intermediate line on Tuesday. I went long yesterday @ 6184, but couldn't read what it was doing so closed for -2... i then missed the later test of the lower TL... sh*t happens!
Davai - 24 Jan 2013 16:00 - 264 of 423
Phenomenal performance by the EJ today. We have just reacted at the 76.4% level of 5th projection, but look where the 100% level would get us.... a fresh high!

It should be significant as to whether it reverses here or does indeed print a new high

It should be significant as to whether it reverses here or does indeed print a new high
Davai - 25 Jan 2013 07:50 - 265 of 423
Ok, so after getting back up off of the floor again this last couple of days, (put there once again courtesy of Mr.Market!). I have dusted myself off, given myself a good talking too and its onwards.
That Ej chart of yesterday is an awesome chart. The count was a little out, but it matters little. The levels work the same, but the channel was the entire acceleration channel of the 3rd wave and the prior count was merely for the subwaves of the 3rd.
I went long again (red circle) last night @ 12,010. It was a 38.2% retrace of prior wave (subwave 'iii') coinciding with the lower channel TL. Stop can be placed merely a few pips below the TL. I gave it 15 pips room to breath in case of a little spike down, but that was plenty, (further than that and something was wrong, indicating a trend change of some degree). Later i hit limit for plus 72. It should have been more but i had to leave charts for a couple hours... In any case, as per my previous post. that's a high probability trade with risk:reward of nearly 1:5. Perfect trade, well executed and i'm all smiles again.
Here's the chart update;

After studying and establishing the above this morning, i entered long again @ 12,099 with a valid flag trigger out of the 4th. Currently 48pips to the good with stop at BE. Risk was 36pips.
Davai - 25 Jan 2013 08:04 - 266 of 423
I spent a good chunk of the rise yesterday trying to determine if it could be labeled an abc and thus was still part of the corrective move. This is despite having already flagged that 'Y' = 'W'. The bounce off of the 100% level was perfect.
I basically made the mistake of thinking we were in the full 4th corrective wave and should, by usual rule of alternation from the 2nd wave, be heading sharply lower yet (hence this chart of yesterday);
What i failed to realise was that the prev abc was not the 4th of the 3rd, but merely another subwave 'iv'. This means we have just completed the 4th of the 3rd and thus stayed within the whole 3rd wave acceleration channel, indeed the channel line coincided with the 100% level (W=Y) and thus provided support and reason for the bounce too;

Now, this explains why, the 5w set starting yesterday, isn't a smaller subwave set (wave 1) of a much larger 5th, it will indeed be, the whole 5th of the 3rd taking us to the top channel line in one quick blast. If i had known this before, i could have cleaned up yesterday. I didn't but i learnt a little bit more again.
See the similarities between the 15min and daily charts?. The importance of establishing the acceleration channel for the 3rd wave is clear to see. Long off of fib retracements coinciding with a test of the lower line gives these high prob, favourable R:R trades...
Davai - 25 Jan 2013 08:19 - 267 of 423
FTSE to hit 6290/6300 later? Will do a chart if requested...
Davai - 25 Jan 2013 10:39 - 268 of 423
Just reacted at the 38.2% 5th projection, but i don't think that was the top...
Here we have the 61.8% level coinciding with the 5w set upper TL (red), the Daily upper TL (green) and 12,300 all together;

Here we have the 61.8% level coinciding with the 5w set upper TL (red), the Daily upper TL (green) and 12,300 all together;

Davai - 25 Jan 2013 20:12 - 269 of 423
Davai - 25 Jan 2013 08:19 - 267 of 268
FTSE to hit 6290/6300 later?
This is straight up, i nearly said to hit 6293 before close of play, here's why;

FTSE to hit 6290/6300 later?
This is straight up, i nearly said to hit 6293 before close of play, here's why;

Davai - 26 Jan 2013 07:26 - 270 of 423
Davai - 24 Jan 2013 15:46 - 263 of 269
It doesn't mean its the top, but it was always going to be a target, once it broke the intermediate line on Tuesday. I went long yesterday @ 6184, but couldn't read what it was doing so closed for -2... i then missed the later test of the lower TL... sh*t happens!
-----------------------------
How the hell can i preach, higher to come, go with trend etc, manage to get long at 6184, more importantly, with stop at 6179 and then stop myself out manually cos i then decide that i couldn't read the prior overnight action? It came within 0.5 pip of stop, but that was placed strategically according to my original thought. It would have stood, so 5 pip risk and now 100+ pips higher... sometimes i need shooting...
Davai - 26 Jan 2013 07:37 - 271 of 423
Ah, i remember now, it made a lovely looking 3w abc move down from a minor 5w up, after initially climbing from there, it spoilt it all by making a fresh low, this changed my initial view and i closed for -2. I think this may also indicate my underlying state of mind after the last two weeks trading.
Confidence breeds confidence, but the same is true in the opposite direction. Go on a losing run and it can easily multiply. A trade is a trade, simple, but as we all know, it takes more than that to be successful. There are so many aspects to trading and i think discipline is actually the hardest part to conquer. I know a good trade when i see it, no question. But through my desire to make more, a hunger for success, it breeds greed and its that greed that is ultimately the undoing.
Normally i can control it, but i've actually learnt so much in the last month or so, that i think i let it get away from me a bit. I became over-confident and that is when i must be most fearful. The 'i can trade complex moves... watch this...' attitude makes the market laugh at you and with one flex of its muscles, you're back on your arse!
Ok, well, its weekend. At least i recognise my mistakes, mistakes are good! The learning never stops, but lets get the discipline in order. Without it, you'll never make any headway...
Have a good weekend all... and keep smiling )
Davai - 28 Jan 2013 16:26 - 272 of 423
Waiting to see if cable has a reaction at the 15,665 area. Missed a rejection of an upper channel line on Friday amongst all else going on... In fact i've been far too slow here, with a lovely short entry last Wednesday at the upper trendline (blue circle) missed. My earlier thoughts about the wedge not being complete are looking unlikely now, if that was an irregular 'B' of wave 2, we can expect 3 to be extended, so plenty of downside to come. I still don't like the start of the 3rd though... really struggling to label it, so caution req'd in case this is complex, even so, shorting off of the line (particularly when combined with the 38.2% retrace) proved yet more low risk/high prob trading...
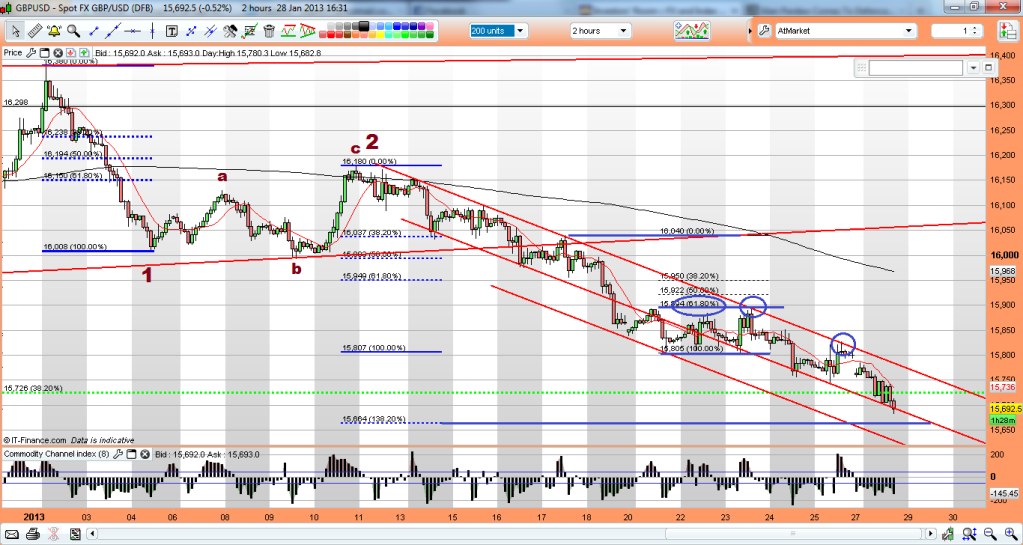

Davai - 28 Jan 2013 16:57 - 273 of 423
Hmmmmm that above chart and statement has got me in knots! 'C' waves aren't usually as steep as wave 3's, look at the channel compared to wave 1! Not as steep... its possible this is a complex correction, along with the start of the channel which clearly looks more a&b, so instead of 1&2, we have A&B, in which case look for perhaps more than just a reaction off of 15,865 area, (although C could go on to 161.8/200% etc), its too difficult to label in waves, so i'm not going to attempt it, another pointer to it still being corrective... lets see... the best shorts have undoubtedly been and gone in this channel set, (unless i can work this out for sure and get some kind of count).
Davai - 28 Jan 2013 18:54 - 274 of 423
Post 268;
Updated chart and likely fresh count;

Updated chart and likely fresh count;

Davai - 29 Jan 2013 13:28 - 275 of 423
Euro trade. First a clean bounce off of the 50% retrace of prior move (wave3);

Now drop down to the 10sec chart to follow for 5w/3w minor. Easy to follow wave structure. First 'A' retraces 38.2% of 5w advance, then we can get long at 100% of 'A' after following count merging together with channel line to the very pip;
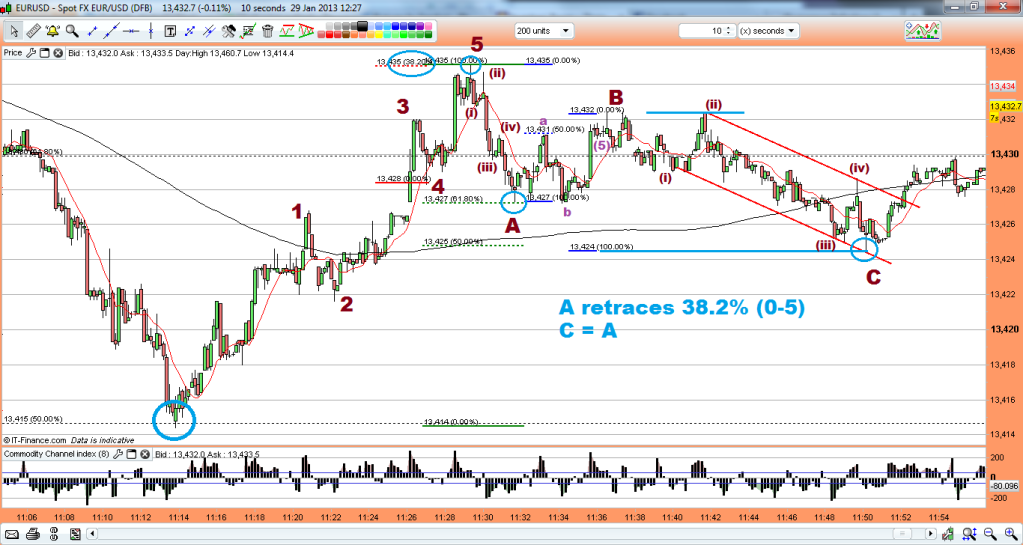

Now drop down to the 10sec chart to follow for 5w/3w minor. Easy to follow wave structure. First 'A' retraces 38.2% of 5w advance, then we can get long at 100% of 'A' after following count merging together with channel line to the very pip;

Davai - 29 Jan 2013 14:15 - 276 of 423
The further clue is that point 5 breaches the prior LH...
It doesn't matter what phase it is, whether it is the whole 5th to come etc, the minimum to expect after a 5/3 is another 5 regardless if impulse 3,'X', triangle etc... If you have it wrong and it was abc of larger 'A', we still have 3w 'B', so pips are safe!
When it as clear to follow as earlier, with the 100% level also meeting channel line, it is nailed on pips in the bank...

Davai - 30 Jan 2013 08:06 - 277 of 423
Can't help thinking we are a whisker away from a major top for the Euro, poss already hit a moment ago. Ok, so i'm not in the business of calling a top, the trend is up until confirmed different, but there is certainly a count which makes this the Y of the second set (Y of Y), i will run some fibs about in a bit, but in any case, here is the current 5w regardless of which cycle we are in;


Davai - 30 Jan 2013 09:04 - 278 of 423
Prediction at the turn of the year;
and so, perhaps Y will be a fib level of W, we are near to the 76.4% and coincides with above 61.8% projection;
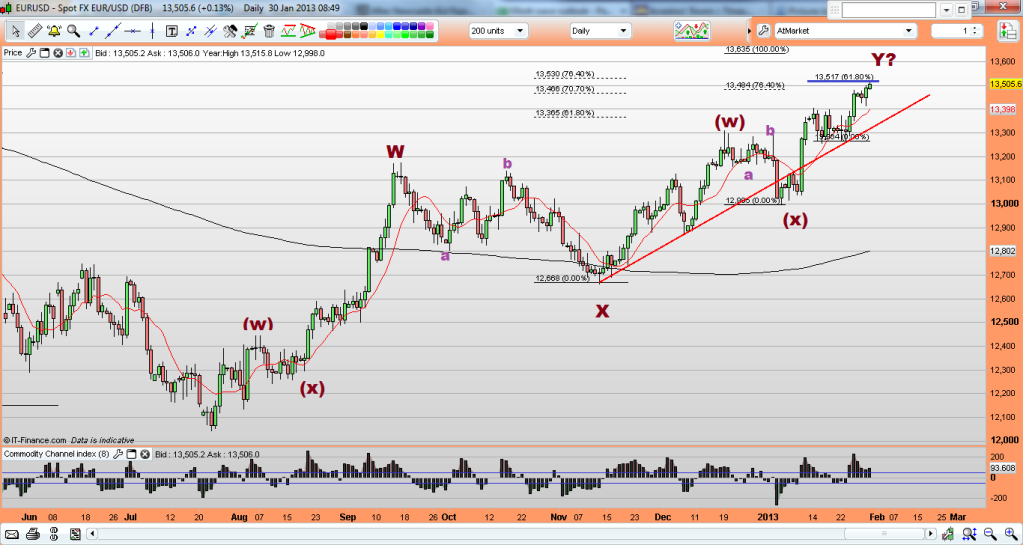
The problem being we might only have reached the first set, either way we should be set for some downside imminent as at least an X wave.
and so, perhaps Y will be a fib level of W, we are near to the 76.4% and coincides with above 61.8% projection;

The problem being we might only have reached the first set, either way we should be set for some downside imminent as at least an X wave.
Davai - 30 Jan 2013 18:30 - 279 of 423
Ok, lets see if this works, long on EJ for what i perceive as a 5th of this current cycle, tight stop and 12,440 target;


Davai - 31 Jan 2013 15:35 - 280 of 423
Wow, cable has been really bugging me for a couple of weeks now, but it's truly a case of 'seek and ye shall find'!
I was expecting what i considered was still the 3rd in the channel to hit a fib level of wave 1;
(yesterday);

It didn't manage that as i had it labeled, now however, i have a fresh count which indicates a full 5w move finished and we are not in a 4th right now, but actually an A (of abc) of which we will correct the full 5 waves. The fresh count hits all its fib levels to the pip, so very exact and why i believe it to be correct. Cable can be a cracker sometimes for this, despite the structure being a little difficult to determine;

Davai - 31 Jan 2013 15:51 - 281 of 423
This why i will only trade a 'C' wave unless i can get in right at the end of the 5th, a couple of possibilities;
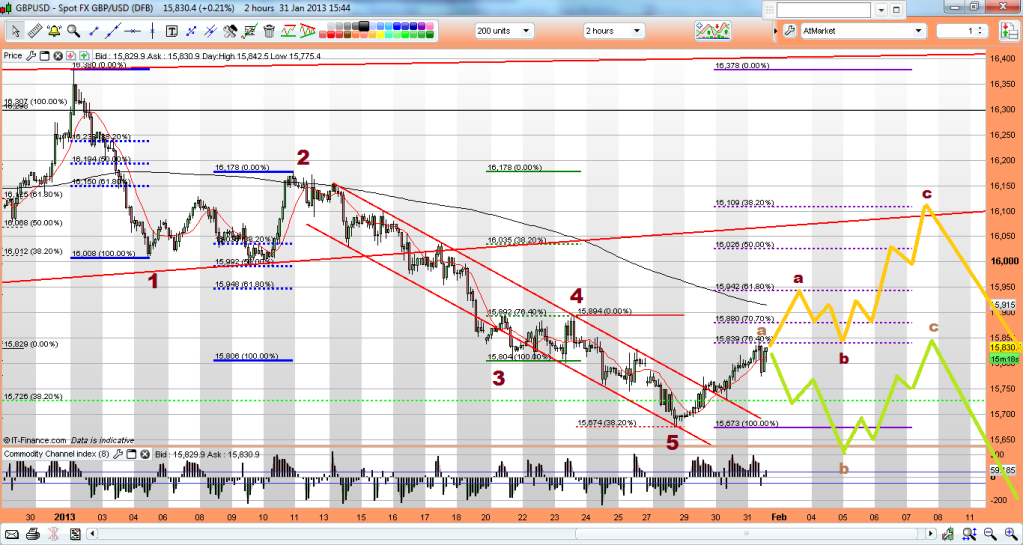
The higher count would tie up a retest of a former channel line, so quite poss...

The higher count would tie up a retest of a former channel line, so quite poss...
Davai - 31 Jan 2013 16:23 - 282 of 423
Possible end of 'A';
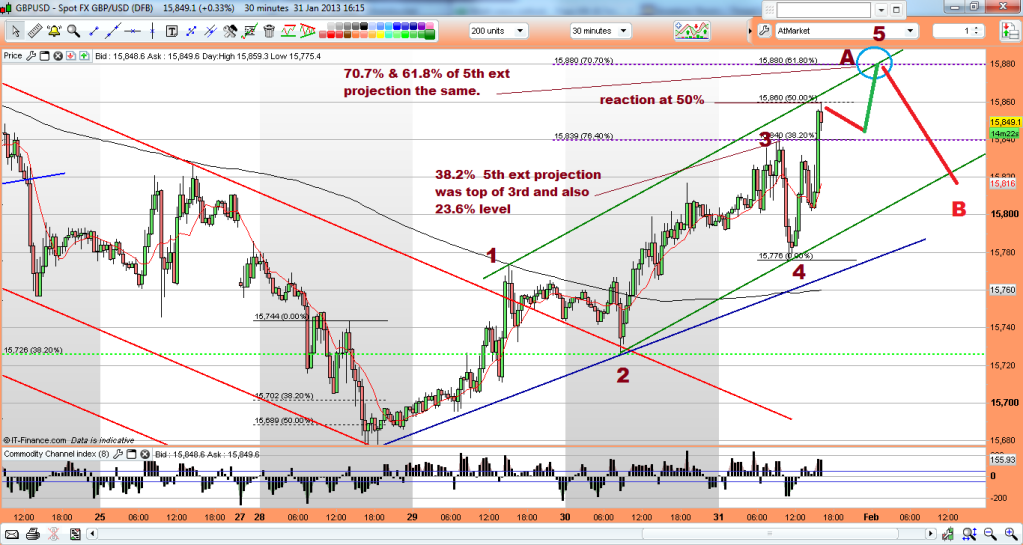

Davai - 31 Jan 2013 18:11 - 283 of 423
GJ, possible end of cycle;


Davai - 31 Jan 2013 18:42 - 284 of 423
Closer inspection makes this pullback a minor 4th, so higher to come later... 14,450/70 target area. Also have higher poss at around 12,465 for EJ too.
Davai - 01 Feb 2013 08:50 - 285 of 423
Have been run down with a cold lately, nothing major, but its surprising how tiredness affects you, feeling brighter this morning and a bit more on the ball.
I like this following chart a lot, it means higher to come yet for GJ before finishing the overall 3rd wave, (after a pullback minor 4th today and ignoring last nights chart!), this also coincides with my Cable call that we will print a B wave today (as of last nights chart, post 282).

I like this following chart a lot, it means higher to come yet for GJ before finishing the overall 3rd wave, (after a pullback minor 4th today and ignoring last nights chart!), this also coincides with my Cable call that we will print a B wave today (as of last nights chart, post 282).

Davai - 01 Feb 2013 10:09 - 286 of 423
Currently long EJ and trialling what i hope is a fantastic trading plan to be able to ride 3rd waves, small posi, but hoping this will prove itself... more about that later, but here's the chart to work to;

The reason i like it is because of the fib's. EW means little without them. The reaction at 300% of minor wave 'i' for top of 'iii' and then the minor 'v' hitting its 50% level as well as the top of the channel for end of wave 1 etc... lets see...

The reason i like it is because of the fib's. EW means little without them. The reaction at 300% of minor wave 'i' for top of 'iii' and then the minor 'v' hitting its 50% level as well as the top of the channel for end of wave 1 etc... lets see...
Davai - 01 Feb 2013 10:10 - 287 of 423
Post 282, Cable;
Update;
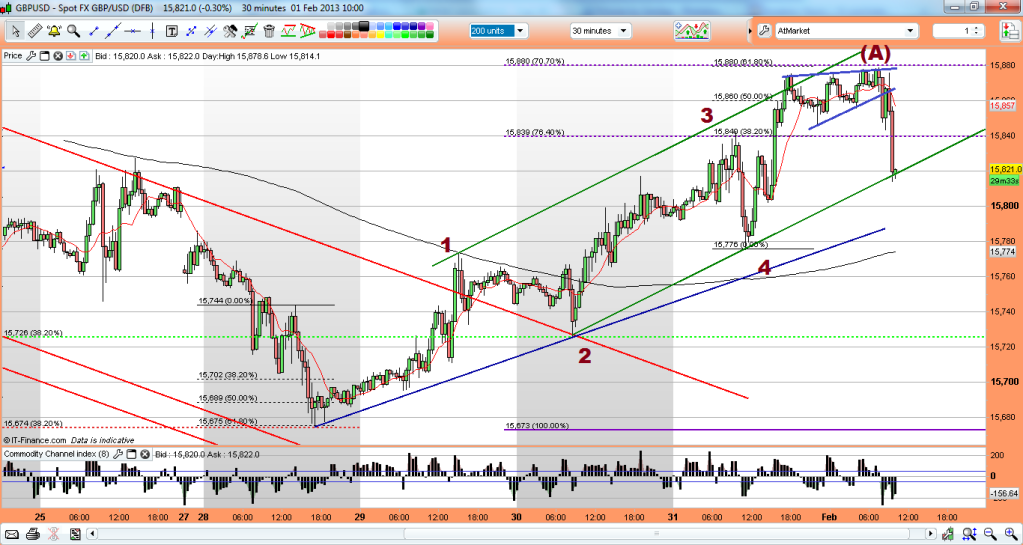
Update;

Davai - 01 Feb 2013 16:08 - 288 of 423
He he, what did i say earlier....? I'm not here to pick a top! I reckon we could possibly see a top very soon for Dow, wouldn't like to say how significant, just keeping an eye on some fibs converging at 14,070/80 as per previously posted...
That doesn't mean i'm recommending shorting it at that point, trend is up until proved otherwise...
That doesn't mean i'm recommending shorting it at that point, trend is up until proved otherwise...
Davai - 01 Feb 2013 16:19 - 289 of 423
Looking at a possible top of 3rd in the EJ possibly tonight (at the rate its going!);

Difficult one, cos you would expect a reaction at a round number anyway (12,800), but that fib confirms a 3rd and not an overall top...

Difficult one, cos you would expect a reaction at a round number anyway (12,800), but that fib confirms a 3rd and not an overall top...
Davai - 01 Feb 2013 16:28 - 290 of 423
Dow, if this is a top of a degree, there is lots of time to get short. Somehow can't see this rise ending in a fast turn around, there is too much momentum and printing going on, so i am now actually doubting it, (compared to when i posted up in Jan), but that's how it works, nobody thought we could get here so fast, remember, 'you don't want to be fighting the trend', there have been far too many bears around to keep feeding the flames.
Now we are here, everyone is bullish, perfect time for the rug to be pulled... Who know's? I posted 14,070 a few hundred points ago, now its close, maybe it will carry on. There are a plenty of other targets further up it can head too yet...
03 Jan, I have conflicting ideas for labeling;
and more recent, 23 Jan;
Going by the first count, we will certainly have further to go, 14,070 is 138.2% of wave 1 (if it can be labeled in 5), but it would be normal to expect 161.8%, so a few more hundred poss... Hmmmm, right now my head is scrambled from an arduous day and i'm about to have a nipple.... errrrrrr i mean tipple.
Like i said, don't fight the trend. none of the above really matters! Buy the pullbacks, until it breaks a prior reflex point and starts making LL's/LH's...
Davai - 01 Feb 2013 16:54 - 291 of 423
Thing is i need a 'C' wave back up for cable early next week, oh the possibilities are endless!
Post 281, i showed a zigzag correction and also an irregular, the other poss was a flat, which is what it currently looks like printing. If it has a couple of up day's early next week, i will keep a watch for a likely turning point. If it all works out, short the crap out of it cos its heading to 1.25...
Post 281, i showed a zigzag correction and also an irregular, the other poss was a flat, which is what it currently looks like printing. If it has a couple of up day's early next week, i will keep a watch for a likely turning point. If it all works out, short the crap out of it cos its heading to 1.25...
Davai - 01 Feb 2013 17:58 - 292 of 423
Likely bounce points for Cable, for further proof;
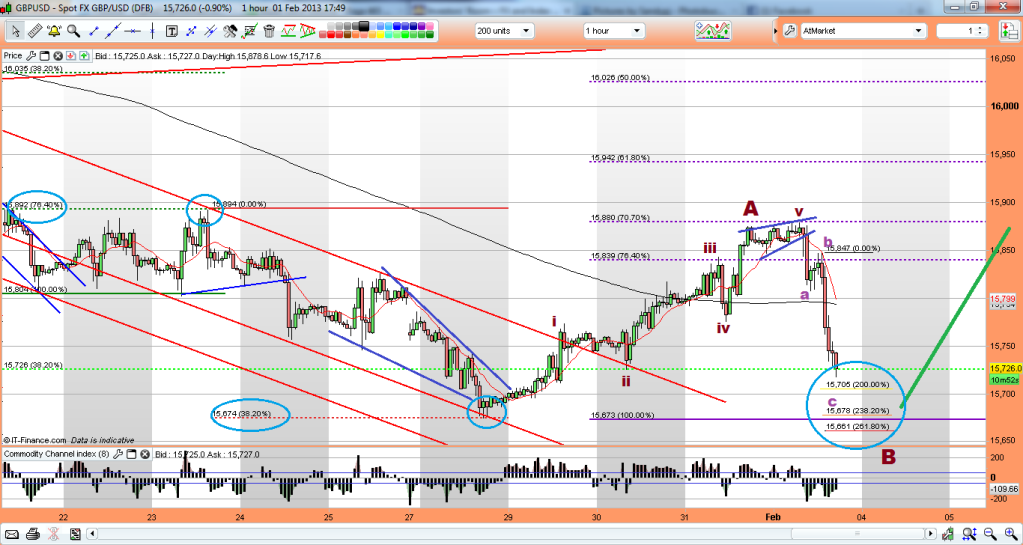
If a miscount, any upturn will only be in 3w, but a further retest of the previous top channel line would make sense.

If a miscount, any upturn will only be in 3w, but a further retest of the previous top channel line would make sense.
Davai - 03 Feb 2013 19:43 - 293 of 423
Like i said, i don't like to try to call a top, usually end up looking silly, but we are 70 pips away from my target suggested a couple weeks ago (14,070). Now look at this for the S&P. This is an awesome chart with fib relationships working perfectly everywhere. It doesn't however, give me more than the top trend line of the ending diagonal for a top, until i go down the timescales, i have a rough guesstimate at around 1525/30ish (50%fib at 1533), but with the strength around at the moment it would lead you to think it will be a rolling top as opposed to a spike, if we are indeed thereabouts. Who knows, maybe N.Korea will kick start proceedings and then debt will become the overall proverbial straw?!


Davai - 03 Feb 2013 20:12 - 294 of 423
Audi weekly;


Davai - 03 Feb 2013 20:43 - 295 of 423
Just in case, (for the not so familiar with counting and impulse/corrective etc); it means this is a large overall ABC 5-3-5 corrective move, of which we are very near the end of the 3w B, we have 5w short to come. This doesn't mean it has to be like the crash of 2008 and doesn't even have to drop so far. minimum would be 50% though. Being a C wave it could be an ending diagonal and last for years...

The caveat is as to whether the crash of 2008 was the 'C' wave and thus we are now in an impulse move. In which case, this simply wont stop climbing. I like the corrective count especially the way the fib ratios work, however, as i keep stressing, the trend is up (until it isn't!). I doubt anyone would want to work on a 1/2/5 year timescale and besides, if we do see a 'C' wave back down, which turns out to be an ending diagonal, it could take years and see many massive upswings along the way...
Its buy the ABC pullbacks until it doesn't work any longer and then we find a different sequence of impulse moves short (LL's/LH's).
Davai - 04 Feb 2013 10:11 - 296 of 423
Flagtrade saying GJ will reach at least 14,690 of this leg;


Davai - 04 Feb 2013 12:10 - 297 of 423
Time to short the Euro?
Ok, so need to be keeping a close eye on it now. Back at the turn of the year;
recent;
and a little closer shows possibility that of this 'Y' wave, 'C' reached exactly the 138.2% level of wave 'A';

Current action on other Euro crosses looks corrective, so am mindful that a wave 3 on the EU would also equal a fib level of wave 1 (instead of a&c).
Davai - 04 Feb 2013 12:25 - 298 of 423
Thoughts are EJ is in a 4th of its current degree, so higher yet, may coincide with the EU heading back up, (but with trend change and in a corrective wave 2 instead). Will try and confirm a count, but its not actually trending very nicely to read right now... £ needs to sort itself out too, if it is to become a 'C' wave, it looks far more like a 4th this morning of a larger 5w set short. Really want to get short on cable, but can't read current action, despite, so far doing what i printed last week.
Iain
- 04 Feb 2013 13:35
- 299 of 423
Yes......but!
Davai - 04 Feb 2013 13:47 - 300 of 423
but what Iain?
Iain
- 04 Feb 2013 13:53
- 301 of 423
I'm just trying to bring a little balance. A devil's advocate etc
Davai - 04 Feb 2013 14:02 - 302 of 423
Of course! Trend is still up on practically everything, i'm just highlighting events as they happen. If they happen some time after initially being flagged, its always good to question if you have a change of heart once they are met. Most of the targets i had in mind a month ago are being reached, but now we are here, i feel even more bullish! Does that mean it is a time to be cautious? Isn't that how it all works?!
For me it doesn't really matter as i work on smaller timescales and as i keep saying, trend is up, (until it really isn't anymore).
For me it doesn't really matter as i work on smaller timescales and as i keep saying, trend is up, (until it really isn't anymore).
Iain
- 04 Feb 2013 14:04
- 303 of 423
Im with you "Currently"
Davai - 04 Feb 2013 14:19 - 304 of 423
Do i detect an air of cynicism perhaps?!
Iain
- 04 Feb 2013 14:44
- 305 of 423
Not at all
Davai - 04 Feb 2013 15:14 - 306 of 423
Lots of my charts make it look complicated, but generally they are for practice purposes and purely for an overall plan.
Here is a very simple formula for making money. Identify a trend (HH's/HL's etc), wait for a pullback.
Let's assume trend is up. Go down the timescale to determine a,b&c, using EW & Fibs, you should be able to determine end of 'C'.
Now look for minor 5w up/3w back down.
Go long at end of this minor abc, it will often retest a TL. Stop is a pip (plus spread) below prior larger 'C'. Sounds complicated, so here's a chart.

Fibs and EW channels can be used to dictate likely targets, but this was a 10 pip risk and easy 30+ pip gain. That's 1:3 R:R. Its scaleable, but for anyone who says, 'big deal, its only 30 pips', is misunderstanding the idea. Pips are not important, percentages are. If i had a 200 pip target on an hourly set-up, my risk would still have been the same, therefore why wait for hourly/daily set-ups, when they happen all the time on the 5min? If traded as a 1% risk, you would have claimed 3% gain. A max 3% risk would have netted 9% etc...
That's without being greedy, but its also possible using this method to get onboard a longer trend and use the 10MA (+20pips) as a trailing support for your stop.
Davai - 04 Feb 2013 18:30 - 307 of 423
Here's another... Draw a flagline off of previous peak connecting top of the minor 5w peak (wave 1), entry after breakout bar coincides with CCI trigger. Target is equal to risk. Stop is pip below lowest point of pullback;


Davai - 04 Feb 2013 18:36 - 308 of 423
12,499 possible place for bounce on EJ. Eu is obeying 10ma on hourly, usually indicates impulsive move as opposed to corrective. Inconclusive right now, but is sat on 61.8% retrace level of previous wave right now.
EJ also reached exactly 100% level of previous wave, (identical to the earlier Eu chart which reached 138.2% in same move). Have it down as 4th right now.
*Edit 12,479 is fib level
EJ also reached exactly 100% level of previous wave, (identical to the earlier Eu chart which reached 138.2% in same move). Have it down as 4th right now.
*Edit 12,479 is fib level
Davai - 04 Feb 2013 18:50 - 309 of 423
Chart for above, but EU is now lower in last few minutes;


Davai - 04 Feb 2013 18:59 - 310 of 423
Ok, 12,450 is 61.8% ext for minor 5th, Eu is exactly at 13,500 for 50% minor 5th ext...
Davai - 04 Feb 2013 20:00 - 311 of 423
Previous 5w end for FTSE;

X wave next, surely not in a 3rd?


X wave next, surely not in a 3rd?

Davai - 05 Feb 2013 08:23 - 312 of 423
Post 309 EJ, where C=A or 3=1; the pullback in more detail;

So probable low already hit, or poss the lower blue circle yet, but then an up day, (provided no extensions), regardless of whether its 5 or B...
Watching for minor 5w/3w to confirm and looks like we already have the 5w...

So probable low already hit, or poss the lower blue circle yet, but then an up day, (provided no extensions), regardless of whether its 5 or B...
Watching for minor 5w/3w to confirm and looks like we already have the 5w...
Davai - 05 Feb 2013 09:08 - 313 of 423
This whole Euro advance starting from a HL is bothering me, without having put a load of thought into this, it would be sensible to at least consider that a HL could/should be followed by a HH, i think the break of 13,490 (last sig high in Mar last year) was possibly an important factor too, as to confirming the last low is definitely a substantial low;
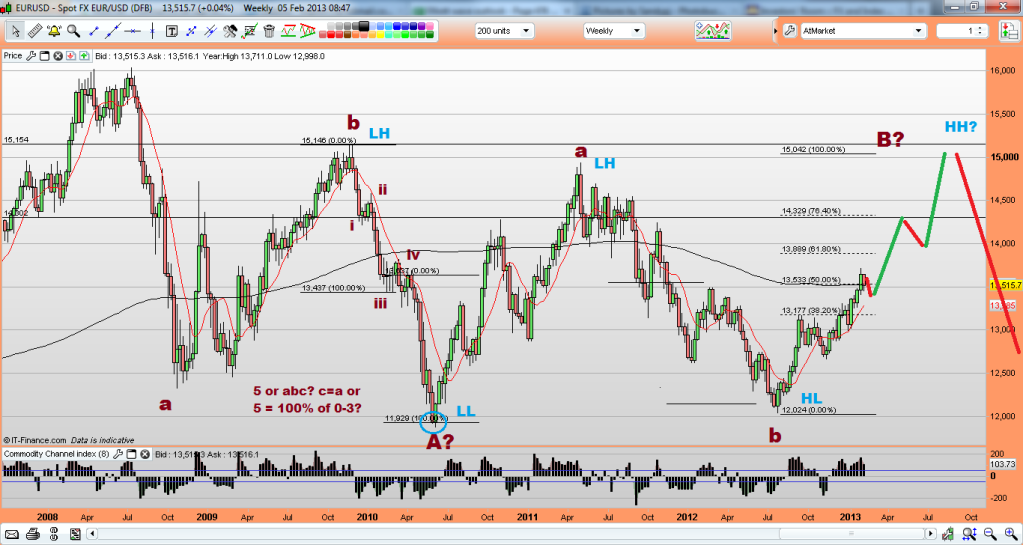

Davai - 05 Feb 2013 13:33 - 314 of 423
What the EU does in the next 10mins will (obviously) give further evidence, but if we are in an X wave, we have already completed wave A (yesterday) thus we can expect a 'B' to follow... 5-3-5 or 3-3-5, now this morning we have a 61.8% extension, after a pullback. I would normally think this to be a 5th (of the first 5w), but the pullback reached 38.2% of the whole move, so where is wave 1&2?! More likely to be two complete sets of a 5-3-5 (of an A wave) thus a 3w move and should be followed by a 3w B move, before a 5w C, follow?
Well, its speculative right now and more for a guesstimate than anything, but if we do now drop right back down, i will be looking to trade the ending of B for our C wave;

Well, its speculative right now and more for a guesstimate than anything, but if we do now drop right back down, i will be looking to trade the ending of B for our C wave;

Davai - 05 Feb 2013 16:32 - 315 of 423
15,595 for a bounce; Cable...? Is 138.2% ext of wave A if this is an irreg, its also bottom of weekly wedge. Even if lower and a miscount, we would be well into a 5th. Cable is certainly a short, but i would love to see a C wave first come back up a few hundred pips...
Davai - 06 Feb 2013 12:36 - 316 of 423
EU, not quite as deep as i was expecting, nonetheless;

How i perceive PA since;
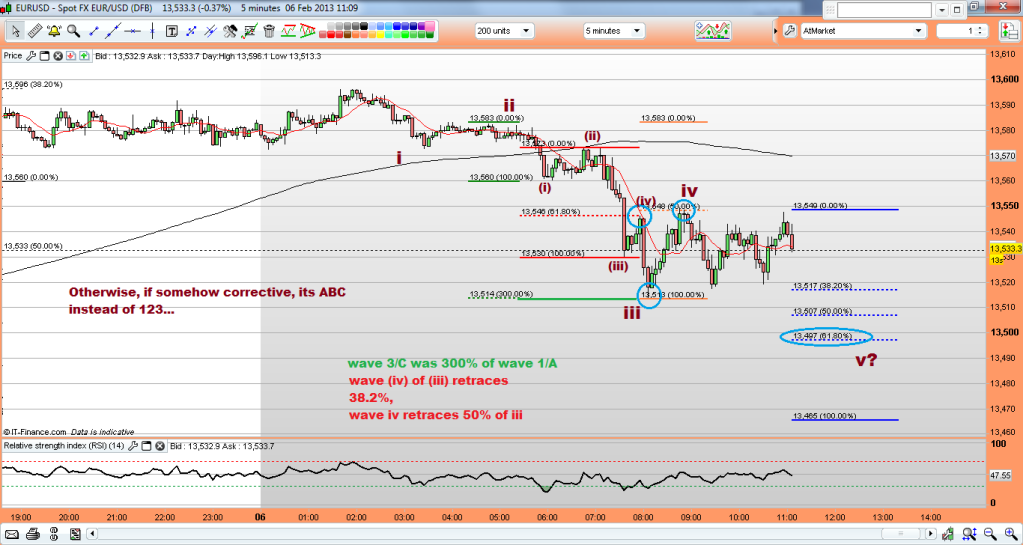
and what i'm basing it on currently (although PA this week has been very difficult to follow);

I have earmarked it as an X wave, but there is no difference if this turns into a 5w move of a fresh impulsive move short, just label ab&c as 12&3, with 4&5 to come, its thereafter it changes massively as trend is now down, so after a 3w move back up, its short it into the pavement... i'm sure i heard that phrase somewhere before! )
Davai - 06 Feb 2013 15:17 - 317 of 423
I see other analysts are calling Cables current move as an ending diagonal. It would certainly look nicer than my count, however, mine will be more likely to be correct in the absence of a further LL;
Previously;
Its the way the fibs work so well, that i can overlook the feeble looking 4th (although it has worried me ever since!),
With that i ran a couple of predictions for likely abc's;
and as of last night;

Now you can see why others are labeling that last corrective as a 4th and current as an ending diagonal 5th, but so far it is clearly in 3 waves and not 5. So, they will now be expecting a complete abc long, whereas i will be expecting simply a 'C'... (this as i say, will be negated with a fresh low, but i have just made a 5w count long for today, (minor wave 1 of C), thus it doesn't look corrective... lets see, nothing set in stone, but following previous charts thus far...
Davai - 06 Feb 2013 15:31 - 318 of 423
With ref to Cable (above), i must say, it really looks to be struggling and certainly is making a meal of grinding any higher... i will keep an open mind!
Davai - 06 Feb 2013 15:41 - 319 of 423
EU on track so far, but again, looks to be struggling, its as if everything is desperate to die, i haven't even looked at the index's today... next thing on the agenda.
earlier;
and target was hit, looks currently as if 'A' will be inthree, so expect a deep (poss even irreg) 'B', before 'C'. Can't help thinking this will actually be impulsive and the top is in already, but that should become obvious with the degree and speed of the coming drop...
anyway, for now;
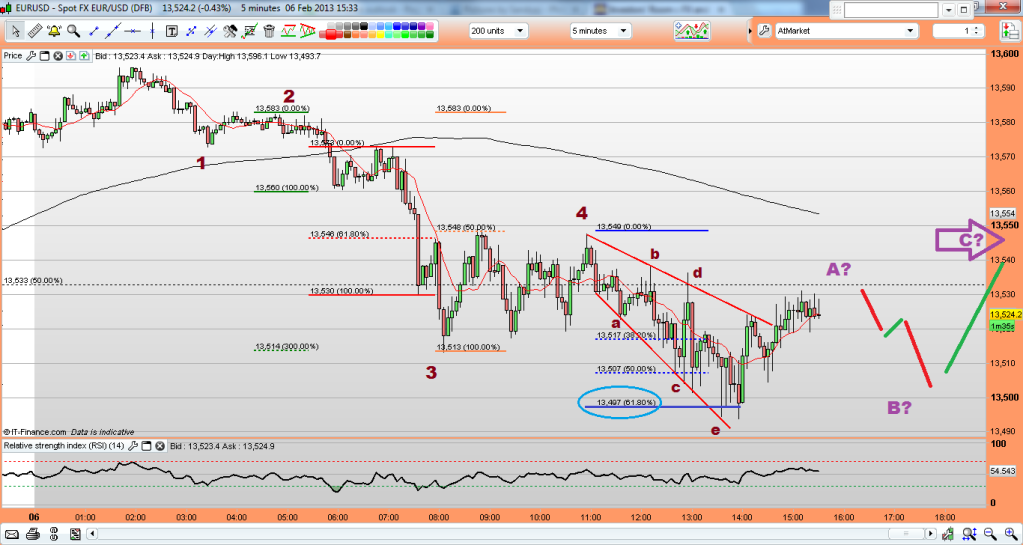
earlier;
and target was hit, looks currently as if 'A' will be inthree, so expect a deep (poss even irreg) 'B', before 'C'. Can't help thinking this will actually be impulsive and the top is in already, but that should become obvious with the degree and speed of the coming drop...
anyway, for now;

Davai - 06 Feb 2013 15:48 - 320 of 423
The minor 5w long i mentioned above for Cable, now really appears to be a 'C' wave, so lower we shall go and as i posted last night, the lower TL of our weekly wedge is at approx 15,600. I seriously can't see much strength happening, so a running/irregular corrective looks ominous, before the abyss below...
Davai - 06 Feb 2013 16:22 - 321 of 423
Cable;
Now i had it that the last move up hit its 61.8% retrace of the drop, ('B', which it does to the pip - blue circle), however, could the market be playing a trick, it is only a small handful of pips more than if it was the 61.8% of wave A (red circle); this would fit perfectly with my prev counts and also explain why Cable simply wont get any strength from here. So instead of an ending diagonal, (as others are calling it) with a corrective ABC move to come, we will actually be starting the 3rd of the 3rd? sounds like a plan?!

The small 4th is what would trick most, but it fits the fibs perfectly and recognising it hopefully is the difference here;
The current count as i see it;

Davai - 06 Feb 2013 19:30 - 322 of 423
If tomorrow is an up day, it will simply prolong the procedure in my eyes, The FTSE looks like its well through its abc corrective ready to drop as does the Euro and cable, however, they might drag it out to be bigger corrective moves such as this (Eu, the others similar);


Davai - 06 Feb 2013 20:12 - 323 of 423
Ref above, i think the earlier chart where we reached the 38.2% level of 5th ext first thing this morning is correct;
It means a slightly truncated top, but it fits. Hence the 5w short today would be wave 1;
followed by an abc wave 2;
If correct, tomorrow will be a down day on markets too, lets see...
It means a slightly truncated top, but it fits. Hence the 5w short today would be wave 1;
followed by an abc wave 2;
If correct, tomorrow will be a down day on markets too, lets see...
Davai - 07 Feb 2013 07:33 - 324 of 423
Wouldn't rule out some form of ending diagonal on the EJ yet;

Not put too much time into the Yen pairs lately. I couldn't make out a count for the last move up, but the above would possibly explain why... all will become clearer with a bit more PA.

Not put too much time into the Yen pairs lately. I couldn't make out a count for the last move up, but the above would possibly explain why... all will become clearer with a bit more PA.
Davai - 07 Feb 2013 08:05 - 325 of 423
EU,
Waiting for a low risk entry;

Ok, might look a bit confusing, but i will try to explain my point. At the moment we have completed a (small) 5w long on the EU, this was expected as per prev charts as a 'C' wave, however, it could still be, simply of a larger wave 1 and thus still 4 more waves to come (typically as in the top purple circle. With the thinking in mind that this will be corrective, we shouldn't break the high of Tuesday, therefore if a count takes us up there, we can enter short near this point, with our stop a pip (plus spread) above the high, (stop2).
In the lower purple circle option, it would mean the minor 5w was our C wave completed. It is roughly the 76.4% fib of A, but not conclusive (and not a favourite fib level for me), however, if we drop, we should wait for a decisive break of the red TL, as this would likely indicate AB&C were complete. Our stop goes a pip above the peak of 'C'(stop1). The middle ground is higher risk, both in pips and evidence...
If the trade is wrong, at least we have minimised risk and/or maximised evidence.
Davai - 07 Feb 2013 08:44 - 326 of 423
For me, looking at the current strength of the EU, it concerns me that it is a scenario playing out as in post 322, therefore the stop2 in last post will not be safe. Its too risky and i haven't seen a clear 4th wave yet, whereas Cable, is nearly good to go for the end of our C wave. It may extend into low 15,700's, but the 38.2% retrace of last drop is at 15,697...
*edit*, still printing 4th right now i think;

Will be trying to follow the 5th on small timescale to determine likely end. The speed of the rise is likely to deter, but must be respected, tight stops are order of the day, in case the count is wrong...
*edit*, still printing 4th right now i think;

Will be trying to follow the 5th on small timescale to determine likely end. The speed of the rise is likely to deter, but must be respected, tight stops are order of the day, in case the count is wrong...
Davai - 07 Feb 2013 08:55 - 327 of 423
Ok, now we have crossover with Cable, so perhaps something like this instead;


Davai - 07 Feb 2013 09:05 - 328 of 423
Each leg of the abcde is broken down again into 3w (abc), there will likely be a fib relationship between a&c of each, more difficult to spot in the smaller ones, but in the last, c was 138.2% of a, (had me thinking it was the wave 3 relating to wave 1), i will also be watching this if it does follow the chart for our wave e, for a clue hopefully indicating a common level ending at approx 15,700
Davai - 07 Feb 2013 13:37 - 329 of 423
Ah, always the same! Just as you think you've got a good trade! Well, that spike is still well within rights of a C wave, indeed, it looks like a further high to come later. However, whichever way you look at it, it is strength and must be respected as such. No trade until i can recognise something fresh...
If it takes three factors to line up for a good trade, then two factors doesn't cut it. discipline discipline dicsipline... speeling test
If it takes three factors to line up for a good trade, then two factors doesn't cut it. discipline discipline dicsipline... speeling test
Davai - 07 Feb 2013 14:29 - 330 of 423
So, not sure if anyone is following but the earlier advice was sound i believe! Cable may be joining in the fun now, but the euro is where the party is at;
Overall pic;
wait for low risk entry;
and a lovely flag trade too;
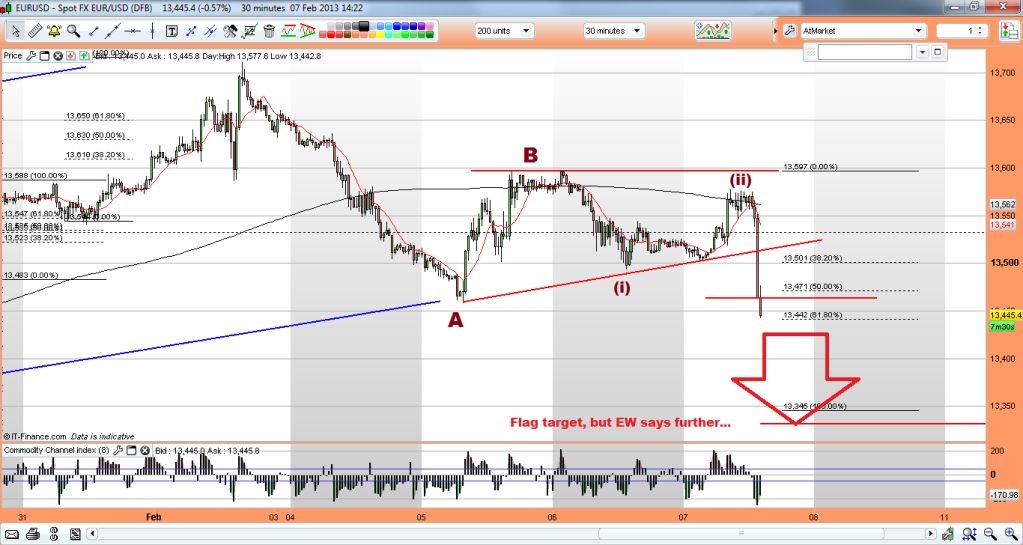
Overall pic;
wait for low risk entry;
and a lovely flag trade too;

Davai - 07 Feb 2013 14:59 - 331 of 423
FWIW, Cable, (for now at least), is certainly not doing what i expected and although it hasn't broken any particular rules to conform with my count, i am now expecting my prior count to be proved wrong. The EU does make up for it, so will have to make do!
Davai - 07 Feb 2013 16:49 - 332 of 423

Davai - 08 Feb 2013 08:46 - 333 of 423
Trend now well and truly down for the EJ. We are near, or possibly have just completed 5waves down from the top daily TL, where we finished our 5w cycle of the 5th. At this stage its inconclusive as to whether it was the overall 5th or the 5th of the overall 3rd.
The top Daily TL is drawn off what should be waves 2&4, therefore it suggests it was the overall top.
The action since then as of the 5th wave is now complete;
Wave 3 was 100% of wave 1
Wave 4 retraced 50% of wave 3
Wave 5 reached the top TL and approx 38.2% ext
We now have a nice 5w count short;
Wave 3 was 161.8% of wave 1
Wave 4 retraced 38.2% of wave 3
Wave 4 also retested the break of the Green TL overnight
Wave 5 has now reached its 61.8% ext
Caution as the 5th may extend yet.
Once complete, we will now correct back up in 3 wave abc, but the least we will have after this is another 5w short and poss, this is complete trend change for the foreseeable future. I will be looking to short this pair after each abc retrace.

Davai - 08 Feb 2013 09:17 - 334 of 423
In virtually the time it took to draw the chart, post it along with the above update, go and make a cup of tea, i see it has already bounced some 100 pips from the 61.8% level i have on the chart for its 5th wave target. Doesn't look like any extension! Wow, it loves to move, so i will be leaving wave A and B, but by then we will know if a zigzag,flat etc and can trade the C wave long with the benefit of our fibs from wave A... Capiche?
Davai - 08 Feb 2013 09:26 - 335 of 423
Anybody interested in my FTSE view?
Iain
- 08 Feb 2013 09:52
- 336 of 423
Go on then
My tea leaves say 5080
My tea leaves say 5080
Davai - 08 Feb 2013 10:15 - 337 of 423
Well, i don't want to try to predict too far in advance. The last chart showed a clear end of 5w;
and that of this daily cycle Y=W;
So the least we can expect is a decent correction in the form of an X wave;

I can only highlight what i see, so what you do with anything shown is up to you! But it looks very much like a complex correction so far. The fact that we appear to have had two lots of abc moves, with the 2nd ('b') reaching 123.6% of the first set ('a').
Next comes a 5w ('c') long. Its difficult to determine where this will end and i see we have already reacted off of the 61.8% fib level of 'a'. Seeing the 100% at 6299, i thought that would have been the obvious target, but if this count is correct we will go down (imo) in either a C wave or a wave 3...
*edit* (obviously i meant '3/C' in the chart!)
Davai - 08 Feb 2013 10:21 - 338 of 423
If it is a smaller count then its possible we are in some kind of ending diagonal right now with the above blue 'a' being red 'b' instead. Its the fact that we hit the 123.6% so precisely for 'b', that makes me think otherwise...
Davai - 08 Feb 2013 10:38 - 339 of 423
Isn't it strange how charting can coincide with fundamentals? I read this article earlier about Aso stating that the Yen had weakened more than they expected, which would back up the analysis that the Yen is to strengthen further;
http://www.reuters.com/article/2013/02/08/japan-economy-aso-idUSL4N0B84SR20130208
http://www.reuters.com/article/2013/02/08/japan-economy-aso-idUSL4N0B84SR20130208
Davai - 08 Feb 2013 13:15 - 340 of 423
Previous Cable count now back to plan A for now, as per lower prediction;
If it is indeed wave C right now, its being a b*st*rd and fairly unreadable. Fibs of 'A' in following chart, but its becoming vague. The 123.6% lines up with double top and 70.7% level of whole 5w move @ 15,880, 100% just above @ 15,833, but it can go way higher and still be valid if it so desires;
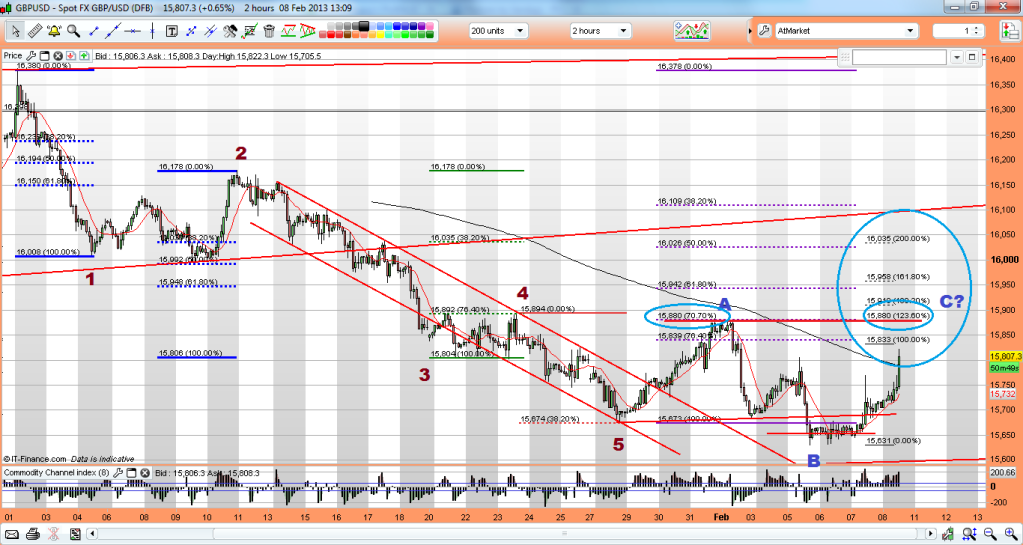
If it is indeed wave C right now, its being a b*st*rd and fairly unreadable. Fibs of 'A' in following chart, but its becoming vague. The 123.6% lines up with double top and 70.7% level of whole 5w move @ 15,880, 100% just above @ 15,833, but it can go way higher and still be valid if it so desires;

Davai - 08 Feb 2013 13:23 - 341 of 423
Cables inverse relationship to the FTSE at present also backs up more downside to come for the index...
Davai - 08 Feb 2013 16:04 - 342 of 423
I have the GJ as in a 5th of a 5th, an impulse wave and hence should head higher, whereas i'm expecting 5w short to come later on the EJ... surely short EurGbp would be a good choice, or poss even long Cable, even now after recent move...
Davai - 08 Feb 2013 16:22 - 343 of 423
Yep, i hadn't even looked. I would need to put a load of studying time into the EurGbp to work out where it is and i simply don't trade it. It's looks like its actually at (or very close to an end of its cycle), so will be long again... scrap the above...
What that means for the EJ while i'm thinking the GJ has further to go, i will have to look into a bit further.
What that means for the EJ while i'm thinking the GJ has further to go, i will have to look into a bit further.
Davai - 11 Feb 2013 09:36 - 344 of 423
Chart for above ('long again EurGbp');
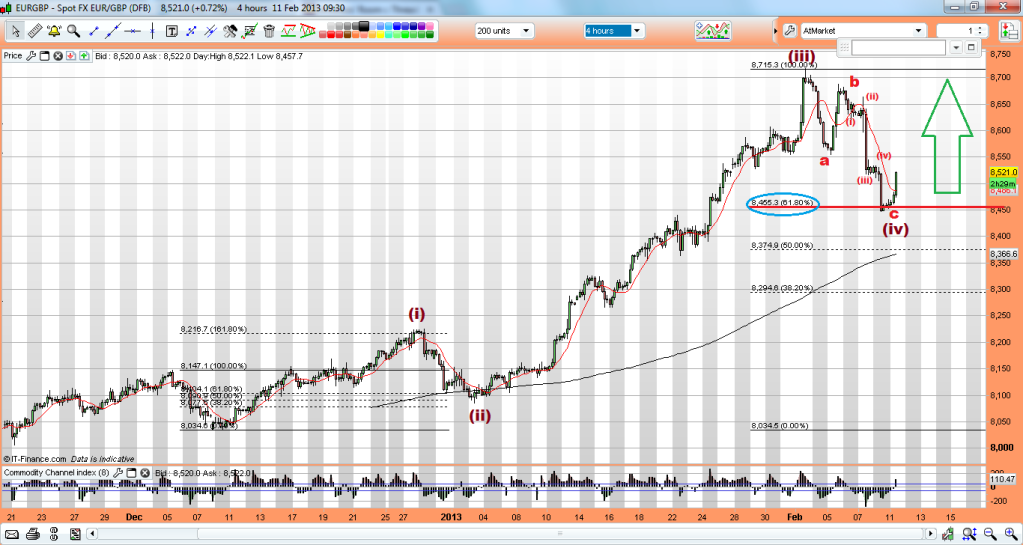

Davai - 11 Feb 2013 09:46 - 345 of 423
Something i mentioned last week with ref to the FTSE 'surely not' being in a 3rd wave. It does look a lot to me as if we are in an extending 5th wave, thus this pullback is indeed the 4th of the 3rd (of the 5th), so not only the 5th of the 3rd to come this year, but also the 4th&5th subwaves of the overall larger 5th too. Its not actually making the 5th easy to predict and i certainly don't like my ('i') placement, it doesn't look like a leading diagonal, so perhaps and irreg 'b' instead etc, still, if it ends up looking like this, we will see 7000+ before the turn...


Davai - 12 Feb 2013 10:48 - 346 of 423
Returning to Cable;
As stated before, the last count was slightly out, so we revert back to previous, lower green projection was the route (from 31st Jan);
Predicting end of 'C' was too tricky and i missed with my 123.6% prediction, (8th Feb);
It reacted off of the 100% level of A and the 23.6% retrace of entire 5w move.
Now we have our fresh wave 1 (of the 3rd i am expecting). There is zero strength about for it at the mo. We have punched through the weekly wedge (according to my charts at least) which has lasted 4 years or so.
The hourly shows a 5w count, with wave 3 reaching 261.8% of wave 1 and wave 5 hitting its channel line projection;
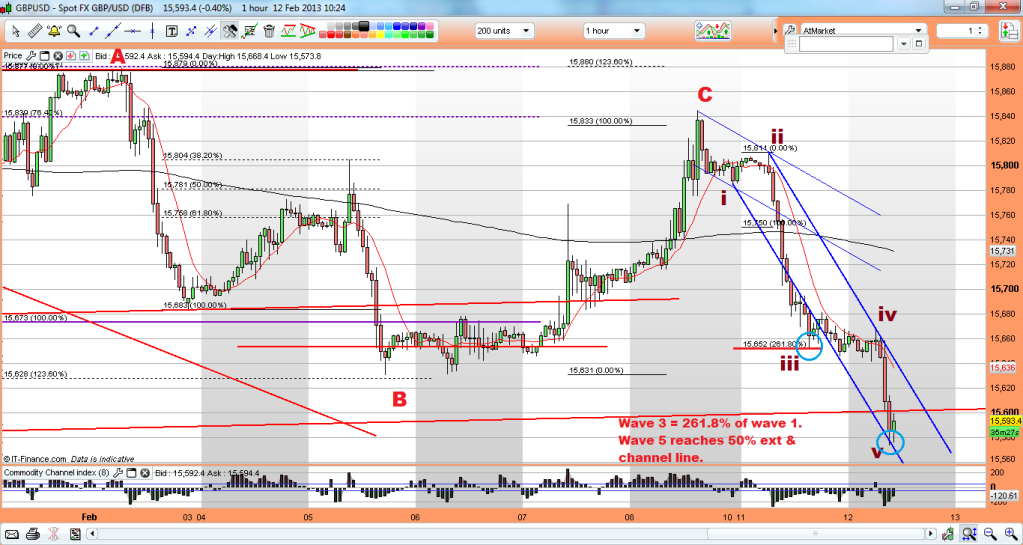
breaking down waves 4&5 on the 2min, i have the 5th reaching the 50% extension whilst simultaneously also reaching its own 61.8% minor 5th;

The immediate observation is though, that it isn't going back up!!!
Davai - 14 Feb 2013 11:44 - 347 of 423
Euro, been a bit tough to follow recently, i overlooked my earlier post. This was my old trading system, but requires too much discretion. In my quest to learn which phase the market is in and thus which flags work (and which do not), i moved onto EW!
Last week... break of flagline, risk = target;
A nasty pullback inbetween, but... et voila;
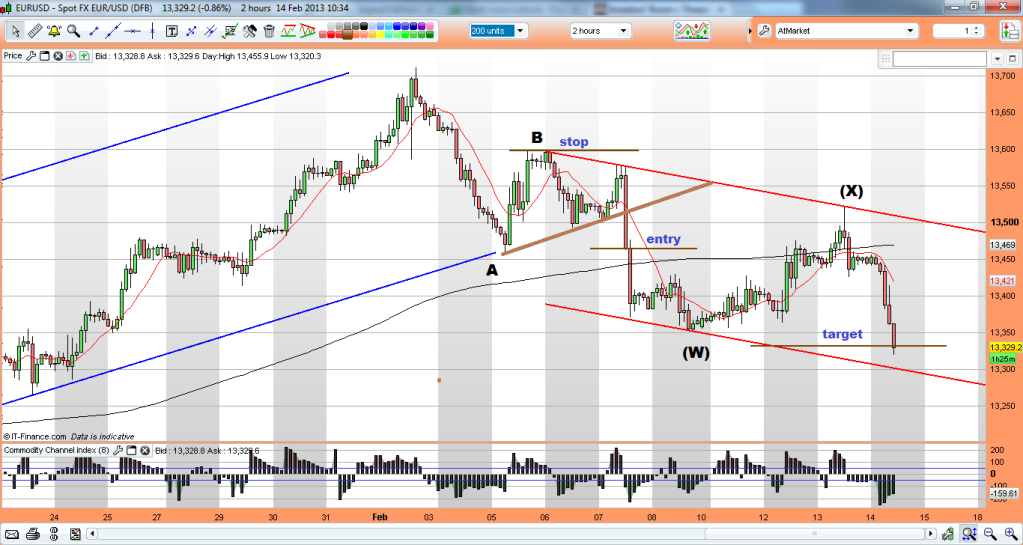
Last week... break of flagline, risk = target;
A nasty pullback inbetween, but... et voila;

Davai - 14 Feb 2013 11:45 - 348 of 423
EurGbp, completed 5w cycle and now a good way through its corrective move;
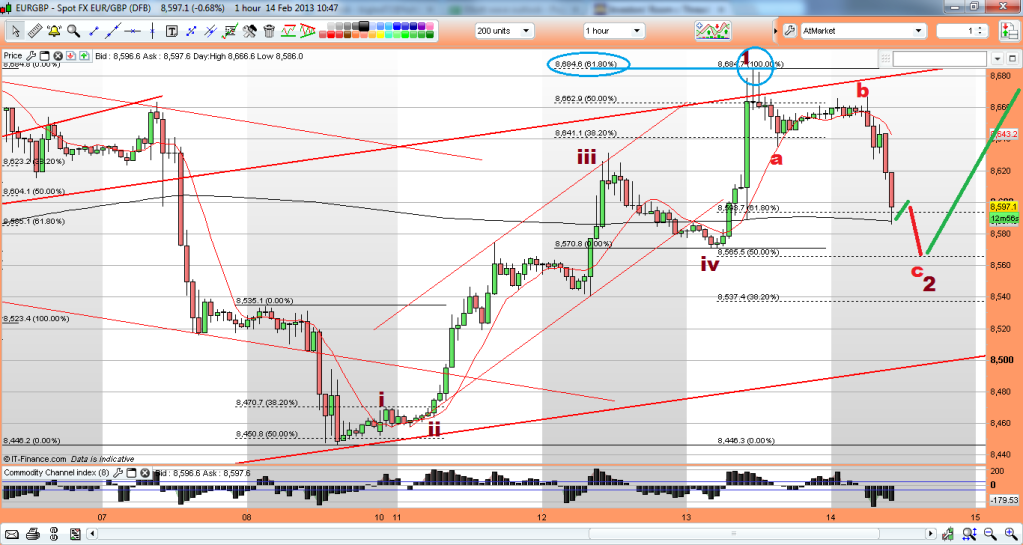

Davai - 15 Feb 2013 10:25 - 349 of 423
EurGbp, now looks to have become a larger ABC, so will be looking out for a poss diagonal as this is a 5th wave. 'A' breaks down into 5w;
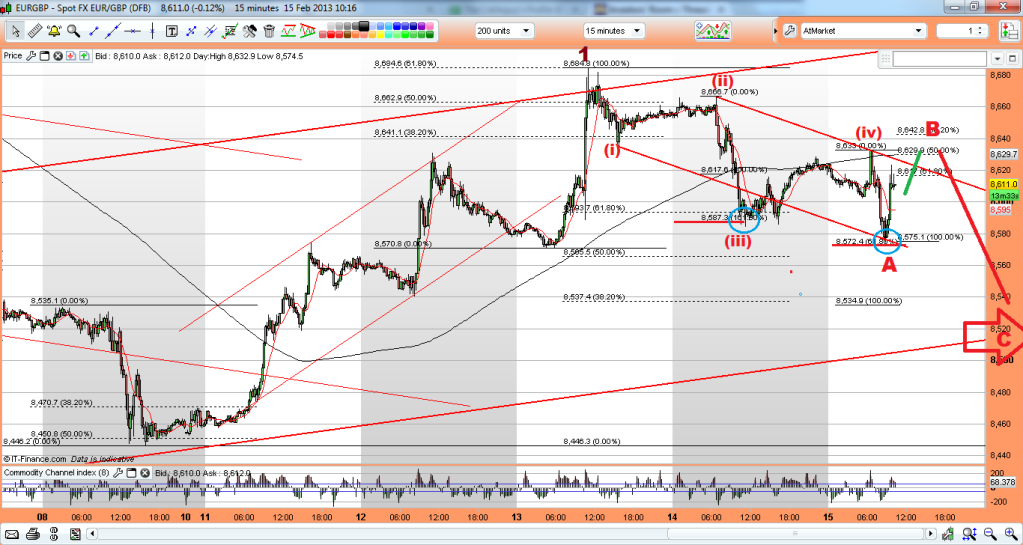

Davai - 15 Feb 2013 19:11 - 350 of 423
Couple other ideas saying weakness in Euro short term;
EJ poss;
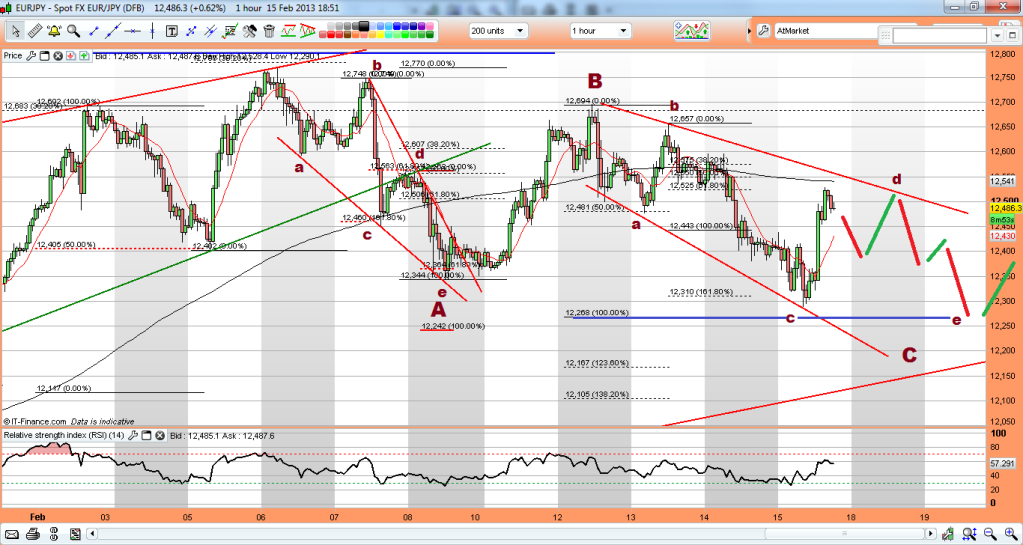
and i also have a slightly different view to the obvious as a label for the Euro (current cycle), i don't like the structure of this count, but i do very much like the way the fibs line up, so difficult to trade with confidence, but worth watching;
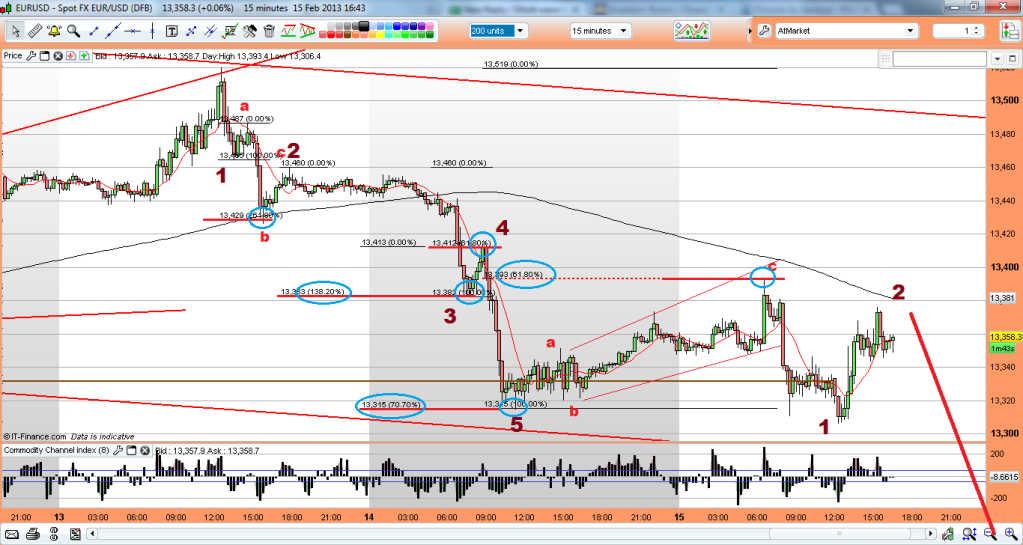
EJ poss;

and i also have a slightly different view to the obvious as a label for the Euro (current cycle), i don't like the structure of this count, but i do very much like the way the fibs line up, so difficult to trade with confidence, but worth watching;

Davai - 18 Feb 2013 08:44 - 351 of 423
Down day for the FTSE?

The safer bet is to wait for a break of point 'i', in case the entire 5w 'C' was a short leg and indeed as i have labelled 'i'.

The safer bet is to wait for a break of point 'i', in case the entire 5w 'C' was a short leg and indeed as i have labelled 'i'.
Davai - 19 Feb 2013 14:37 - 352 of 423
Right, lets try and right a few wrongs. Ref the above, at the time the small (apparent 5w) point 'i', didn't conform to fib of entire 'A', so i didn't consider it to be complete 'C', however, it now appears to have been wave 'a' of larger 'C' being a diagonal. It looks horrible, but the ending at exactly 61.8% of 'A' is too good to be coincidental and PA since makes a HH, so this looks to be the case. Correction over and a fresh impulse wave up? or just a larger A wave and now in B? or even.... a complex B which has just ended, with C to follow? Only a clear count down next will tell, if in 5w its start of C, if in 3 its corrective wave 2 and we have higher to come. Lets hope PA is kind to us...

Considering how easy to spot waves A&B were, it was only right that C was a cock.
Elsewhere, loads of complex moves are making it really slow going. Moving to a larger view, i'm still of the opinion that the Euro has 5w short to make yet (with room for a little more upside yet);
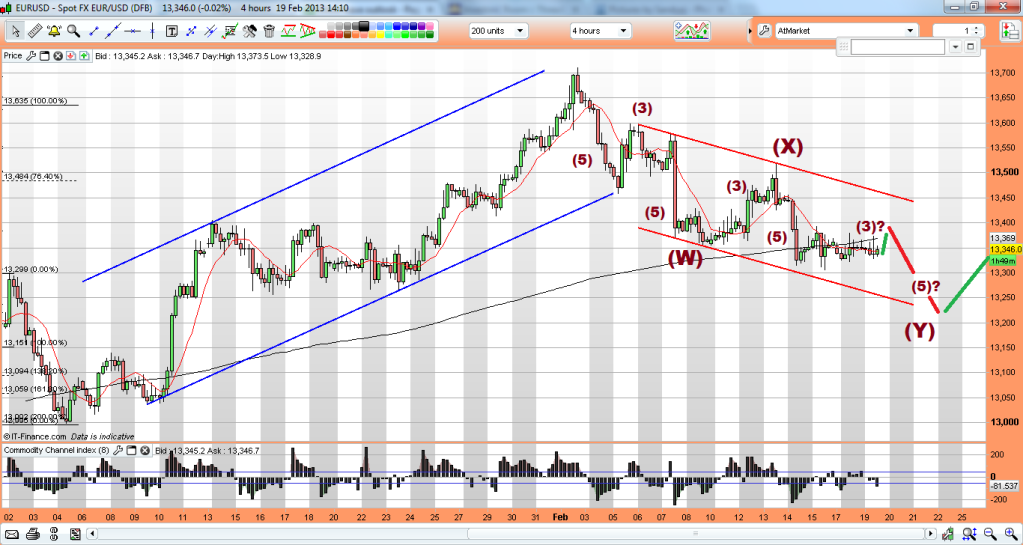

Considering how easy to spot waves A&B were, it was only right that C was a cock.
Elsewhere, loads of complex moves are making it really slow going. Moving to a larger view, i'm still of the opinion that the Euro has 5w short to make yet (with room for a little more upside yet);

Davai - 20 Feb 2013 09:33 - 353 of 423
Mistakes coming thick and fast lately, luckily they haven't cost me anything other than probable lost earnings.
The two enemies of Elliotticians are irregular B waves and short (truncated) waves, (C in particular). I have fallen foul of labeling the recent 5w short move on the EurGbp as wave A, when in fact, it was wave C following an irregular B;
The original count;
The mad thing was i ignored the obvious 4th wave of wave 1 and even had the 5th reaching its upper channel TL at around midday on the 12th.
The reason for doing so was that the following rise hit exactly 61.8% ext of prior move (indicating it likely a 5th wave). It fell inbetween the 161.8% & 200% ext levels of what now has to be wave A (and not 4).
Thus the new count;
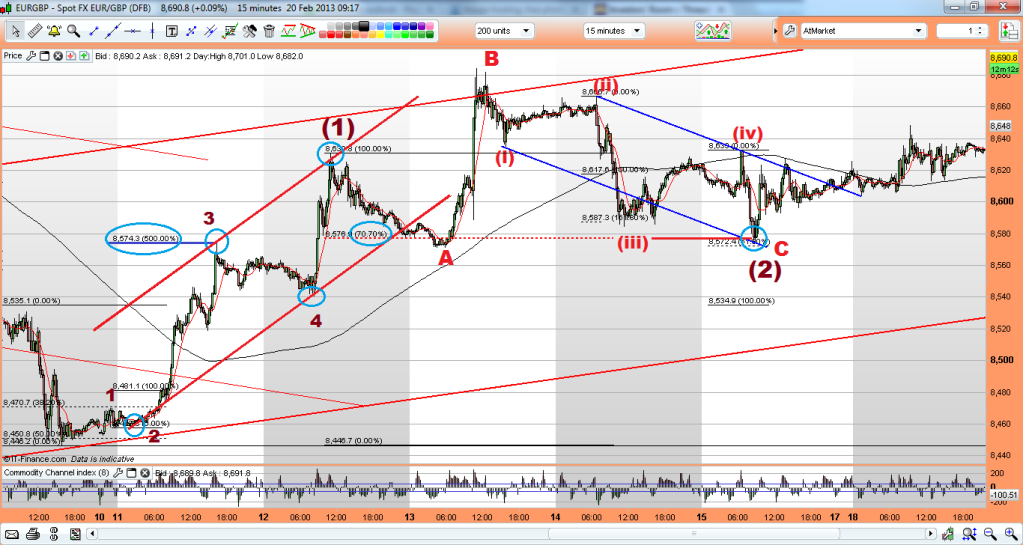
Unfortunately it is only subsequent PA that has confirmed it all, so once again, malodyets mr.Market, hats doffed. The only thing to gain from this is not to try counter-trend trades. At least if not catching the move, because of a mislabel, DO NOT lose money trying to trade against the trend...
Davai - 21 Feb 2013 08:27 - 354 of 423
I've talked about Euro weakness on the cards for the last few days, in particular in post 352 above;
'Moving to a larger view, i'm still of the opinion that the Euro has 5w short to make yet (with room for a little more upside yet)';
Yep, that little bit more upside than i drew, but result the same;

Now, i've labeled it WXY, but i'm looking to see if i can turn it impulsive. Remember the previous charts showing possible end of the larger Y wave and thus potential trend change back to short?
Things are getting interesting out there...
Davai - 21 Feb 2013 08:38 - 355 of 423
Bigger picture at the start of the year;
and end of the cycle, end Jan/beginning Feb;
Soon we should know if this is an X wave and that there is a further cycle to follow (Z wave), or whether it was indeed trend change. If so, we have a long way to go down. We already know Cable is doomed... What does this meean for the markets? Hmmmm FTSE could be an ending diagonal and as stated before i have targets for the Dow and the S&P, both look to be rolling over.
Nothing for sure yet, as they might be in consolidation channels with a break to the upside to come. I know that's like covering my ass, but it's obviously a tough call. I'm not here to make those. A couple of charts here have been embarrassingly wrong, but i do try to give a counter scenario if/as i see it...
Davai - 21 Feb 2013 08:53 - 356 of 423
In the updated chart post 354 above, there are two red trend lines. Here is the daily showing the significance of them. We are dangerously close to breaking the lower one right now bang on 13,200. Its difficult to tell if the current move is likely ending here;
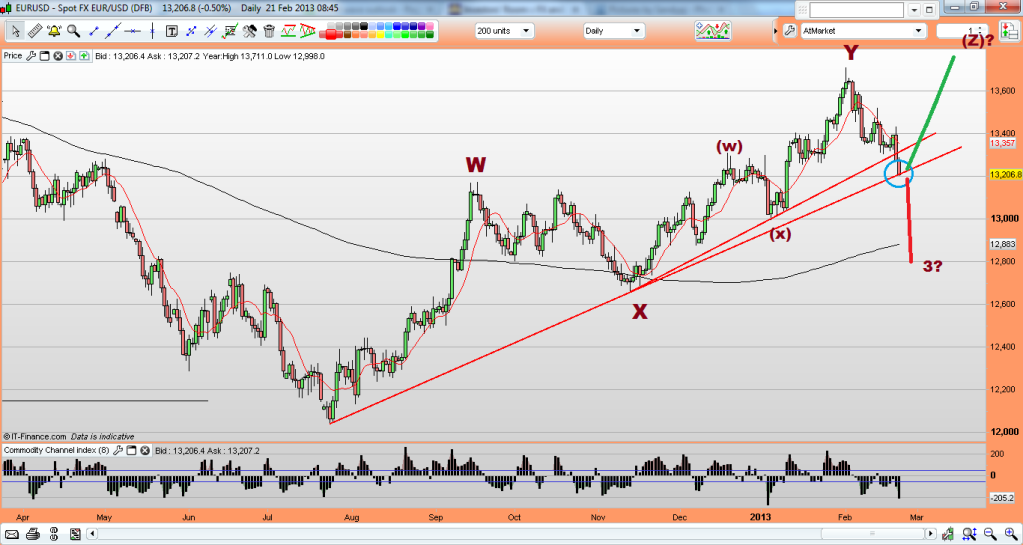
That's not to say, if we bounce from here, we will def be in a fresh long cycle. We really ought to be reacting to this line and level combined, however, if we are in a 3rd wave short, any bounce wont last for long.

That's not to say, if we bounce from here, we will def be in a fresh long cycle. We really ought to be reacting to this line and level combined, however, if we are in a 3rd wave short, any bounce wont last for long.
Davai - 21 Feb 2013 10:39 - 357 of 423
This is still a real possibility. Loads of bears about for the Euro right now... contrarian indicator?
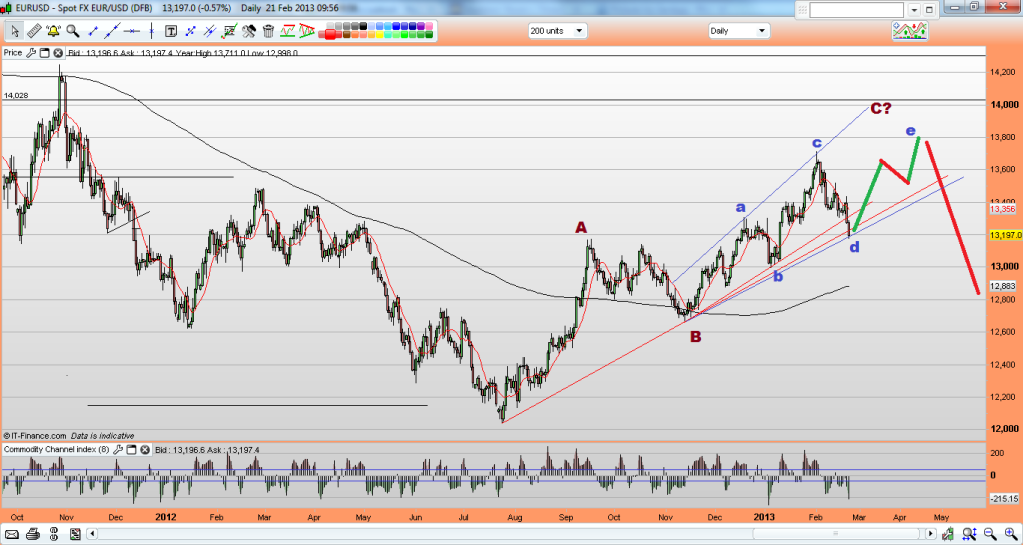
Up for another couple months yet? Sell in May, get the f*ck out of play?

Up for another couple months yet? Sell in May, get the f*ck out of play?
Davai - 21 Feb 2013 10:45 - 358 of 423
Last Cable calls;
followed by;
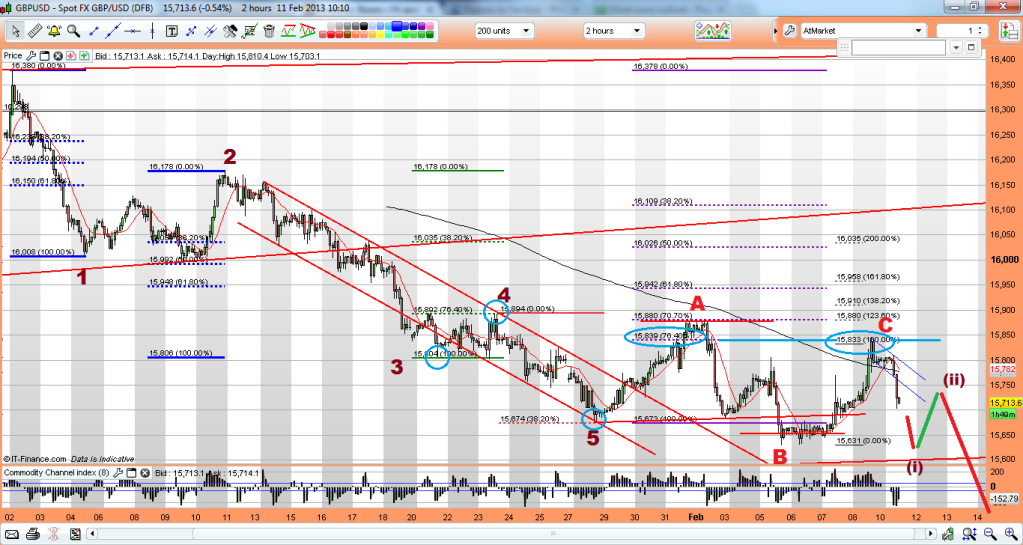
I have gone against many mainstream analysts with my count. Lots were calling my first corrective A wave as a 4th and followed by an ending diagonal. Well they must have been left scratching their heads when B finished in 3 waves instead. This surely has to put pay to anyone who doubts charting and in particular EW...
Update;
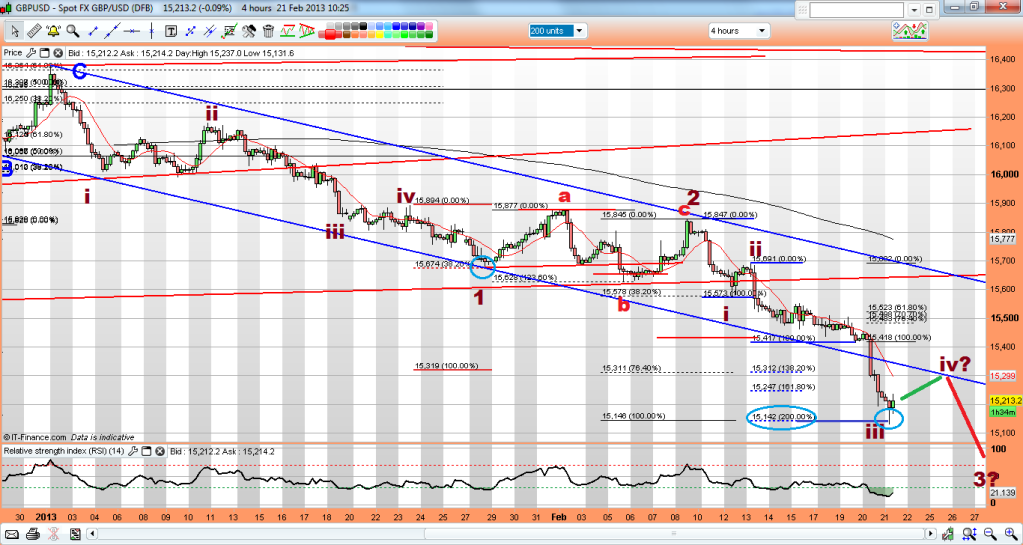
This needs to be followed meticulously. When 4&5 are done, we could see a massive rise to retest the breakout of the monthly wedge, possibly a bounce from 15,000 area (maybe even sub), back upto 15,700 ish (just a vague idea), either way, we don't want to be covering shorts for such a possibility...
Davai - 21 Feb 2013 11:06 - 359 of 423
Previous EurJpy chart;
Update;
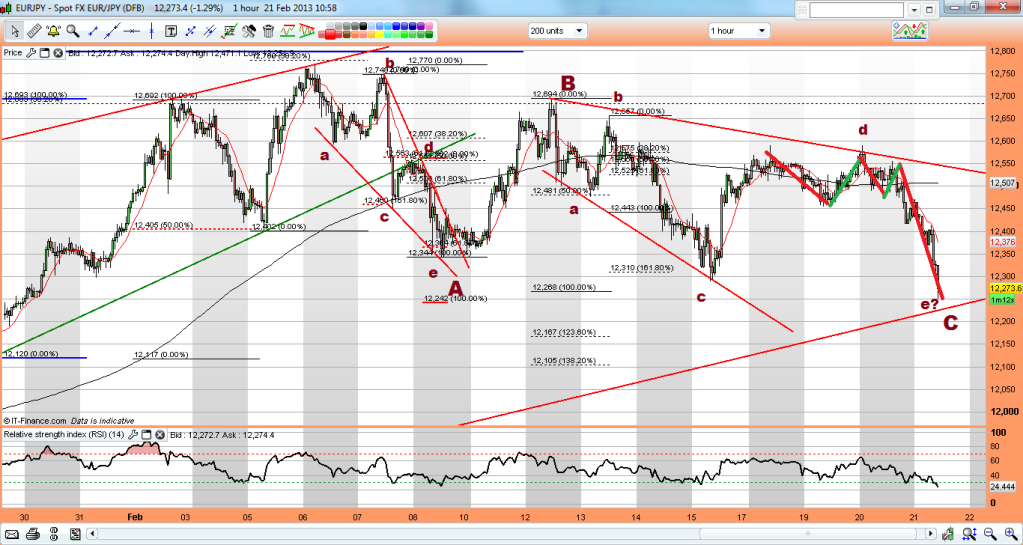
Update;

Davai - 22 Feb 2013 11:05 - 360 of 423
Only sense i can make of the current EurGbp count;

If so, we are merely corrective right now and with Cable to fall steeply over the coming months, what does that say for the Euro?

If so, we are merely corrective right now and with Cable to fall steeply over the coming months, what does that say for the Euro?
Davai - 25 Feb 2013 17:39 - 361 of 423
Looks like Euro weakness for short term, 4hr;

and a closer view on the 15min with wave 'c' = exactly 161.8% of wave 'a';

http://fxtechnicals.net/category/eurusd/

and a closer view on the 15min with wave 'c' = exactly 161.8% of wave 'a';

http://fxtechnicals.net/category/eurusd/
Davai - 27 Feb 2013 12:07 - 362 of 423

Davai - 27 Feb 2013 12:11 - 363 of 423

Davai - 27 Feb 2013 14:33 - 364 of 423
Remember this, Post 290, Dow;
Looking for 14,070... so what happened when we got there?

It does indeed look to be rolling over, but is it just a consolidatory phase? The question everyone wants to know! I'm working on it, but my Euro count is based on being corrective right now. The two are closely correlated, so calling 14,070 was one thing, now we are here though, it's a tough call. I will probably be trying to determine waves as always to give a clue. Interesting to read other analysts turning bearish, could be contrarian.
http://fxtechnicals.net/
Davai - 04 Mar 2013 18:38 - 365 of 423

Davai - 05 Mar 2013 12:41 - 366 of 423
Further to above;
Baseline channel;
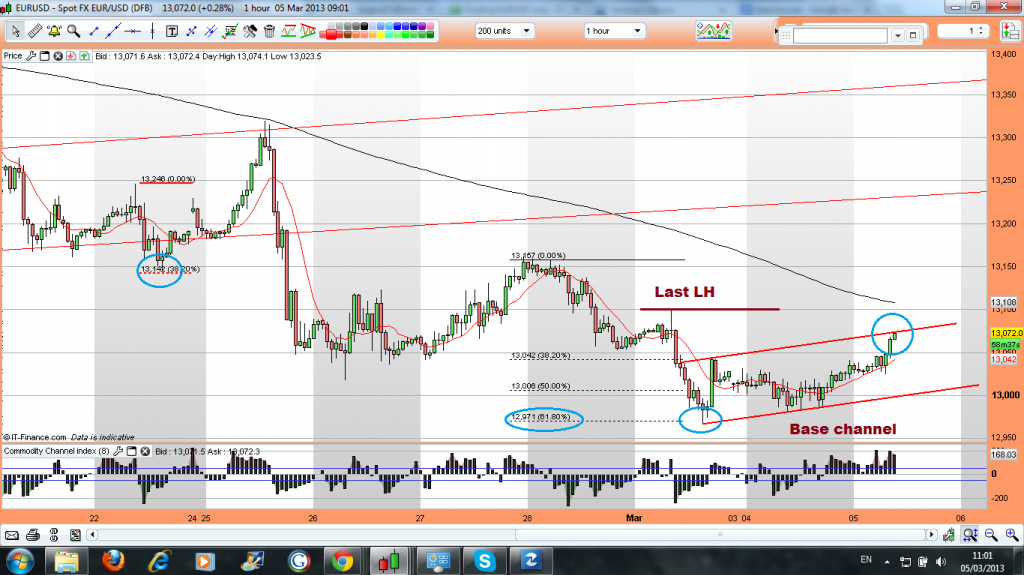
and consequent rejection, thus evidence of the move up being corrective. It also coincided with the 123.6% level of wave A. Short with stop above the earlier high, but expecting a little better entry yet (in a minor c wave);
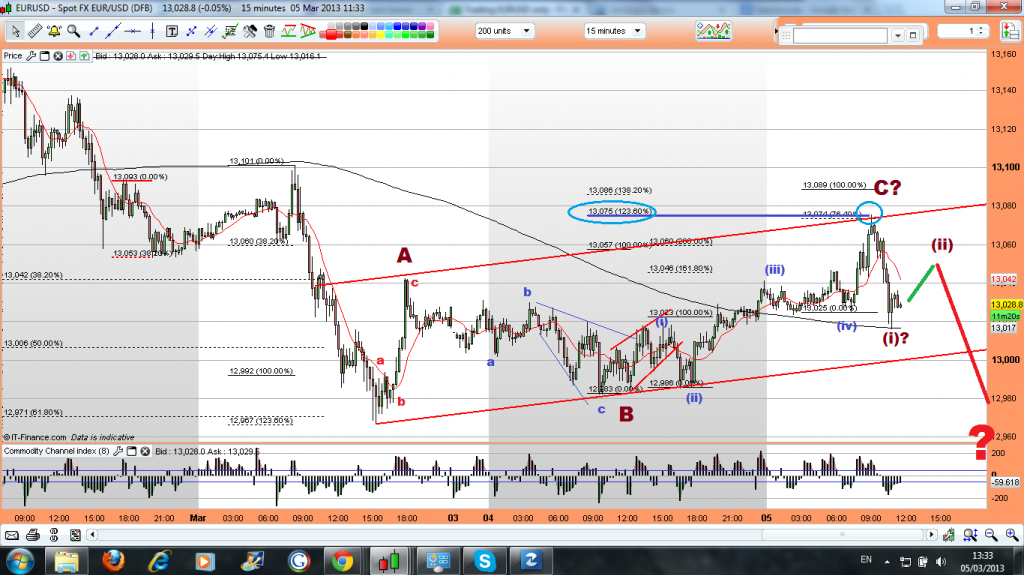
Baseline channel;

and consequent rejection, thus evidence of the move up being corrective. It also coincided with the 123.6% level of wave A. Short with stop above the earlier high, but expecting a little better entry yet (in a minor c wave);

Davai - 09 Mar 2013 14:30 - 367 of 423
Dow poss;


Davai - 13 Mar 2013 12:02 - 368 of 423
EurGbp as of yesterday,

(posted on blog at the time)

(posted on blog at the time)
Davai - 15 Mar 2013 16:28 - 369 of 423
Update to above;
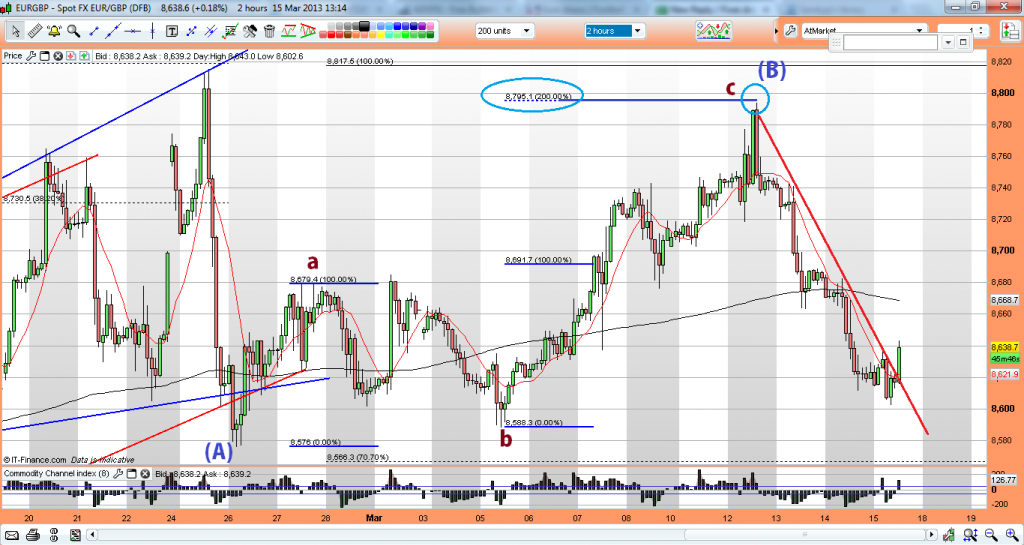

skinny
- 15 Mar 2013 18:03
- 370 of 423
Well done if you traded it.
Davai - 15 Mar 2013 19:32 - 371 of 423
I did indeed, cheers skinny...
I don't generally trade the index's but canny reaction so far as per 161.8% level in post 367...
I don't generally trade the index's but canny reaction so far as per 161.8% level in post 367...
Davai - 15 Mar 2013 21:07 - 372 of 423
FTSE;


Davai - 18 Mar 2013 13:00 - 373 of 423
Post 367 Dow poss;

Updated chart (fibs unchanged);

Updated chart (fibs unchanged);
Davai - 19 Mar 2013 16:35 - 374 of 423
Last night;

Updated earlier, (with extended abc wave 'ii');

and current;


Updated earlier, (with extended abc wave 'ii');

and current;

Davai - 22 Mar 2013 16:23 - 375 of 423
EurUsd story;
A wave (abc);

then 'B' wave (abc);

Now 'C'? (5w)

A wave (abc);

then 'B' wave (abc);

Now 'C'? (5w)

Davai - 27 Mar 2013 11:43 - 376 of 423
EurUsd as per blog post yesterday;

Today;

Today;
Davai - 27 Mar 2013 12:31 - 377 of 423
Earlier Dax chart;

Should have been more aggressive with the red line!

Should have been more aggressive with the red line!
Davai - 28 Mar 2013 19:33 - 378 of 423
Nice reaction at the 61.8% fib ext target;

Davai - 06 Apr 2013 13:14 - 379 of 423
Ftse daily posted 19th March;

Updated chart shows down move looks to be corrective, thus wave 4;

Updated chart shows down move looks to be corrective, thus wave 4;
Davai - 06 Apr 2013 13:42 - 380 of 423
Nice simple abc on the Dow last three days;


jkd - 09 Apr 2013 19:09 - 381 of 423
hi D
whats your take / opinion on nzd/usd ?
ta (thats thanks)
regards
jkd
whats your take / opinion on nzd/usd ?
ta (thats thanks)
regards
jkd
Davai - 10 Apr 2013 14:45 - 382 of 423
Hi jkd,
apologies for delay in replying, i've been ill with food poisoning since late on Sunday and thus have barely looked at any charts until today. Unfortunately you've asked me about a pair that hasn't been throwing me much to go on for quite some time, thus i've concentrated on others instead.
Much as i would love to give a view, nothing lines up for me, so i couldn't comment on how much further it will rise... sorry.
regards
D
Davai - 10 Apr 2013 14:46 - 383 of 423
I will add this update of the Eurgbp;
Previous chart;

Update;

Previous chart;
Update;
Davai - 10 Apr 2013 15:31 - 384 of 423
EJ;

all happened a little bit quicker than expected;

all happened a little bit quicker than expected;
jkd - 10 Apr 2013 20:58 - 385 of 423
D
thanks for your reply.i hope you are recovering or have recovered.
please do not think i was enquiring about how much further this might rise.(or not)
i am able to do my own analysis and draw my own conclusions on that matter.
i was simply interested to see what an elliott wave analysis might make of the current
price movement as i know very little about elliott wave analysis.
thanks again
regards
jkd
Davai - 17 Apr 2013 12:05 - 386 of 423
Understood jkd.
The mistake most people make when applying EWP is to make a count fit either a) their own thoughts, or b) when it really isn't recognisable! In this instance i chose 'b'!
Sometimes a pattern is very easy to recognise and comprehend. That in itself isn't enough though, as you need to be able to determine what PA did before the pattern you recognise so as to be able to label the move and have a perspective of what is likely to follow. This can start with minutes and of course, go through each cycle, hourly, daily, weekly etc...
The Kiwi has not given me much to go on for some time now...
regards D.
Davai - 17 Apr 2013 12:06 - 387 of 423
Quick revisit;
EurGbp 04/04/13;
Update;

EurGbp 04/04/13;
Update;

Davai - 21 Apr 2013 09:58 - 389 of 423
Apple has had a torrid time this year. I printed a chart of the weekly and made a quote late last year in Mid December, here on this thread, post 160;
(Chart);
(Quote);
‘Once we know for sure we are in wave ‘C’ its time to get short some more… $35 middle of next year anyone?’…
At the time i wasn't sure if wave B had finished, but as the chart showed at the time, the end result would be the same, (ie; much lower). It was approx $51 at the time and has indeed been down below the $40 mark.
Here is an article explaining why i don't think it's finished its decline yet...
Davai - 22 Apr 2013 14:04 - 390 of 423
Markets always tell fibs;

Update;

Update;
Davai - 24 Apr 2013 09:59 - 391 of 423
Trade percentages, not pips...

For 1% original risk, the R:R ratio was v.good, indeed it became 1:10+ Most people have a far longer timescale on their minds looking for a ten bagger amongst shares.

Article HERE
For 1% original risk, the R:R ratio was v.good, indeed it became 1:10+ Most people have a far longer timescale on their minds looking for a ten bagger amongst shares.
Article HERE
Davai - 25 Apr 2013 14:45 - 392 of 423


Davai - 26 Apr 2013 17:38 - 393 of 423
Bigger picture on daily, wave A retraced exactly 38.2% of the previous 5w rise;

Davai - 26 Apr 2013 17:38 - 394 of 423
GbpNzd;

'A' breaks down into 3 with minor 'c' = 100% of 'a'
'B' also breaks down with minor 'c' = 100% of 'a'
'B' is irregular, and is 150% of wave 'A, signalling overall weakness in the £/kiwi, expect wave 5 to extend.
Bigger picture; wave 4 (of overall wave 5);

'A' breaks down into 3 with minor 'c' = 100% of 'a'
'B' also breaks down with minor 'c' = 100% of 'a'
'B' is irregular, and is 150% of wave 'A, signalling overall weakness in the £/kiwi, expect wave 5 to extend.
Bigger picture; wave 4 (of overall wave 5);
Davai - 27 Apr 2013 11:45 - 395 of 423
Davai - 30 Apr 2013 18:21 - 396 of 423
Dow Jones;
Fridays call (upto 14,837);

Update;

Nice reaction off of the level, however, the drop this afternoon looks to have been corrective, so i now expect higher, otherwise we would require a LL at 14,650 to confirm downtrend.
Possibility of Double Top
Fridays call (upto 14,837);
Update;
Nice reaction off of the level, however, the drop this afternoon looks to have been corrective, so i now expect higher, otherwise we would require a LL at 14,650 to confirm downtrend.
Possibility of Double Top
Davai - 02 May 2013 09:22 - 397 of 423

Davai - 02 May 2013 09:25 - 398 of 423
Somewhat riskier though, as countertrend on anything less than the daily chart. My preferred trade is Short the EurGbp
Davai - 02 May 2013 14:43 - 399 of 423
Dont say i didn't warn you!

Davai - 02 May 2013 14:47 - 400 of 423
Chart behind the 'Short the EurGbp' call;

Analysis and article;
http://fxtechnicals.net/2013/05/eurgbp-chart-update-analysis-and-reason-why-im-short/
Analysis and article;
http://fxtechnicals.net/2013/05/eurgbp-chart-update-analysis-and-reason-why-im-short/
Davai - 07 May 2013 17:22 - 401 of 423

jkd - 07 May 2013 19:01 - 402 of 423
D
i hope you wont mind me asking this but is there any chance you can make your charts bigger so as i can see and read them? like you used to do when you originally started posting.
many thanks
regards
jkd
i hope you wont mind me asking this but is there any chance you can make your charts bigger so as i can see and read them? like you used to do when you originally started posting.
many thanks
regards
jkd
Davai - 09 May 2013 10:07 - 403 of 423
Hi jkd,
Using Flickr now, so not sure how to change size, i will take a look later. The charts are all on the website, the idea being that these are mostly posted in hindsight here. The upto date stuff all gets posted in realtime on there.
Example, here is a GbpNzd update;
It didn't make a simple 5w as expected and i was scratching my head early on, but updated chart and a lesser target was achieved. Ultimately there was a fib confluence lining up with channel line convergence for a target;

http://fxtechnicals.net/2013/05/gbpnzd-target-confirmed-trade-and-chart-update/
The charts are linked to the articles.
Using Flickr now, so not sure how to change size, i will take a look later. The charts are all on the website, the idea being that these are mostly posted in hindsight here. The upto date stuff all gets posted in realtime on there.
Example, here is a GbpNzd update;
It didn't make a simple 5w as expected and i was scratching my head early on, but updated chart and a lesser target was achieved. Ultimately there was a fib confluence lining up with channel line convergence for a target;
http://fxtechnicals.net/2013/05/gbpnzd-target-confirmed-trade-and-chart-update/
The charts are linked to the articles.
Davai - 09 May 2013 20:32 - 404 of 423
Previous Euro chart;

Reason i went short last night;

Had been confusing, but wave A reacted at 61.8% retrace of whole move and wave C at 76.4% (thus impulsive to the short side)

http://fxtechnicals.net/2013/05/eurusd-reacting-to-upside-fibonacci-retracement-levels/
Reason i went short last night;
Had been confusing, but wave A reacted at 61.8% retrace of whole move and wave C at 76.4% (thus impulsive to the short side)
http://fxtechnicals.net/2013/05/eurusd-reacting-to-upside-fibonacci-retracement-levels/
Davai - 10 May 2013 15:46 - 405 of 423
Swissie;
Previously;
http://fxtechnicals.net/2013/04/usdchf-corrective-wave-finished-and-more-upside-to-follow/

This one has been an epic!

Soon to be due a pullback, but higher to come after to create ND (imo)
Previously;
http://fxtechnicals.net/2013/04/usdchf-corrective-wave-finished-and-more-upside-to-follow/
This one has been an epic!
Soon to be due a pullback, but higher to come after to create ND (imo)
Davai - 10 May 2013 15:47 - 406 of 423
Cable channel;
Previous;

Current;

http://fxtechnicals.net/2013/05/gbpusd-cable-channel-long-trade-soon-to-be-in-play/
Previous;
Current;
http://fxtechnicals.net/2013/05/gbpusd-cable-channel-long-trade-soon-to-be-in-play/
Davai - 11 May 2013 09:01 - 407 of 423
Couple interesting levels hit yesterday on both EurUsd & GbpUsd simultaneously;
First, Cable;
http://fxtechnicals.net/2013/05/gbpusd-cable-channel-long-trade-soon-to-be-in-play/
A little later;

Now a look at the Euro;

There are two fib levels lining up together in the chart above. Firstly wave C = 123.6% of wave A (very common). Also break wave C down into 5w minor and its 5th subwave hits exactly its 61.8% extension of waves 0-3. This is standard.
Add to that, i noticed another level this morning;

The drop retraced exactly 61.8% of the prior rise...
http://fxtechnicals.net/2013/05/gbpusdeurusd-reversal-areas-hit-in-tandem/
Just highlighting what i see.
First, Cable;
http://fxtechnicals.net/2013/05/gbpusd-cable-channel-long-trade-soon-to-be-in-play/
A little later;
Now a look at the Euro;
There are two fib levels lining up together in the chart above. Firstly wave C = 123.6% of wave A (very common). Also break wave C down into 5w minor and its 5th subwave hits exactly its 61.8% extension of waves 0-3. This is standard.
Add to that, i noticed another level this morning;
The drop retraced exactly 61.8% of the prior rise...
http://fxtechnicals.net/2013/05/gbpusdeurusd-reversal-areas-hit-in-tandem/
Just highlighting what i see.
Shortie - 13 May 2013 11:31 - 408 of 423
Hi, are you still looking for a 1.22 high for GBP/EUR prior to a fallback or do you think its running out of steam?

Davai - 13 May 2013 19:27 - 409 of 423
Hi Shortie,
It's got me a little unsure, so i currently have no trade on the EG. Would i be right in saying that channel line you're referring to is IT's automatic system?
I have a channel line, but it's very weak and wouldn't really use it with any confidence and according to mine is still 150 odd pips to our south.
My only theory is that both Cable and the Euro are about to head North, but Cable, moreso, thus i am still biased short for the EG...
Problem being, i need more than a bias to take a trade! If i see owt, i will post it.
Regards.
Davai - 14 May 2013 11:48 - 410 of 423
I find myself now turning into a bear again for both the Euro and for Cable. So soon after posting the opposite last night!
Ok, but not before we are due a decent abc pullback after this current cycle plays out...
Previous possibility that we have seen a truncated C wave;

Eurusd-could-we-see-a-short-c-wave-fibonacci/
Truncated C waves are very confusing, however, it now appears it could be correct and we have a 5w minor short forming;

http://fxtechnicals.net/2013/05/eurusd-dive-dive-dive/
Ok, but not before we are due a decent abc pullback after this current cycle plays out...
Previous possibility that we have seen a truncated C wave;
Eurusd-could-we-see-a-short-c-wave-fibonacci/
Truncated C waves are very confusing, however, it now appears it could be correct and we have a 5w minor short forming;
http://fxtechnicals.net/2013/05/eurusd-dive-dive-dive/
Davai - 14 May 2013 15:40 - 411 of 423
Cable channel now turned resistance;
Previous;
Later, channel line break with some minor PD developing;

Now res;

http://fxtechnicals.net/2013/05/gbpusd-quick-update-position-closed-and-now-waiting-for-more-pa/
Previous;
Later, channel line break with some minor PD developing;
Now res;
http://fxtechnicals.net/2013/05/gbpusd-quick-update-position-closed-and-now-waiting-for-more-pa/
Davai - 14 May 2013 15:42 - 412 of 423
This makes the EG an even tougher call. I think cable will head lower throughout the rest of the year (with the usual pullbacks along the way), but i have no idea right now which will be the weaker of the two between the Euro and the £...
Shortie - 15 May 2013 09:59 - 413 of 423
Hi Davai,
The pink line above was from IT's auto system which I happend to agree with. I look at a combination of technicals, ichimoku clouds, your elliott wave system, candels & MA, before deciding what I think. Within EG though I am switching views almost daily on the technicals but think Euro will weaken overall looking at economics.
The pink line above was from IT's auto system which I happend to agree with. I look at a combination of technicals, ichimoku clouds, your elliott wave system, candels & MA, before deciding what I think. Within EG though I am switching views almost daily on the technicals but think Euro will weaken overall looking at economics.
Davai - 16 May 2013 08:50 - 414 of 423
I gather the ichimoku clouds are popular, yet will confess, i know nothing about them. The thing is, i could easily over-complicate things for myself and i'm finding i really don't need to...
I try not to tie myself to any particular chart. I often have dozens of trade ideas, but that doesn't mean i trade them all. I look for something which looks obvious and presents a low risk, decent reward ratio. It takes discipline and patience, but that is the ultimate key to being profitable imo.
For example, a Swissie trade that i banked earlier. This from the 21st April;
Usdchf-corrective-wave-finished-and-more-upside-to-follow/
The ABC was staring at me like a gift, following a 5w impulse cycle, thus we know we will have another to follow, update from earlier;

http://fxtechnicals.net/2013/05/usdchf-swissie-updated-chart-what-a-ride/
I try not to tie myself to any particular chart. I often have dozens of trade ideas, but that doesn't mean i trade them all. I look for something which looks obvious and presents a low risk, decent reward ratio. It takes discipline and patience, but that is the ultimate key to being profitable imo.
For example, a Swissie trade that i banked earlier. This from the 21st April;
Usdchf-corrective-wave-finished-and-more-upside-to-follow/
The ABC was staring at me like a gift, following a 5w impulse cycle, thus we know we will have another to follow, update from earlier;
http://fxtechnicals.net/2013/05/usdchf-swissie-updated-chart-what-a-ride/
Shortie - 16 May 2013 09:35 - 415 of 423
The Swiss does look very nice Davai, must confess I've been spending too much time messing about with the GBP/JPY on hourly charts to pay much attention to anything else. EUR/GBP is a favourite of mine to trade hence I'm always interested in other peoples views. I'm new to your Elliott Wave system but feel that if your charting agrees with my own then there is less risk in taking a position than if we disagree.
Davai - 17 May 2013 08:34 - 416 of 423
Yep, nice one.
When i first read about Elliott Wave, i couldn't understand it at all. I completely dismissed it as a load of crap! Then some time later, as i learnt about a flag trading system, the necessity to learn the basics of EW came apparent.
In the end, i found the flag trading system was simply not mechanical enough and needed far too much user input, (there's a word i'm searching for to describe this, but i'm damned if i can think of it right now!).
Hence i needed a greater knowledge of EWP to know what likely phase the market was in.
In the end through concentrating on that, i realised that there wasn't really any point using the flags anymore!
A little further down the road and i personally think EWP is simply the best method for deciphering market moves, but that's after many thousands of hours study and countless mistakes along the way. The learning process never really ends!
Davai - 17 May 2013 12:12 - 417 of 423
GbpNzd;
Original plan;
http://fxtechnicals.net/2013/04/gbpnzd-more-upside-in-c-wave-for-short-term/
Current;

Original plan;
http://fxtechnicals.net/2013/04/gbpnzd-more-upside-in-c-wave-for-short-term/
Current;
Davai - 20 May 2013 15:38 - 418 of 423
'Discretional'
That was the word! I swear i'm gonna be an Alzheimers sufferer when i'm a little older...
That was the word! I swear i'm gonna be an Alzheimers sufferer when i'm a little older...
skinny
- 03 Jun 2013 10:28
- 419 of 423
I have a nephew who would like to explore FX trading (something I don't really do).
Can anyone recommend a demo account provider other than CMC or IG?
Can anyone recommend a demo account provider other than CMC or IG?
hilary
- 03 Jun 2013 11:51
- 420 of 423
Skinners,
It's a minefield! He's welcome to message me through one of my websites - there's a contact form at Forex Broker CashBack if he wants to ask any questions.
It's a minefield! He's welcome to message me through one of my websites - there's a contact form at Forex Broker CashBack if he wants to ask any questions.
skinny
- 03 Jun 2013 11:54
- 421 of 423
Thanks Hils,
I'll pass it on.
I'll pass it on.
Davai - 10 Jun 2013 10:03 - 422 of 423
Ooooops, hadn't looked in for a while...
skinny;
Oanda or FXCM are prob good bets.
skinny;
Oanda or FXCM are prob good bets.
hilary
- 10 Jun 2013 10:54
- 423 of 423
OANDA is a market maker. That's OK if you're happy to trade against your broker, I suppose. Personally, I'm not.
And here's one VERY GOOD REASON why not to touch FXCM with a bargepole.
And here's one VERY GOOD REASON why not to touch FXCM with a bargepole.
| About MoneyAM | Ts and Cs | Privacy Policy | Investment Warning | Content Standards | Corporate Solutions | Advertise With Us | Site Map | © 2026 MoneyAM |
Register now for FREE
Share Prices,
Stock Quotes,
Charts, Bulletin Boards, Indices, Watchlists, Portfolio, Market News, Research
or see our Premium Services including Level 2, Terminal and much more.