
| Home | Log In | Register | Our Services | My Account | Contact | Help |
You are NOT currently logged in
Greystone


 - 23 Jan 2008 16:52


Kyoto
- 24 Jan 2008 08:30
- 12 of 50
Kyoto
- 24 Jan 2008 08:36
- 13 of 50
Master RSI
- 24 Jan 2008 08:42
- 14 of 50
Good morning
JSP
The "candlestick" finish yesterday>>>>> DRAGONFLY DOJI is a reversal signal on a short term downtrend.
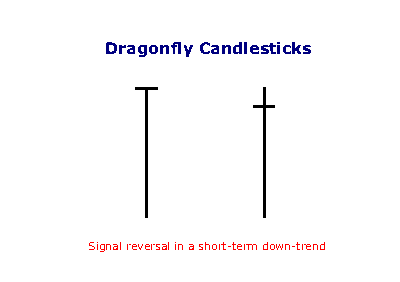


BULLISH DRAGONFLY DOJI
Type: Reversal
Relevance: Bullish
Prior Trend: Bearish
Reliability: Medium
Confirmation: Suggested
Definition:
The Bullish Dragonfly Doji Pattern is a single candlestick pattern that occurs at the bottom of a trend or during a downtrend. The Bullish Dragonfly Doji Pattern is very similar to the Bullish Hammer Pattern mentioned above. The distinction between the two is if there is a body or not. In case of Bullish Dragonfly Doji Pattern, the opening and closing prices are identical and there is no body. On the other hand the Bullish Hammer Pattern has a small real body at the upper end of the trading range.
Recognition Criteria:
1. There is an overall downtrend in the market.
2. Then we see a Doji at the upper end of the trading range.
3. The doji has an extremely long lower shadow.
4. However the doji does not have any upper shadow.
Explanation:
The market is in an overall bearish mood characterized by a downtrend. Then market opens and sells off sharply. However, the sell-off is suddenly abated and the prices reverse direction and start going up for the rest of the day closing at or near the days high thus leading to the long lower shadow. The failure of the market to continue in the selling side reduces the bearish sentiment. Now the shorts are increasingly uneasy with their bearish positions. If the market opens higher next day, many shorts will have a strong incentive to cover their short positions.
JSP
The "candlestick" finish yesterday>>>>> DRAGONFLY DOJI is a reversal signal on a short term downtrend.
BULLISH DRAGONFLY DOJI
Type: Reversal
Relevance: Bullish
Prior Trend: Bearish
Reliability: Medium
Confirmation: Suggested
Definition:
The Bullish Dragonfly Doji Pattern is a single candlestick pattern that occurs at the bottom of a trend or during a downtrend. The Bullish Dragonfly Doji Pattern is very similar to the Bullish Hammer Pattern mentioned above. The distinction between the two is if there is a body or not. In case of Bullish Dragonfly Doji Pattern, the opening and closing prices are identical and there is no body. On the other hand the Bullish Hammer Pattern has a small real body at the upper end of the trading range.
Recognition Criteria:
1. There is an overall downtrend in the market.
2. Then we see a Doji at the upper end of the trading range.
3. The doji has an extremely long lower shadow.
4. However the doji does not have any upper shadow.
Explanation:
The market is in an overall bearish mood characterized by a downtrend. Then market opens and sells off sharply. However, the sell-off is suddenly abated and the prices reverse direction and start going up for the rest of the day closing at or near the days high thus leading to the long lower shadow. The failure of the market to continue in the selling side reduces the bearish sentiment. Now the shorts are increasingly uneasy with their bearish positions. If the market opens higher next day, many shorts will have a strong incentive to cover their short positions.
Kyoto
- 24 Jan 2008 08:51
- 15 of 50
Kyoto
- 24 Jan 2008 08:56
- 16 of 50
Kyoto
- 24 Jan 2008 09:07
- 17 of 50
Kyoto
- 24 Jan 2008 09:12
- 18 of 50
Kyoto
- 24 Jan 2008 09:22
- 19 of 50
Kyoto
- 24 Jan 2008 09:28
- 20 of 50
Kyoto
- 24 Jan 2008 09:33
- 21 of 50
Kyoto
- 24 Jan 2008 09:38
- 22 of 50
Kyoto
- 24 Jan 2008 09:44
- 23 of 50
Kyoto
- 24 Jan 2008 09:54
- 24 of 50
Kyoto
- 24 Jan 2008 09:59
- 25 of 50
Kyoto
- 24 Jan 2008 10:14
- 26 of 50
Kyoto
- 24 Jan 2008 10:20
- 27 of 50
Kyoto
- 24 Jan 2008 10:35
- 28 of 50
maddoctor - 24 Jan 2008 10:37 - 29 of 50
Kyoto , thanks for the xta , wondered what the hell was going on there!
Kyoto
- 24 Jan 2008 10:50
- 30 of 50
Kyoto
- 24 Jan 2008 11:00
- 31 of 50
maddoctor - well if Brazil's newspapers are anything like as accurate as their UK counterparts sometimes, a large pinch of salt may need to be applied there. Still, it's in my mind that the Government there have a shareholding in Vale so I'm guessing they can certainly directly influence the decision if they are opposed to it.
| About MoneyAM | Ts and Cs | Privacy Policy | Investment Warning | Content Standards | Corporate Solutions | Advertise With Us | Site Map | © 2026 MoneyAM |
Register now for FREE
Share Prices,
Stock Quotes,
Charts, Bulletin Boards, Indices, Watchlists, Portfolio, Market News, Research
or see our Premium Services including Level 2, Terminal and much more.