
| Home | Log In | Register | Our Services | My Account | Contact | Help |
You are NOT currently logged in
Davai - 18 Apr 2012 11:13


Thread designed to record set-ups and targets on index and FX pairs.
'A market is only your enemy until you understand it, then it becomes your best friend.'
Any questions, please feel free to ask.
From time to time i may openly state an opinion regarding direction of a set-up and wish to add that in no way am i recommending a trade. I am sometimes only in trades for a matter of minutes and can't always update as to entry/exits taken.
As always, markets are dangerous places to be and must be respected as such. Always use stop losses and never over-leverage; 3% of your pot as a maximum per trade. As always, YOU are responsible for your own trades! Happy pip hunting!
Click HERE to visit me at FXtechnicals.net
Toya

 - 07 Dec 2012 20:45
- 144 of 423
- 07 Dec 2012 20:45
- 144 of 423


I'll leave the forex to you, Davai! Couldn't begin to do all that analysis... But I agree we've been testing around 5920 on the FTSE - I feel we may have reached the top there for a while; we'll soon see if that's correct!
Davai - 08 Dec 2012 10:20 - 145 of 423
Copied edited remark from above post 142;
*edit 08/12/12; hmmmm there may be a possibility that i'm one count out... the 3&4 above might be 'iii'&'iv' of this particular third, with the 5th being the end of the 3rd. I've made this mistake a few times recently... will do some more work on it later*
The more i look at it, the more it looks more likely... the double ABC again same as with the daily. I was obviously too tired last night! Honestly... mental state is also a big part of trading! It will mean that we are in the 4th (or just finished) right now and still have a blast north yet for the 5th of this degree. This can of course be extended, so its obvious to me the only safety will be to rely on the small time scales.
The reason for all of this? I'm looking to trial a bit of swing trading and see if i can ride a much longer phase. It goes against my usual style as i absolutely hate to stay in corrective moves and watch precious profit disappear time and time again, preferring to be in and out in succession. The problem is often missing the larger move while 'out' of a trade. That means an awful lot of work making small amounts and missing the larger portion...
All of the above charts are workings as to try to find the next big trend. As you can tell, however, it can be tricky and requires more (at this time) experience than i currently possess. This is a work in progress!
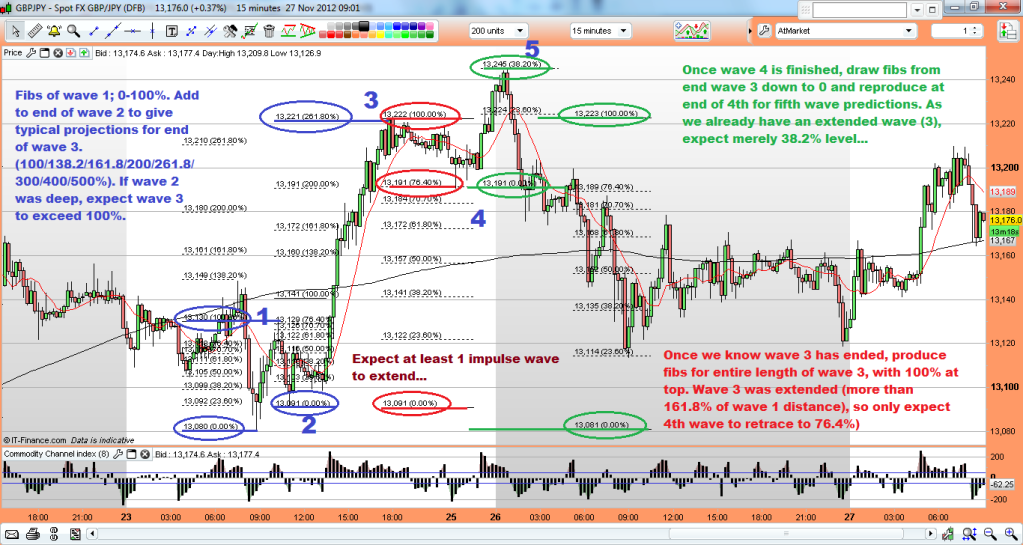
Trying to trade a wave 2 pullback to be positioned for wave 3 is proving to be lethal. The best trade and easiest to recognise is after the powerful wave 3 itself. If wave 3 doesn't extend (is not more than 1.618% of wave 1), and wave 4 retraces 38.2% of wave 3, you have a fantastic low risk trade, going with trend off of this fib level to trade the 5th wave. Your stop is a couple of pips inside wave 1 as wave 4 mustn't cross into this territory, therefore should be around a 1:3 R:R...
*edit 08/12/12; hmmmm there may be a possibility that i'm one count out... the 3&4 above might be 'iii'&'iv' of this particular third, with the 5th being the end of the 3rd. I've made this mistake a few times recently... will do some more work on it later*
The more i look at it, the more it looks more likely... the double ABC again same as with the daily. I was obviously too tired last night! Honestly... mental state is also a big part of trading! It will mean that we are in the 4th (or just finished) right now and still have a blast north yet for the 5th of this degree. This can of course be extended, so its obvious to me the only safety will be to rely on the small time scales.
The reason for all of this? I'm looking to trial a bit of swing trading and see if i can ride a much longer phase. It goes against my usual style as i absolutely hate to stay in corrective moves and watch precious profit disappear time and time again, preferring to be in and out in succession. The problem is often missing the larger move while 'out' of a trade. That means an awful lot of work making small amounts and missing the larger portion...
All of the above charts are workings as to try to find the next big trend. As you can tell, however, it can be tricky and requires more (at this time) experience than i currently possess. This is a work in progress!
Trying to trade a wave 2 pullback to be positioned for wave 3 is proving to be lethal. The best trade and easiest to recognise is after the powerful wave 3 itself. If wave 3 doesn't extend (is not more than 1.618% of wave 1), and wave 4 retraces 38.2% of wave 3, you have a fantastic low risk trade, going with trend off of this fib level to trade the 5th wave. Your stop is a couple of pips inside wave 1 as wave 4 mustn't cross into this territory, therefore should be around a 1:3 R:R...
hilary
 - 10 Dec 2012 07:58
- 146 of 423
- 10 Dec 2012 07:58
- 146 of 423

The reason that you probably find the kiwi generates easy to follow chart patterns against the greenback is that it's what I would describe as a 'single sided' pair.
By that, I mean most pairs and crosses are influenced by two distinct sets of newsflow. For instance, if you're trading fiber, then Europe's events will influence the pair, as will the newsflow out of the US. If both sets of newsflow are either positive or negative, then the pair can be a bit choppy until the market decides which side's newsflow carries most weight. If one side's newsflow is positive and the other side's newsflow is negative, then the moves will be more exaggerated as a result.
However, New Zealand as a country carries no real economic influence. It has no mineral resources, there are more sheep than there are humans, and they make some nice butter. But that's about the extent of it. The kiwi has historically been used sometimes for carry trades, but not at the moment. Therefore, there's unlikely to be any news coming out of NZ which is going to have any impact on the NZD/USD, and the pair is going to be almost totally influenced by the newsflow out of the US. This single-side aspect is what makes the chart easier to read and interpret.
The downside of this is that the minimal liquidity in the pair means retail punters will generally have to pay high spreads. Everything I've said about NZD/USD also applies to the EUR/NZD cross.
Davai - 11 Dec 2012 12:18 - 147 of 423
FTSE S/R line. Rejected yesterday, but teasing with it again now;


Davai - 11 Dec 2012 12:41 - 148 of 423
Very difficult to call wave structure with accuracy and i'm not getting many levels lining up, (usually means something is amiss), so not to be trusted, but just putting this out there;


Davai - 11 Dec 2012 13:09 - 149 of 423
I can't see an end in sight yet!
If the above is correct and regardless of whether its the 5th of the 3rd or the overall 5th, we should head higher from here (after a brief pullback this afternoon/evening), in a 3rd wave;

If the above is correct and regardless of whether its the 5th of the 3rd or the overall 5th, we should head higher from here (after a brief pullback this afternoon/evening), in a 3rd wave;

Davai - 11 Dec 2012 13:26 - 150 of 423
Somehow i managed to **** this trade up, despite watching it closely yesterday, pretty annoyed with myself, especially as i stated merely three days ago, its my fave trade, (the 4th wave pullback), admittedly, there was a bit more risk as wave 3 was extended;

Wave 5 might not be finished yet, but the 38.2% was primary objective, 16,100 being a round number was also going to provide res...

Wave 5 might not be finished yet, but the 38.2% was primary objective, 16,100 being a round number was also going to provide res...
Davai - 12 Dec 2012 09:39 - 151 of 423
Euro about to turn down again?

Current move would be A&B (not 1&2) with 'C' to come

Current move would be A&B (not 1&2) with 'C' to come
Davai - 12 Dec 2012 09:58 - 152 of 423
Turning back to the EurJpy again, its looking likely that i labeled the 4th of the third as the 4th itself again. Explains the confusion late last week. When i noticed it reversed at the 50% projection, it leads me to believe it was likely end of the 5th. If this is correct, we wont breach the blue line, so possibly a good risk/reward trade at present. Breach of this (a fresh HH) and its rethink time, there is still a count meaning the previous 1&2 was an A&B... I would prefer to wait to see a minor 5w short/abc retrace first off of the fib level (red line).

*Edit* Ok, a fresh high, so either 1&2 was an A&B, or its a much larger irregular. Can't see it being irregular as it would mean the down move was 'A' in three waves...
(I'm writing this for my benefit, i doubt anyone is following me and nodding in agreement!)
*Edit x2* sussed it i think... a small wave 'C';

No wonder i've been turned inside out with this one. Far too many possibilities until the HH earlier. Especially with an irregular 'B' wave. So a long at the lows got stopped out and a short at the highs likewise. Nice one. Malodyets mr.Market... Thie is why i'm preferring to stick with the 4th wave trades... far easier too determine and goes with the immediately preceding trend...
Davai - 12 Dec 2012 10:27 - 153 of 423
Same mistake again and again... previous labeling for cable, for the 3rd wave only. It doesn't change the respective levels, so the workings are all good, just that there was the 'real' 4th and 5th to come;


Davai - 12 Dec 2012 14:29 - 154 of 423
Fifth waves (and 'C' waves) can be tricky to trade, presenting themselves in several different manners; diagonals, expanding and contracting, (both of which can see wave 4 cross into wave 1) or in a regular impulsive structure. Here, breaking cables 5th wave down on a lower time frame, the 3rd wave gives it away again, leading to another set-up. Don't forget its not about pips, its about percentages;


Davai - 14 Dec 2012 08:27 - 155 of 423
Dax again, in post 149, i was expecting a small ABC pullback that afternoon/evening (11th). It happened but not before having a further blast north, so no brownie points there;

The larger ABC (4th) is not the one i have shown (expecting) in post 148. The size of this current cycle makes me believe it is indeed a 5th wave and probably finishing off (the larger) wave 3. That would mean a HH to come followed by a longer, deeper and more complex retracement, possibly lasting a week, before back on track to finish the year... The caveat is (and there has to be one with this kind of trending!), is that, if the previous larger ABC (ending on the 9th) was something more substantial, we could be playing out the overall 5th right now and once finished, get ready for a big drop... personally i don't think so... I reckon Mid Jan before putting the hats on... Just an opinion )
PS, the blue line... Wave 4 not entering wave 1 territory; what a fantastic R:R trade!
Davai - 16 Dec 2012 20:09 - 156 of 423
Might have to change my above view. Looks like it might be the overall 5th afterall. Got a few charts looking like some tops very near indicating dollar strength about to return. Risk off again?

16190 also relevant.
My earlier Euro call was dreadful and influenced slightly by the EurJpy chart, After i worked that one out i didn't bother to update the Euro chart. I now think the breach of the prior ABC can be explained like this;

The 4th wave allowed to breach the (iv'th) of the 3rd. I would normally expect only the 61.8% level for the top (as we reached on Friday afternoon), however, channel lines leave headroom for a little bit more. The channel lines (blue) working perfectly for predicting the end of wave 3 (connect 2&4, draw parallel off of top of 1 for end of 5), the second set obviously wont work the same due to the pullback of 2, thus we go off of the top of 3 for our parallel line... Well, we shall see... )
Davai - 16 Dec 2012 21:12 - 157 of 423

Davai - 17 Dec 2012 08:56 - 158 of 423
When we reach the end of this cycle, it will be the first 5 wave of correction, expect a zigzag ABC 'B' wave retracing typically 50% of the whole upswing (approx 500pips currently), before a further 5 waves up;


Davai - 17 Dec 2012 12:12 - 159 of 423
Post 156 Cable;
Update;

*Edit* A cluster of Fibs, 2nd/3rd and now 4th degree are lining up at 16,230 area.
Update;

*Edit* A cluster of Fibs, 2nd/3rd and now 4th degree are lining up at 16,230 area.
Davai - 17 Dec 2012 13:47 - 160 of 423
Bit of fun with everyone's favourite;
First the weekly;

There is of course the possibilty the labeling after the 1&2 could be for for the 3rd wave, thus we are in the 4th right now, but i doubt it. Wave 5 being exactly 100% of 3 for a start...
Daily (concentrating on the 5th);

Shows we have clearly finished wave A of the corrective move.
Now to the 4hr to look at the corrective move;

This is very tricky to call, it's nigh on impossible right now to rule out a very short, quick 'B' wave having already finished, however, i would imagine not and we have merely completed minor wave 'A' (of 'B') and are somewhere close to the end of minor wave 'B' right now (either a flat or an irregular). It is a 3-3-5 move and thus once we turn, we should head back up to make a HH to complete the larger 'B' wave (not to time scale). I have the blue line penciled in, if the label for the 5th minor of the 'A' wave is correct, being extended, we should correct back to that cycles wave 'ii'... Lets see... Certainly not taking a trade off of this yet. Once we know for sure we are in wave 'C' its time to get short some more... $35 middle of next year anyone?
Davai - 19 Dec 2012 10:21 - 161 of 423
GbpJpy made a partial 'gapfill', after a clear ABC (where the EurJpy did indeed gapfill), we get a flag set-up and target;

The result;


The result;

Davai - 19 Dec 2012 11:05 - 162 of 423
How much further can we go? Combining some channel lines on the Dow;

and scaling in;

an approximation, i see the lines have slipped a bit from being produced on the 4hr... IG's charts... grrrrrrrrr

and scaling in;

an approximation, i see the lines have slipped a bit from being produced on the 4hr... IG's charts... grrrrrrrrr
Davai - 19 Dec 2012 11:38 - 163 of 423
The thing that would concern me here is that we haven't had an extended wave of the 3rd (yet), its highly likely that the 5th could be. Raising the channel line off of the top of the 3rd gives more scope, but 5 going to 100% level wouldn't surprise me;

I will be keeping a close eye on smaller timescales to watch for a reflex point to be broken in a minor 5w move south, until this happens its go long off of every ABC...
I have another set of channel lines off of the whole move, but we would need a 300+ point up day to get anywhere near them...

I will be keeping a close eye on smaller timescales to watch for a reflex point to be broken in a minor 5w move south, until this happens its go long off of every ABC...
I have another set of channel lines off of the whole move, but we would need a 300+ point up day to get anywhere near them...
| About MoneyAM | Ts and Cs | Privacy Policy | Investment Warning | Content Standards | Corporate Solutions | Advertise With Us | Site Map | © 2026 MoneyAM |
Register now for FREE
Share Prices,
Stock Quotes,
Charts, Bulletin Boards, Indices, Watchlists, Portfolio, Market News, Research
or see our Premium Services including Level 2, Terminal and much more.