
| Home | Log In | Register | Our Services | My Account | Contact | Help |
Traders Thread - Friday 11th July (CW.)
Crocodile - 11 Jul 2003 00:45
|
|
|
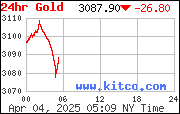
Gold
|
|
|
|
|
|
|
|
|
S&P &Futures (Click for latest)
|
Pre Market Futures (7:30) | |
| FTSE | -6 | ||
| TechMark | -4 | ||
| DAX | -8 | ||
|
Hang Seng +-
|
Nikkei +-
|
DOW | -25 |
| S&P | -3 | ||
| Nasdaq | -5.5 | ||

|
News Headlines: JJB Sports says like-for-like turnover from stores open for more than a year fell 3.4 percent in the 23 weeks to July 6 and it expects trading to remain challenging. Competition from the rapidly expanding Decatholon chain may be to strong a challenge for JJBSIG Builders merchant has posted a nine percent jump in first-half like-for-like sales and expects market conditions to remain similar in the next six monthsKingfisher sells non-core French specialist builders merchant subsidiary, Dubois Materiaux, for Euro 100 million Anite Group Friday reported underlying profit before tax of GBP18.6 million, down from GBP30.0 million a year ago, for the year to 30 April 2003. The CEO said: "This has been a year of transition for Anite and the current financial year is expected to be one of consolidation. The current year has started slowly but in line with our expectations. As markets remain tough with no immediate signs of improvement, a similar trading pattern to last year is expected in the current year.
|
|||||||||||||||||
ThePlayboy
 - 11 Jul 2003 11:28
- 15 of 22
- 11 Jul 2003 11:28
- 15 of 22

Fri, 11 Jul 2003 11:19
Good morning,
The 982 area held last night. I had hoped for the 980 area but as it turned out, the geometry at 982. I have attached a chart so you can see the significance of 982. If the market breaks 982 it is a sell, and the target will be the funny spike low at 974.50. The market is in trouble as long as it is trading below 993. Above that would mean a short covering rally above the 1000 area. Essentially the first hour will be the key today. Today is the only day the bulls have to save the rally. Otherwise the SP500 will test the 960 area. It is clear to me that the scenario I told you about two days ago is coming true. The market was held up to allow the guys in the know to go maximum short SPY and QQQ. I would not be surprised to see a good rally today to allow them to sell at higher prices again. The scenario I am working on is the chart I showed you earlier in the week. This is the longer-term cycle that supports a big sell-off until the 21st July. I fear it will be a grind, as most bulls believe that every dip is a buying opportunity. I will not be until we take out 960 that they all of a sudden realise that we are headed down.
The alternative scenario, which I can't overlook at the moment, is the impulse wave up from the March lows in the Dow. I can't show you that chart because it is hand-drawn. This chart points to much higher prices to come, near 9970 in the Dow. I will dismiss this scenario until the Dow takes out the last 0.618 big degree retracement at 9350.
The expected path today shows a very choppy trading day.
Have a great weekend
NO DOUBT HIS CHARTS WILL BE POSTED LATER, I HAVE THEM IN AN EMAIL BUT CAN,T CUT/PASTE THEM!
Da Bear - 11 Jul 2003 13:20 - 16 of 22
As long as there are no overtly bearish headlines, a drop at the open on Friday is probably going to attract buyers. Buyers started to make their presence known near the end of trading on Thursday, and while another down day like Thursday is possible, a rebound in prices would be natural.
One of the potential problems with Friday is that some of this expected buying is just going to be bears booking short-side profits and the lift might not attract terrific follow-through. This is also a Friday in the summer when afternoon trading volumes can be thinned by early escapes for the weekend, which adds another little wildcard.
I will be looking at the VIX (market volatility index) and put-call ratios for some insight into whether the buyers can prevent another day like Thursday from unfolding. If there is a drop at the open (which would be the preferred scenario),it would be better to see the CBOE total P/C ratio jump above 0.90, preferably over 1.00. The equity only P/C ratio should move above 0.85, preferably above 1.00. If there is a price advance, I will be looking to the VIX and that number should be heading lower, at least under 21.00, preferably under 20.88.
There should be a positive underlying trend in place over the next couple of weeks. Right now the markets are trying to work through a short-term minor overbought condition. So far, the retracement has not broken through any envelopes of normalcy in terms of a consolidation after a run-up. I would become concerned that a bigger decline might be in the making if the Nasdaq dropped to print under 1660 without attracting buyers immediately.
Resistance: The S&P 500's immediate intraday resistance starts at 998 and becomes very thick at 1010-1015.33. The bigger picture of resistance, which was established by price action in June, 2002, is that the S&P 500 has a band of resistance at 1008-1041, with a focus of 1020-1031.
The Nasdaq has immediate resistance at 1722-1748; it actually runs all the way to 1758.18. The next layer of resistance is 1778-1829.58. There is a gap in the price chart which runs from 1778.80 to 1796.46, which was created by a downward gap at the opening on Apr. 22, 2002. Sometimes the first print inside a gap like this will draw sellers.
Support: The Nasdaq has immediate intraday support at 1735-1713, then 1715-1693, which makes the 1715-1713 area important support. Additional support is 1684-1648. I think it would be unhealthy if the index printed below 1660 without attracting buyers immediately.
Immediate intraday support for the S&P 500 is 990-983.63, then 980-962.10. I think it would be unhealthy if the index printed below 960 without attracting buyers immediately. There is a big band of support for the S&P 500 at 948-912.
ThePlayboy
- 11 Jul 2003 13:32
- 17 of 22
May trade balance -$41.5bn actual fig -$41.84
Da Bear - 11 Jul 2003 14:01 - 18 of 22
Da Bear - 11 Jul 2003 14:15 - 19 of 22
Da Bear - 11 Jul 2003 14:27 - 20 of 22
OEX $-weighted put/call @ Thu Jul 10 16:20:00 2003: 0.73 (calls: $19092600; puts: $13989400).
QQQ $-weighted put/call @ Thu Jul 10 16:10:00 2003: 4.01 (calls: $1811590; puts: $7272630).
ThePlayboy
- 11 Jul 2003 16:47
- 21 of 22
R2 4095.8
R1 4076.9
PP 4045.3
S1 4026.4
S2 3994.8
Close above Fri pp after loosing 3.2 pts in the auction, close just above ftse 4054(38.2%) fib level putting us back into the trading range of 4054/4085 (50% fib lvl)
FTSE WEEKLY PP
R2 4127.5
R1 4092.8
PP 4053.2
S1 4018.5
S2 3978.9
Close above this weeks ftse pp!
Have a nice weekend!
Iain

 - 11 Jul 2003 18:29
- 22 of 22
- 11 Jul 2003 18:29
- 22 of 22


- Page:
- 1
- 2
| About MoneyAM | Ts and Cs | Privacy Policy | Investment Warning | Content Standards | Corporate Solutions | Advertise With Us | Site Map | © 2026 MoneyAM |