
| Home | Log In | Register | Our Services | My Account | Contact | Help |
You are NOT currently logged in
Technical Analysis (TA)
ptholden

 - 09 Jul 2007 23:14


I often find all manner of reference to Technical Analysis whilst reading threads, questioning certain elements, asking for advice on indicators and also requesting advice on a stock and whether it's a good time to buy, sell, hold or remain indifferent. I am the first to admit that my own TA is still in its infancy, but I do spend time on expanding my knowledge (hopefully in the right direction!).
Rather than having to ask a TA question on a particular thread, perhaps this thread could be used as a forum for TA queries and become a knowledge base. Just a thought, if there is little or no interest, the thread will sink without trace and that will be the end of that. I will personally add a few snippets to help those with less knowledge (if that's possible) to keep things rolling. There is a danger that the thread will receive countless requests for opinions on a variety of stocks and there is only so much I can do alone, therefore I would more than welcome input from other posters, no matter how rudimentary they believe their own knowledge to be, hopefully some real experts will take the time to contribute.
Rather than having to ask a TA question on a particular thread, perhaps this thread could be used as a forum for TA queries and become a knowledge base. Just a thought, if there is little or no interest, the thread will sink without trace and that will be the end of that. I will personally add a few snippets to help those with less knowledge (if that's possible) to keep things rolling. There is a danger that the thread will receive countless requests for opinions on a variety of stocks and there is only so much I can do alone, therefore I would more than welcome input from other posters, no matter how rudimentary they believe their own knowledge to be, hopefully some real experts will take the time to contribute.
ptholden
- 11 Jul 2007 15:18
- 17 of 504
Richard re TAN, yes we did come to the same conclusion using different indicators, which when used together further strengthen any TA and therefore the decision process. My thoughts were that a correction / retracement was due, as were your own and we both arrive at support in the region of 175p. Isn't the world a lovely place when we all agree, although my next post disagrees with your thoughts on DOO :)
cynic
- 11 Jul 2007 15:28
- 18 of 504
we did not actually disagree for i said i would NOT buy at the current level ..... in fact, since posting that, sp has bolted a further 20p ...... given that sp has been quite static for the last week or so and wonder if there is any good reason for the new surge.
rsi must eventually correct itself, but if i read you correctly, the upward trend is still maintained provided that rsi does not fall below 70 or thereabouts ...... conversely, i guess your "logic" also implies that if rsi now rises above about 85, then a new buy signal is triggered ...... hmm! that sounds a bit brave to me, so may have misinterpreted
rsi must eventually correct itself, but if i read you correctly, the upward trend is still maintained provided that rsi does not fall below 70 or thereabouts ...... conversely, i guess your "logic" also implies that if rsi now rises above about 85, then a new buy signal is triggered ...... hmm! that sounds a bit brave to me, so may have misinterpreted
ptholden
- 11 Jul 2007 16:02
- 19 of 504
The point on which I disagree is that DOO is affected by special factors (BP) and therefore conventional TA does not or cannot apply. The TA argument goes along the lines of:
1. Market action discounts everything
2. Prices moves in trends
3. History repeats itself
(From JJ Murphy Technical Analysis of the Financial Markets)
Number 1 discounts BP.
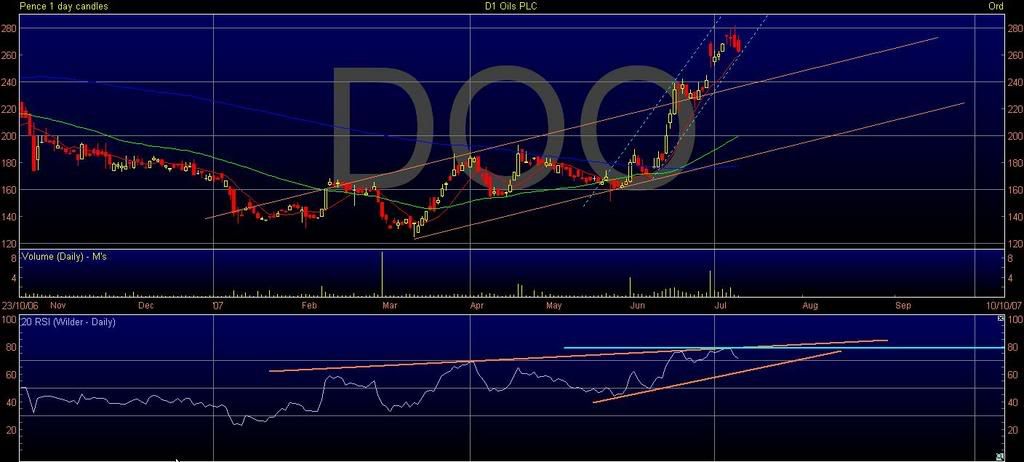
Anyway, here's a chart, unfortunately it does not include today's action, I'll have to wait until 1800 before my charting package is updated, but I will post another one later.
First important thing to note is that the RSI failure swings are intended to work only when the indicator is over 70 or under 30 to initiate a short or long position, not to initiate a long position if already over 70. Although it's an interesting concept, but one I feel laced with considerable risk. I'll have to look at the mathematics of the RSI to find out exactly what such an approach would entail.
Back to DOO: Mid June the SP was happliy bouncing within a reasonable trend and then a breakout (again this was confirmed by the RSI, that failure swing once more). Since then it is clear that the SP is in a much steeper channel and thus far is maintaining that channel. This particualr screenshot has compressed the chart somewhat, so it doesn't look that steep, but actually it is. As Cynic says, it needs to at least consolidate sometime if not retrace, problem is determining when it will stop and where support lies. The RSI would seem to set a cap on the move, the upslopey trendline and the horizontal line should both act as resistance and taking today's move into consideration it would appear that this might just be it for now. That isn't to say it WILL retrace, but that the price action will take a breather. The retracement will occur if the RSI support line is broken. If there is a retracement I see support at 240p+, this is the top of the previous shallower channel. If that doesn't hold then there is (although not drawn) a mid line to this particualr channel which would offer support at 220p+. If it were to falll that far I daresay the 50MA would be about in the same place by then and provide additional support.
pth
![<a href=]()
1. Market action discounts everything
2. Prices moves in trends
3. History repeats itself
(From JJ Murphy Technical Analysis of the Financial Markets)
Number 1 discounts BP.
Anyway, here's a chart, unfortunately it does not include today's action, I'll have to wait until 1800 before my charting package is updated, but I will post another one later.
First important thing to note is that the RSI failure swings are intended to work only when the indicator is over 70 or under 30 to initiate a short or long position, not to initiate a long position if already over 70. Although it's an interesting concept, but one I feel laced with considerable risk. I'll have to look at the mathematics of the RSI to find out exactly what such an approach would entail.
Back to DOO: Mid June the SP was happliy bouncing within a reasonable trend and then a breakout (again this was confirmed by the RSI, that failure swing once more). Since then it is clear that the SP is in a much steeper channel and thus far is maintaining that channel. This particualr screenshot has compressed the chart somewhat, so it doesn't look that steep, but actually it is. As Cynic says, it needs to at least consolidate sometime if not retrace, problem is determining when it will stop and where support lies. The RSI would seem to set a cap on the move, the upslopey trendline and the horizontal line should both act as resistance and taking today's move into consideration it would appear that this might just be it for now. That isn't to say it WILL retrace, but that the price action will take a breather. The retracement will occur if the RSI support line is broken. If there is a retracement I see support at 240p+, this is the top of the previous shallower channel. If that doesn't hold then there is (although not drawn) a mid line to this particualr channel which would offer support at 220p+. If it were to falll that far I daresay the 50MA would be about in the same place by then and provide additional support.
pth
cynic
- 11 Jul 2007 16:11
- 20 of 504
#2 - i agree
#3 - everyone knows history is bunkum!
#1 - this was such a significant occurence, that i do not think it can be discounted
therefore Murphy's Law supercedes Murphy's Technical Analysis in this specific .... lol!
#3 - everyone knows history is bunkum!
#1 - this was such a significant occurence, that i do not think it can be discounted
therefore Murphy's Law supercedes Murphy's Technical Analysis in this specific .... lol!
ptholden
- 11 Jul 2007 16:57
- 21 of 504
Seeing that MLR is been ramped all over the chip shop by a certain poster, thought I would have a look at the chart. Problem with these tiddlers is that the price action can and is often quite erratic and somewhat dificult to discern a pattern and therefore a half decent analysis.
![<a href=]()
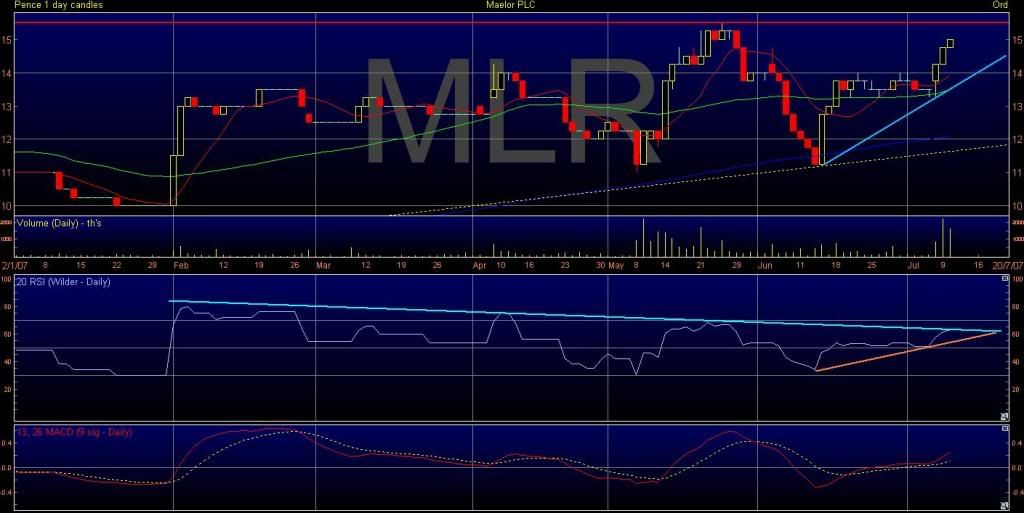
This chart doesn't include today's price action, but we know it lost 0.50p.
The chart itself shows two uptrends, the more recent quite steep and the shallower a much longer term trend, but still up. There is also longer term resistance at 15.5p (red line). Since Feb this year what can also be seen is a fairly robust downtrend on the RSI, this has capped any rise on a number of occasions, including the most recent push to break effectively through 15p. What is quite interesting is that the RSI is actually showing bearish divergence in comparison to the SP, ie the RSI has declined whilst the SP has risen, theoretically not good. What is also apparent is the bearish divergence on the MACD, again the MACD has recorded a lower high (just) at the end of May whilst the SP has risen, seemingly confirming that the rise over the last 5 months is not supported by TA.
Looking to the immediate future I don't believe that the steeper trendline on the chart is sustainable nor will the support on the RSI do any actual support. Best guess is that the SP will revert to the longer term trendline and settle at around 12p.
Having said all that I certainly wouldn't short MLR, the TA just isn't strong enough, but then I certainly wouldn't buy at the moment either. As I said in the first paragraph, these tiddlers really can shift on good or bad news and 30% moves in either direction negate TA full stop.
pth
mg
- 11 Jul 2007 17:00
- 22 of 504
pth
Here's my 5 entry fee. Actually I sneaked in earlier to take a look at this thread - came in whilst you wern't looking.
Good thread - should flush out some interesting observations - and am really looking forward to your TA - Thrush Analysis - I suspect it'll all come down to administering Canestan to help the irritating little infection :)
Haven't really spent much time on RSI - more an SMA, EMA, MACD man myself - but with SIMPLE being the basis of everything I do - even my underwear - if you know what I mean.
Bearing up under the other stuff BTW.
ptholden
- 11 Jul 2007 17:08
- 23 of 504
mg :) LoL
Good to hear you are coping with the other stuff and I do hope that continues to be the case.
Until recently I hadn't really spent much time on RSI either, but I stumbled across a website, more a web page really discussing the issue of overbought and oversold. Basically we read that it is that sort of indicator but it isn't, and the more I look at RSI on charts, I realise how useful it can be, especially when above 70 and below 30 if used correctly. I also like the MACD, particularly the divergence, although I have found by experience that aspect must not be used as a sole reference, it can lead to some ill timed trades.
Less I know about your underwear the better I think ;))
pth
David10B
- 11 Jul 2007 18:13
- 24 of 504
I must thank you for your time and consideration in posting the TA, charts and all.
Wheras I am absolutely and totally lost on these things as they are abmittedly way over my head, I put my faith in the fundamentals for my workings out.
I agree that there is a very strong resistance at 15p but I feel that we could breach this at anytime.
Once breached I believe we will see 25/30p.
I expect good results in September, I believe they are due, and from there on better.
Thank you for your most kind and considerate effort.
cynic
- 11 Jul 2007 18:52
- 25 of 504
i second what PT says about tiddlers, and much the same can be said about new issues where there is so little history and the chances of considerable churning .... nevertheless, the charts still have aplace in these stocks, though they need to be treated with even greater care than usual.
ptholden
- 11 Jul 2007 18:53
- 26 of 504
Here is yet another lesson to be learned. I have not been following the DOO story and when I posted my previous analysis the chart was fairly short term. Since I have looked at a longer term chart, now always, always look at the longer term chart.
![<a href=]()
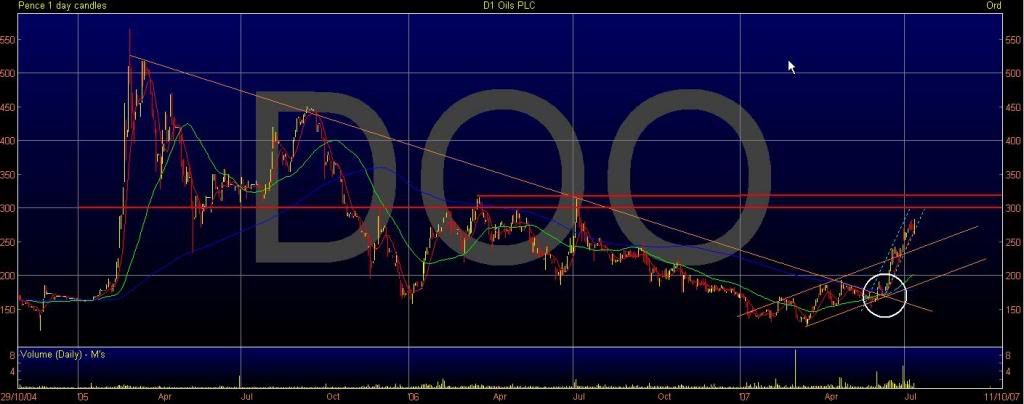
What is blindingly obvious is that at the end of June DOO broke out of a downtrend from early 2005, not only that it, clasically retraced using the previous downtrend as support and subsequently a platform for a considerable rise backed up by volume and the RSI. Often breakouts from long term trends can be rather explosive. What is also now apparent is that resistance is at 300p and then 325p. Also note that DOO has on a quite regular basis moved rather quickly.
pth
maggiebt4
- 11 Jul 2007 20:06
- 27 of 504
Thanks PTH for all the work. This is a great thread am trying to learn about TA and find this easier than any books.
ptholden
- 11 Jul 2007 20:12
- 28 of 504
maggie, pleased you are finding some benefit, hope you can make a few bob at the same time, don't be afraid to ask questions or even post your own thoughts, we are all quite friendly really :))
cynic
- 11 Jul 2007 20:56
- 29 of 504
DOO - for entirely different or even wrong reasons, i also concluded that 300 would be a (very stubborn) resistance .... had not got as far as 325! ...... anyway, i think there may well be at least consolidation before that time and i was more than happy to bank my profit at 280 (110p is not to be sneezed at!) rather than try to squeeze the last drop .... have yet to work out at what level i would be tempted to buy back in ...... 230/235 for sure as that is where sp currently hits (rising) 25 dma, but maybe higher than that
cynic
- 11 Jul 2007 21:05
- 30 of 504
"By the way," he said chortling, "that call to buy Dow this morning was good too, albeit that had I waited an hour could have cleared and extra 50 points. Still, +50 clear points on th day will do very nicely thank you and shall keep holding to 13685."
ptholden
- 11 Jul 2007 21:06
- 31 of 504
Sefton Resources
Sorry to say that the SER dawg is one of my own stocks and thought I had better try and find something positive to say.
Since the spike in September (when I should have sold, hindsight is a wonderfull thing) the stock has been in a downtrend although there were signs of life in April. However having bounced off support at around 4p on a few ocassions perhaps this downtrend is about to be broken.
Positive signs are:
MACD is slowly moving up, but yet to achieve a centreline crossover.
The first (1) RSI downtrend from Apr was broken as was a subsequent downtrend (2).
The RSI is currently in an uptrend.
Having followed SER I do know that the decline has been entirely due to a lack of progress in developing their already two producing oilfields and also lack of progress in securing a JV partner for their Coal Bed Methane (CBM) fields in Kansas. At the recent AGM (a few days ago) SER announced that finance will shortly be available to finance further drilling in their two fields, thus increasing production. Other progress was aslo announced. Based on anticipated news flow and the slightly more positive TA, I think that SER rates as a buy above 4p.
But, remember as a holder I am slightly biased so DYOR etc.
pth
cynic
- 11 Jul 2007 21:12
- 32 of 504
SER .... so here's my basic analysis ...... chart below shows that though sp has decidedly pierced 25 dma, it has promptly fallen foul fo 200 dma, a much more potent resistance.

cynic
- 12 Jul 2007 11:10
- 33 of 504
SER ..... as an aside, will be interesting to see whether or not sp can now pierce that 200 dma level
SCHE ..... PT - i post the chart below ...... though rsi has only (ever) fallen to 40, would you not concur that if sp rises through 50+25 dma with some impetus, which will inevitably drag up the rsi, then BUY is indicated?

red = 25dma
grenn = 50 dma
SCHE ..... PT - i post the chart below ...... though rsi has only (ever) fallen to 40, would you not concur that if sp rises through 50+25 dma with some impetus, which will inevitably drag up the rsi, then BUY is indicated?
red = 25dma
grenn = 50 dma
ptholden
- 12 Jul 2007 11:19
- 34 of 504
Good morning Mr Richard, will have a look at a longer term chart and post in a little while. Initial thoughts though make me think that following a substantial rise the SP may be cooling off somewhat and perhaps taking a breather?
ptholden
- 12 Jul 2007 11:27
- 35 of 504
Incidentally TAN managed to stay in its steeper channel over the last two days (just) and is now having another go at 200p.
ptholden
- 12 Jul 2007 11:48
- 36 of 504
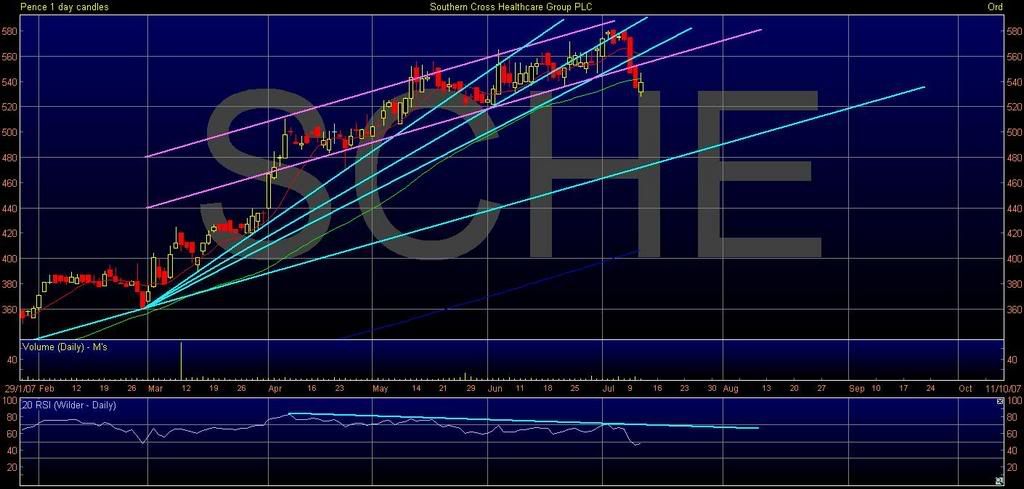
Must say I don't like the look of this chart. I have drawn a series of trendlines to try and determine support. But as you can see the steepest was good for a while but then acted as resistance once the support failed; same can be said for the next and the third was only good for a while. If the SP does recover I would expect this third trendline to comply with theory and also act as resistance. I have also drawn a channel, from which the SP has fallen out of the bottom, the lower line of the channel may also act as resistance to any recovery. The fourth and shallower trendline is a long term, well since Dec last year and I suspect this is where the SP is heading, there just isn't anything else from a trend perspective. Having said that there is support at 520p and perhaps this may check the recent fall, but having dropped through the 50MA this will also act as resistance if it does try to make a recovery. Another aspect I don't like are the two recent bearish candles, they really are quite emphatic. You can also see that the RSI is in a downtrend and any recovery will probably be capped by that downtrend line.
There is an awful lot of resistance in this analysis so all in all I don't see any reason to buy SCHE right now from a TA perspective, actually, it might be quite a good short albeit from a slightly higher position if possible.
Sorry Richard.
pth
| About MoneyAM | Ts and Cs | Privacy Policy | Investment Warning | Content Standards | Corporate Solutions | Advertise With Us | Site Map | © 2026 MoneyAM |
Register now for FREE
Share Prices,
Stock Quotes,
Charts, Bulletin Boards, Indices, Watchlists, Portfolio, Market News, Research
or see our Premium Services including Level 2, Terminal and much more.