
| Home | Log In | Register | Our Services | My Account | Contact | Help |
You are NOT currently logged in
Davai - 18 Apr 2012 11:13


Thread designed to record set-ups and targets on index and FX pairs.
'A market is only your enemy until you understand it, then it becomes your best friend.'
Any questions, please feel free to ask.
From time to time i may openly state an opinion regarding direction of a set-up and wish to add that in no way am i recommending a trade. I am sometimes only in trades for a matter of minutes and can't always update as to entry/exits taken.
As always, markets are dangerous places to be and must be respected as such. Always use stop losses and never over-leverage; 3% of your pot as a maximum per trade. As always, YOU are responsible for your own trades! Happy pip hunting!
Click HERE to visit me at FXtechnicals.net
Davai - 03 Jan 2013 14:09 - 182 of 423
Bit of fun with the Dow, needs more evidence yet, but the way it respected the 61.8% & 38.2% fib levels on the recent pullback, looks ominously like ('A' & 'C' corrective waves);
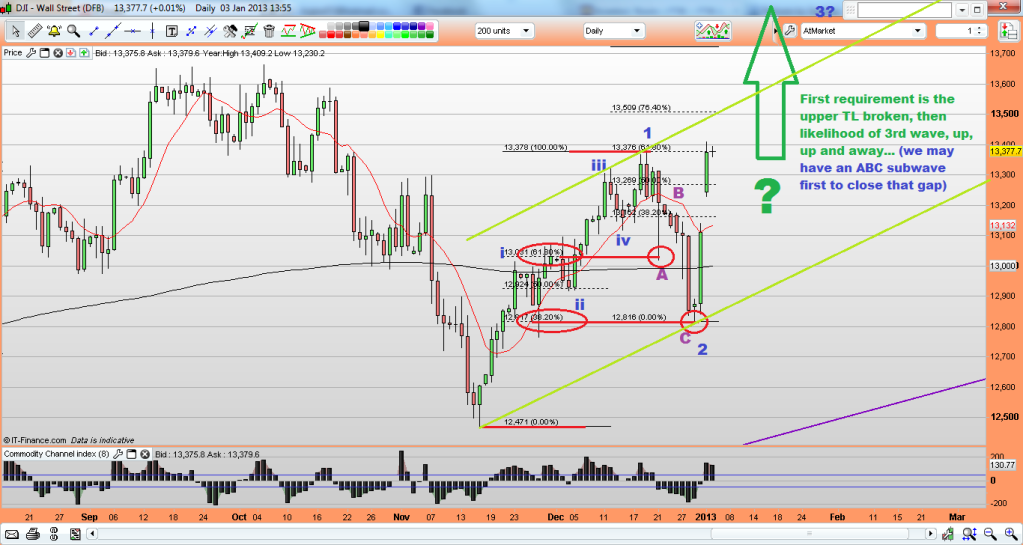
Remember we have a couple of months yet before the 'Fiscal Cliff and debt ceiling prob's will resurface, so it's certainly a possibility... still lots of shorters around to fuel the rally...

Remember we have a couple of months yet before the 'Fiscal Cliff and debt ceiling prob's will resurface, so it's certainly a possibility... still lots of shorters around to fuel the rally...
Davai - 03 Jan 2013 20:12 - 183 of 423
Ok, so i've mentioned having an overall trading plan, but that i trade on smaller timescales. Here is an example;
Post 181, earlier this afternoon contained this chart;
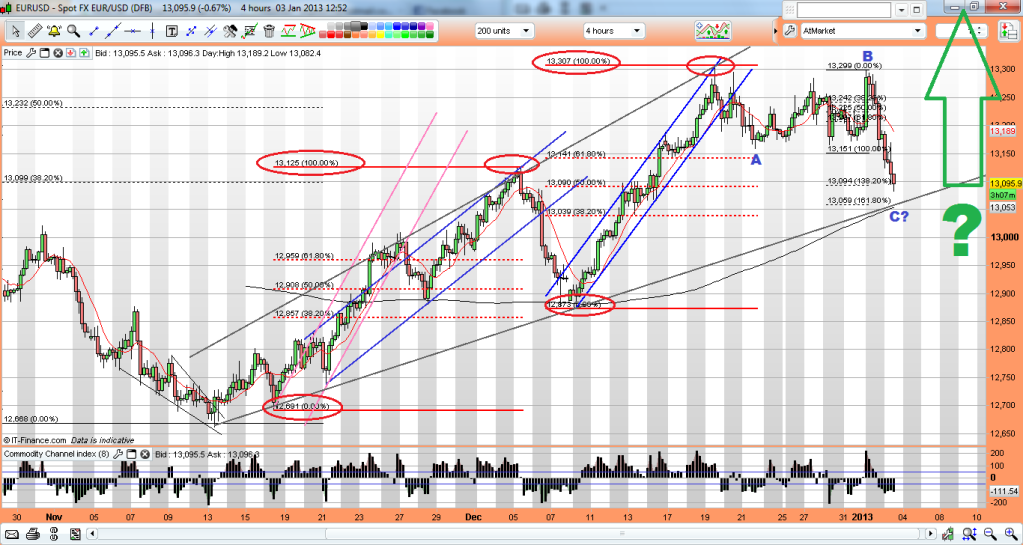
Its the 4hr Euro showing the fibs of wave A replicated to wave C. I also have a trendline (in grey) meeting the common 161.8% extension at approx 13,060, so this was a valid target.
Now looking closer at the C wave, i have my Elliott channel lines and fib extensions drawn in. I also have a 61.8% extension at the 13.060 level. Add to this that the PA this afternoon (purple circle) looked decidedly corrective, it started to look even more like a certainty...

Here i have zoomed into that area to further explain;

I couldn't label it any other way than to be corrective and breaking down the subwaves, it was possible to have confidence in entering short near the top of the 'C' wave. With the channel lines in place, the stop point was just above the top TL (nothing is set in stone!).
However, shorting at 13,115, stop at 13,140 and target of 13,062, was both high probability and also good R:R.
An earlier flag system trade also gave a lower target of 13,046.
The Euro has certainly been weak the last couple of days and i'm struggling to label the wave count right now. Being able to determine corrective pullbacks whilst within the channel lines is all that is really necessary. When the top TL gets broken, its time to stop shorting! I have no idea right now if the grey TL will provide support or if the 61.8% level (mentioned above will provide the bounce). This is why i wouldn't advocate just going long at an area that you perceive to be a target. Better to gather evidence first. A trade requires planning, so its either short the next pullback if corrective, or if not, the impulsive 5w advance should breach a prior 'reflex' point to confirm trend change...
Davai - 06 Jan 2013 12:49 - 184 of 423
Couple of updates;
The Euro went further in its channel to its 200% level of 'A' which co-incided with 13,000. Like i said earlier, stay short until it breaks out of the channel. We get a nice CCI trigger at the same time;

The Audi also bounced off of its 261.8% level for 'C' ending with a nice flag trade too;

Update;

Davai - 07 Jan 2013 10:25 - 185 of 423
Been looking at the best pair to get positioned long this morning. The picture does appear to be long almost everything, but of course that doesn't mean take any old position. Patience is still required so as to get a low risk entry. The EurJpy looked to be the pick of the bunch;

It appears to have the 5w up after breaking out of the corrective down channel last week, followed by a nice ABC back down overnight/this morning. The A&C waves respecting Fib levels along with the minor 5th of the 'C' hitting its 61.8% simultaneously. I missed going long right there, so waited for another minor 5w up, abc back and went long on a fresh high treating it as a 123 reversal. Stop is below the indicated point 'C' so quite low risk, but not as ideal as going long off of the Fib level itself with a typical 10 pip stop. Lets see what happens. I'm evidence gathering right now and only have an initial small position, i want to get heavily long if possible. A flag trade would be nice, failing that it looks like it will take out the prior 4th and then retrace yet again. If i can follow it on a small timescale and determine another abc, we should really be able to have confidence in this trade....

It appears to have the 5w up after breaking out of the corrective down channel last week, followed by a nice ABC back down overnight/this morning. The A&C waves respecting Fib levels along with the minor 5th of the 'C' hitting its 61.8% simultaneously. I missed going long right there, so waited for another minor 5w up, abc back and went long on a fresh high treating it as a 123 reversal. Stop is below the indicated point 'C' so quite low risk, but not as ideal as going long off of the Fib level itself with a typical 10 pip stop. Lets see what happens. I'm evidence gathering right now and only have an initial small position, i want to get heavily long if possible. A flag trade would be nice, failing that it looks like it will take out the prior 4th and then retrace yet again. If i can follow it on a small timescale and determine another abc, we should really be able to have confidence in this trade....
Davai - 07 Jan 2013 10:32 - 186 of 423
The point about EW is not that it is some miracle way of trading. Having only one count in mind is dangerous and will undoubtedly lead to failure. Its a case of adjusting to the PA as it unfolds. I am using this thread as a diary. My thoughts change consistently as various points get breached and its difficult to record every change in my thought process. Right now i am biased long on the Euro, the Yen pairs, the Audi, Kiwi, markets.... yep just about everything... that is a dangerous thought and i'm still mindful of deep corrective moves, so discipline remains key. Placing a trade and hoping is pointless as is not having confidence behind your trade. I am looking for a flag trade because i have a system which gives very very high probability if triggered correctly, its these trades that breed the confidence to stake heavily and make a real difference.... Right back to the screens...
Davai - 08 Jan 2013 12:16 - 187 of 423
Euro;

Breaking down the ABC;

If so, some very deep 4th waves. (subwave 'iv' & 4 itself) of 'C' retracing to the absolute max within the rules, ie, to within a pip of their respective wave 1's.
This is possibly only the abc of 'A' as its quite short, so 'B' & 'C' to follow, (of which 'B' might have completed.
We have a flag trade setting up above which should only trigger when the full ABC is complete, lets see...
Davai - 08 Jan 2013 16:11 - 188 of 423
EurUsd 'C' wave extending. EurJpy count has changed. This looks most likely;

Everything fits, so need the 4th wave (of 'C') at some stage. I've circled a bounce off of the 161.8% level, but it might just be a reaction. Lower to come as a 5w move, i think is for certain.

Everything fits, so need the 4th wave (of 'C') at some stage. I've circled a bounce off of the 161.8% level, but it might just be a reaction. Lower to come as a 5w move, i think is for certain.
Davai - 08 Jan 2013 16:31 - 189 of 423
Similar on the GbpJpy pair. No sign of a 4th yet, surely it means lower to come? Maybe a bounce now off of the 100% of 'A' level...


Davai - 09 Jan 2013 08:32 - 190 of 423
Lost a bit yesterday through my mistake. Really annoyed with myself, because i never liked the look of trying to label the full ABC in one single down channel in the first place. I think i was influenced by the EurUsd's action, which had already printed A&B. Reminder to oneself, never underestimate what separate pairs (but sharing one common currency) can do in regards to variation...
I was calling an end to the ABC whilst 'C' was still to come. The rather less obvious 'B' wave was the culprit here, ending with an expanding diagonal which didn't make a further high.
Post 188;
Anyway, my 4th&5th to come call was good and i clawed some back overnight. More satisfying perhaps is that i set my limit at the 38.2% of my 5th wave projection which coincided with a flag trade target. It hit with just a couple pips spare before reversing, whilst i was in the land of nod. That is EW at its very best;
Update;

Notice the reversal after the flag trade target was met. This is very common. Combined with a common Fib target, it can be deadly accurate.
No point updating the GbpJpy as it was a similar story, although it didn't extend. So wave 'C' was 100% of 'A'. With all this looking like it certainly was ABC corrective on both Yen pairs and the thinking is that they have both ended, we look for a way to get long. Plenty of time yet to get that low risk entry. They have both sprinted off the line overnight, but we need to get our wave 2 established next. Then together with some channel lines, we should be able to hit the longside heavily over the coming days...
Davai - 09 Jan 2013 16:16 - 191 of 423
Reckon we may have a bit of downside imminent on the Index's. Looks like an 'Irregular' B wave (poss a tad higher first) and corrective 'C' to follow. It could be shallow and i've circled a likely target area, but of course, occasionally we have a deadly 'C' wave, so a bigger sell off is certainly a possibility. The reason i say this is because i am mindful of the gap on the Dow chart that i mentioned in an earlier post which still needs filling. I think (from memory) it was around 13,140ish;


Davai - 09 Jan 2013 16:39 - 192 of 423
The above all depends on the ABC count being correct. It looks like the move up started with a 3w move (3-3-5) therefore merely the 'B' of a corrective move and as i've stated above, but i wouldn't stake my house on it. If it moves up sharply from here instead, we are in the 3rd wave and you don't want to be trying to short it. A minor 5w down and 3w back should give the evidence needed and hopefully a flag trade, (not that i trade index's, but i know most others here do). I will try to keep an eye on it to update if poss...
Davai - 10 Jan 2013 08:12 - 193 of 423
I don't generally read news articles, or listen to analysts etc. My trading is purely technical and i believe the market has its own agenda. There is scope within wave structure to extend or shorten, but how often do you see bad news and expect a market to react badly only to watch in bewilderment as it seemingly gets interpreted differently and it goes up instead. My case in point.
That said, i had an email this morning from something i must have registered with some time agonand decided to read an article. Some interesting reading and lots i could relate too.
http://www.dailyfx.com/forex/fundamental/article/special_report/2012/12/24/forex_education_top_mistakes_of_2012.html
The part about reducing your flexibility or thinking after you have publicly stated or printed a chart/analysis rings true for me. I try to use this as a diary and occasionally look back at charts from 3/6 months ago... its astonishing how many mistakes i can see that i used to do... surely that has to mean progress?!
I'm still making many mistakes on a regular basis, despite having a system that is successful probably 75% of the time! Why don't i just concentrate on that? Well, it takes massive discipline because whilst i'm waiting for a set-up, other stuff keeps happening that i think i recognise. Again, trying to get in before and thus predict a 3rd wave is costing me dearly and time i leave it alone to concentrate on my 4th/5th system me thinks... Patience and discipline Dav....
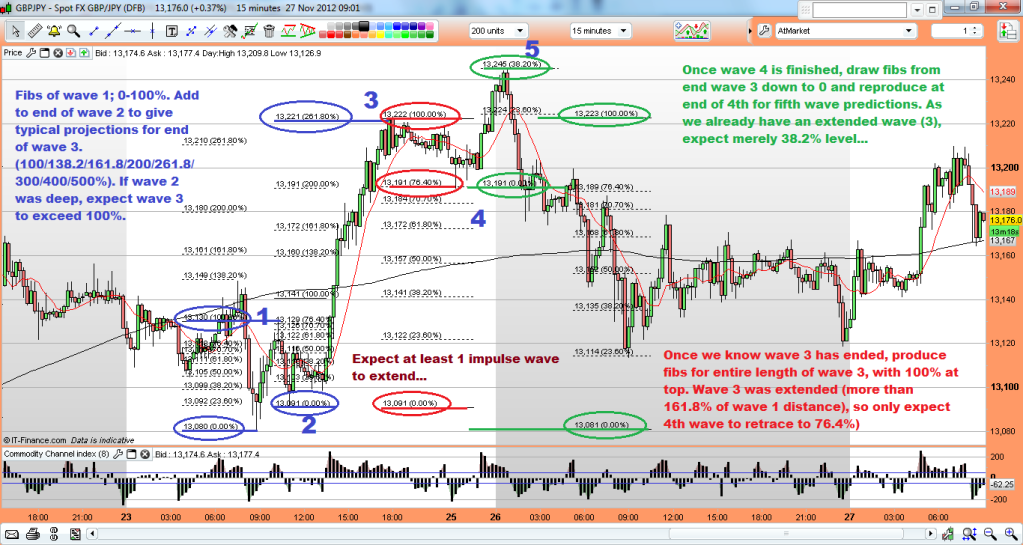
Davai - 10 Jan 2013 11:17 - 194 of 423
Right then, back on track, a small loss overnight on a UsdJpy short, trying to pick a wave 2 retrace again, has been replaced with a winning Euro long trade this morning. It turns out it should have been a far bigger winner, had i spent just a little more time researching, hey ho...

We have a 5w move short, followed by the ABC corrective move, at least that's how it looks. I actually merely noticed just the 3w 'A' followed by the similar 3w 'B', which started around 15:00GMT yesterday afternoon. Early this morning, we get a nice easy to read 1&2 waves, followed by a sharp rise.
I have ten charts open on 15min timescales on monitors in front of me. A quick scan every now and then is all it takes to recognise a 3rd wave in process. Once identified, i can open the chart on the main screen to do a little research behind the move. Its literally impossible to keep tabs on so many pairs and keep an opinion as to what phase they are likely in, so this is what works best for me. This is the key to the system. Ignore everything else, just look for a string of red or green candles together moving rapidly and its most likely to be a 3rd wave of some degree...
Run the fibs and channel lines, then hope it doesn't get too far extended. If it doesn't we can look for a likely 4th wave pullback. If it looks likely to retrace to either the 61.8% level (sorry that means if it retraces 38.2% of wave 3) or the 50% level and coincide with the support of the upper channel line drawn off of waves 1&2, you're good to go. Discipline is required to ensure it meets at least some of this criteria... the more the better. Go with original direction, stop is a couple of pips within wave 1 territory. Draw fibs for likely target for end of wave 5 and poss channel line confluence. Et voila. More detailed chart to follow...
Davai - 10 Jan 2013 11:42 - 195 of 423

Now firstly, i want to point out, the labeling looks to be incorrect now. I doubt it was an extended fifth, rather that the pullback earlier was a subwave 1&2 of the whole 3rd. I have left it as i saw it at the time and i was very lucky that, if it was indeed just a subwave, that it didn't go deeper and stop me out. If it wasn't the 4th it didn't have to obey the crossover rule, so could have easily cost me. There is little to do about this risk. The price corrected cleanly off of the 223.6% projection of wave 1, not one of my faves to be fair, but it was to the pip and led me to believe it was indeed starting the 4th.
I also bottled it a little early, keen to make up for my overnight loss and banked before my circled target of the 61.8% projection coupled with the upper blue channel line. Its a bad trait, but one i'm sure anyone reading this can sympathise with. I was glad to register another winner, but had i left it just three minutes longer, i would have seen the strength of the rise and possibly ran it a little longer. Hey ho, i do like to leave a little for the next man... but not that much!
It was only then that i realised the 5w count as highlighted in the previous post and saw that it needed to correct the whole of this move. I was watching elsewhere yesterday and had lost my foothold on the Euro somewhat.
Davai - 10 Jan 2013 11:49 - 196 of 423
You can perhaps also see why its easy to stray from the trading plan. If i'm so sure it is purely corrective, why don't i just go short the Euro now?!
Maybe with a bit more experience i will work out when it is right to do so, but the variations available to the market make it very difficult to be certain. Over-trading almost always creeps in.
As it is i want to concentrate on the 4th/5th trades and maybe limit trying a wave 1/2 trade to every now and then.
*Edit* somehow the apparent 3w move up was wrong... hindsight shows us it has to be impulsive and thus a 5w move. Utterly ridiculous, but again, that's probably why i should just stick to the system. It also means it wasn't a 5w move short and a larger ABC itself. Nobody said this was easy. Nice move this afternoon.
Davai - 10 Jan 2013 14:50 - 197 of 423
Right, lets keep in mind the bigger picture. Previously posted, i was expecting the ABC (as an 'X' wave), and then higher to come. The market successfully shook me out of being prepared for the move. Once again, it uses the boredom/stealth combo.
Malodyets mr.Market.
Post 181
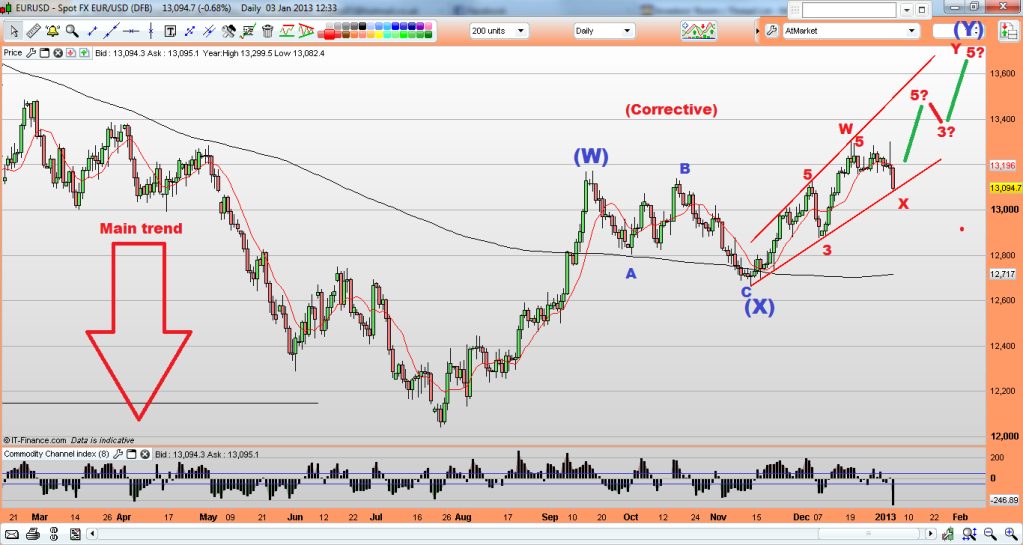
smaller scale (showing X wave to be a WXY move) and subsequent breakout;
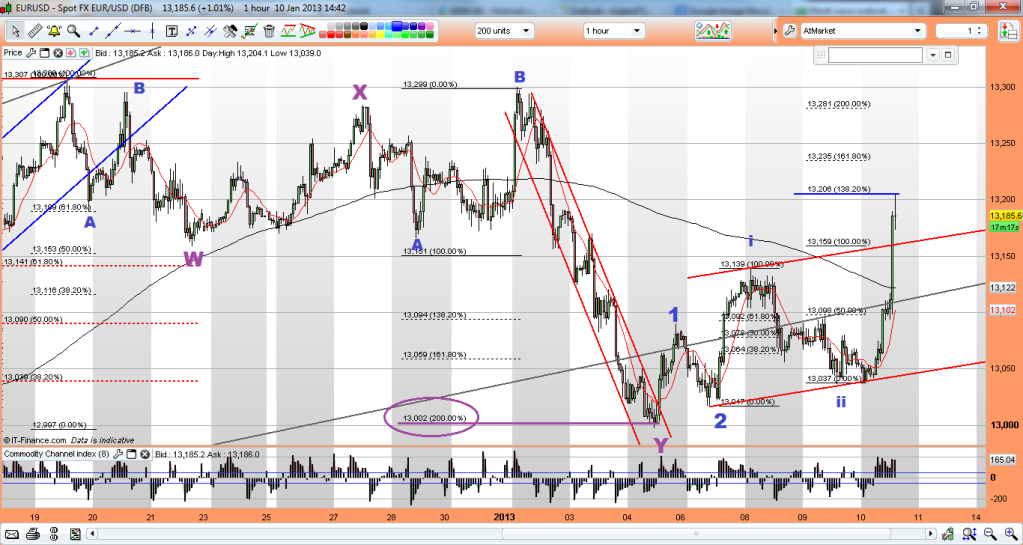
I've been saying for several days now, time to look long on the Euro pairs. Need to get the acceleration channel sorted, to be able to judge pullbacks...
Malodyets mr.Market.
Post 181

smaller scale (showing X wave to be a WXY move) and subsequent breakout;

I've been saying for several days now, time to look long on the Euro pairs. Need to get the acceleration channel sorted, to be able to judge pullbacks...
Davai - 10 Jan 2013 15:06 - 198 of 423
Hmmm post 183. The ABC ('X' wave) is broken down to the above WXY move;
Davai - 10 Jan 2013 16:05 - 199 of 423
Having missed todays fun, i find myself now with the puzzle of that 3 wave move up yesterday afternoon (15:00), it does point to this being corrective, within our recent downtrend. Could we be in a larger 'X' wave? I wont be joining in the fun just yet until i can work this out. To be fair, that is the safety of the system i described earlier. I simply don't think trying to hold for the bigger moves is for me. Most people concentrate on number of pips bagged. For me its all about percentages. You can make the same money (and have similar risk) with a target of 100 pips or just 10. I would rather miss a whole load of PA in order to be able to trade confidently in a direction for just a small distance. Anyway, this is whats worrying me... as i said... that 3w move makes me now think that this move this afternoon is corrective;

I will be the first to acknowledge that i have covered both directions and thus my point... Ok, i have missed this rise, but all i want is to recognise 3rd waves on much smaller scales!

I will be the first to acknowledge that i have covered both directions and thus my point... Ok, i have missed this rise, but all i want is to recognise 3rd waves on much smaller scales!
Davai - 10 Jan 2013 17:01 - 200 of 423
Possibility, but i think wave C was def in 5... so not so keen...


Davai - 10 Jan 2013 20:30 - 201 of 423
Ok, gonna put this out there and make it obvious that this view could change with further PA, however, Euro; here is why i think that's your lot (or thereabouts) for upside (for now) Earlier i expressed problem with the upswing starting with a 3w move, this move therefore is 'C' of a further X wave (imo). I also think that Cable has only completed one leg down so far and thus needs to do another set;

and the euro wont diverge massively in the opposite direction to Cable, so it backs up my X wave call. Maybe dollar strength will be back for a short blast? Little bout of risk off for a mo? Ok, well, bear in mind this is just an overall plan, so lets see if we can validate it.


and the euro wont diverge massively in the opposite direction to Cable, so it backs up my X wave call. Maybe dollar strength will be back for a short blast? Little bout of risk off for a mo? Ok, well, bear in mind this is just an overall plan, so lets see if we can validate it.

| About MoneyAM | Ts and Cs | Privacy Policy | Investment Warning | Content Standards | Corporate Solutions | Advertise With Us | Site Map | © 2026 MoneyAM |
Register now for FREE
Share Prices,
Stock Quotes,
Charts, Bulletin Boards, Indices, Watchlists, Portfolio, Market News, Research
or see our Premium Services including Level 2, Terminal and much more.