
| Home | Log In | Register | Our Services | My Account | Contact | Help |
You are NOT currently logged in
Register now or login to post to this thread.
Davai - 18 Apr 2012 11:13


Thread designed to record set-ups and targets on index and FX pairs.
'A market is only your enemy until you understand it, then it becomes your best friend.'
Any questions, please feel free to ask.
From time to time i may openly state an opinion regarding direction of a set-up and wish to add that in no way am i recommending a trade. I am sometimes only in trades for a matter of minutes and can't always update as to entry/exits taken.
As always, markets are dangerous places to be and must be respected as such. Always use stop losses and never over-leverage; 3% of your pot as a maximum per trade. As always, YOU are responsible for your own trades! Happy pip hunting!
Click HERE to visit me at FXtechnicals.net
Davai - 15 Jan 2013 20:03 - 218 of 423
The concern about the bounce off of that fib level is that it was the target for the end of a 4th wave... I seriously can't count the A&B at the start of the move as a 1&2, but could it really be? If so, we have just finished the ABC 4th and are good to go higher for our 5th... hmmmm, this is why i need to see that last HL breached first (reflex point)... otherwise, trend is still up.


Davai - 15 Jan 2013 20:22 - 219 of 423
I must re-iterate... i cannot make that a wave 1, it simply has to be a 3-3-5 abc (A) as per other charts. That last HL must be breached.
Davai - 15 Jan 2013 20:55 - 220 of 423
Ok, little more work and this is a real possibility. A truncated 5th of the previous X wave.
Certainly would be foolish to rule out that we have just finished wave 4. I will be looking ofr a flagtrade long to trigger tomorrow if so...

Certainly would be foolish to rule out that we have just finished wave 4. I will be looking ofr a flagtrade long to trigger tomorrow if so...

Davai - 15 Jan 2013 20:57 - 221 of 423
If so, it will also mean possibly as much as 200 pips to come north on the Euro by middle of the day Thursday;


Davai - 16 Jan 2013 08:18 - 222 of 423
Still not particularly happy with the prev truncated 5th chart, so will be happy to be proved wrong. That means i expect the prior short scenario... anyway...
Trading complex corrections is certainly a difficult task. For me, the only cycle worth attempting is 'C' waves because we know they will be in 5. If something is unreadable, look for another.
Here is a possibility i have noticed this morning on the Kiwi. Fibs indicate we have just seen an A&B wave, so 5 down to come?

*Edit* looks like an irregular 'B' after the minor 5w to start.
Davai - 16 Jan 2013 08:42 - 223 of 423
A closer look at that irregular 'B' from above;

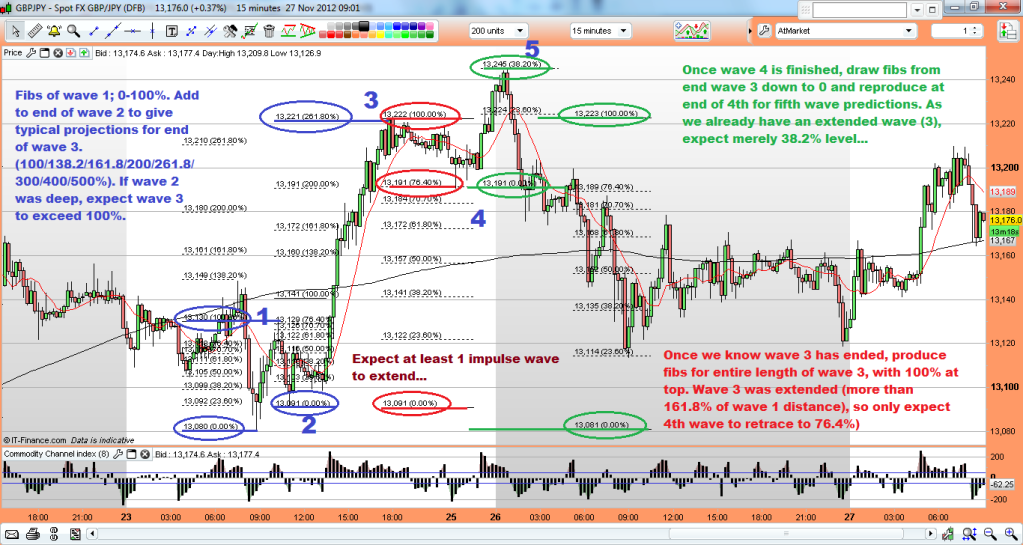
An irregular 'B' wave often leads to a following extended wave, so expect wave 3 to be longer than 161.8% of wave 1.

An irregular 'B' wave often leads to a following extended wave, so expect wave 3 to be longer than 161.8% of wave 1.
Davai - 17 Jan 2013 08:21 - 224 of 423
EurJpy to have a down day?
Possibility of a zigzag 4th (overall daily) with target of 11,230ish area;

and on hourly;

Not many fib levels lining up though, so word of caution. It could still morph into something else. (
Still i have flaglines on both this pair and the GbpJpy, so hopefully get confirmation this way...
In any case, anything corrective, the only wave to trade is a 'C'. There are simply far too many possibilities for an A&B, so wave structure is by far the most important feature to watch for.
Davai - 17 Jan 2013 09:16 - 225 of 423
Ok, so i better post the other scenario to cover my own ass!
Back to original thinking as a 3-3-5 ABC, of which we are in (minor 'c') of 'B';

Back to original thinking as a 3-3-5 ABC, of which we are in (minor 'c') of 'B';

Davai - 17 Jan 2013 10:38 - 226 of 423
Ok so after this mornings PA, we have confirmation it wasn't as i first stated (a 5w 'A' of a zigzag). A couple of possibilities;

Slim chance of it becoming an irregular with a fresh high, but unlikely looking at minor wave 'c's current action.
Also poss;


Slim chance of it becoming an irregular with a fresh high, but unlikely looking at minor wave 'c's current action.
Also poss;

Davai - 17 Jan 2013 11:02 - 227 of 423
Important to always be sceptical of labeling a 4th wave after it has travelled further than 38.2% of prior wave 3. Especially after 50%, it will usually become a 'B' or an 'X'.
Case in point this morning. No trade was placed, but now we have a little more clarity.
I am now looking for a low risk entry short on the EU and EJ. When i say 'low risk', i mean i won't freestyle short. We need a stop placement first, so we wait for a minor 5w down/3back (wave 1&2 of the following 'C'). Stop above the high.
Then i hope to get a flagline off of the point of 1 and minor 'b' of wave 2, once broken we can short with confidence. I will post a chart if it materialises.
Davai - 17 Jan 2013 11:12 - 228 of 423
Earlier;
Update;

Update;

Davai - 17 Jan 2013 12:14 - 229 of 423
Guess where the 200% projection of 'a' gets us? Double top anyone?


Davai - 17 Jan 2013 12:53 - 230 of 423

Davai - 17 Jan 2013 13:44 - 231 of 423
Ok, so wave 3 = 261.8% of wave 1, so more likely;


Davai - 17 Jan 2013 15:28 - 232 of 423
Really difficult to determine...
The choices;

where wave 'B' has finished. This has wave 3 reaching 200% of wave 1, but a tiny wave 4 which i don't like. Or;

This is preferred. We have just had a def 5w short move, but was it a fresh wave 1 (of the larger 'C')? or was it 'c' of the 4th?
The choices;

where wave 'B' has finished. This has wave 3 reaching 200% of wave 1, but a tiny wave 4 which i don't like. Or;

This is preferred. We have just had a def 5w short move, but was it a fresh wave 1 (of the larger 'C')? or was it 'c' of the 4th?
Davai - 17 Jan 2013 15:29 - 233 of 423
Looking at it on the 1min chart and it looked corrective, but a wave c doing 361.8% of wave a???! Hmmmm enough to scare me out of the trade. Oh the market is so sly;


Davai - 17 Jan 2013 16:25 - 234 of 423
So earlier, i had my fibs for pullback of subwave iii ('iv') and it reached the 70.7% level. Usually i enter a part position here, but today, i decided to have more discipline and wait for it to hit the 61.8% level. PA looked like a really fast abc which i reckoned would just be the A wave of the corrective wave. It wasn't, it went higher without me.
Later, i am waiting for what i consider is the wave 4 proper. I have my fib levels ready. Wave 3 was extended, so often we only reach the 76.4% level. Further (as above) we have a really shallow A&B wave, so naturally i think it wont drop far. I mistook a small 5w minor for the C, coinciding with the 76.4% level and open part position. It then tanked south as you can see in the chart, i opened another part position at the 70.7% and a final one at the 61.8% level. This time it went deeper. I started to doubt with the speed it was traveling and the possibility of the alternative count where we had possibly finished wave B, that i could be wrong. I close and recognise the loss. Now it heads off up without me.
Knowing what is likely to happen sometimes isn't enough. I have been waiting all afternoon for the wave 4, to get onboard long. When it happened, it was far far deeper than i imagined and a lot swifter. Once again the market uses speed as scare tactics... works a treat. I need to be more mechanical. To lose money going long on the Eu today is mental when you look at the rise. Poor trading and i'm disappointed with myself.
Davai - 18 Jan 2013 08:23 - 235 of 423
Ending diagonals, flavour of the day?
Yesterday;
Today;

Yesterday;
Today;

Davai - 18 Jan 2013 08:44 - 236 of 423
Or simpler;


Davai - 18 Jan 2013 11:13 - 237 of 423
Above but on the 5min;


| About MoneyAM | Ts and Cs | Privacy Policy | Investment Warning | Content Standards | Corporate Solutions | Advertise With Us | Site Map | © 2026 MoneyAM |
Register now for FREE
Share Prices,
Stock Quotes,
Charts, Bulletin Boards, Indices, Watchlists, Portfolio, Market News, Research
or see our Premium Services including Level 2, Terminal and much more.