
| Home | Log In | Register | Our Services | My Account | Contact | Help |
You are NOT currently logged in
Register now or login to post to this thread.
Technical Analysis (TA)
ptholden

 - 09 Jul 2007 23:14


I often find all manner of reference to Technical Analysis whilst reading threads, questioning certain elements, asking for advice on indicators and also requesting advice on a stock and whether it's a good time to buy, sell, hold or remain indifferent. I am the first to admit that my own TA is still in its infancy, but I do spend time on expanding my knowledge (hopefully in the right direction!).
Rather than having to ask a TA question on a particular thread, perhaps this thread could be used as a forum for TA queries and become a knowledge base. Just a thought, if there is little or no interest, the thread will sink without trace and that will be the end of that. I will personally add a few snippets to help those with less knowledge (if that's possible) to keep things rolling. There is a danger that the thread will receive countless requests for opinions on a variety of stocks and there is only so much I can do alone, therefore I would more than welcome input from other posters, no matter how rudimentary they believe their own knowledge to be, hopefully some real experts will take the time to contribute.
Rather than having to ask a TA question on a particular thread, perhaps this thread could be used as a forum for TA queries and become a knowledge base. Just a thought, if there is little or no interest, the thread will sink without trace and that will be the end of that. I will personally add a few snippets to help those with less knowledge (if that's possible) to keep things rolling. There is a danger that the thread will receive countless requests for opinions on a variety of stocks and there is only so much I can do alone, therefore I would more than welcome input from other posters, no matter how rudimentary they believe their own knowledge to be, hopefully some real experts will take the time to contribute.
cynic
- 27 Jul 2007 19:17
- 233 of 504
used to look at that, but got bored with it ...... in truth, very rarely trade currency, and then only Cable though used to do or $ to Rand when we were doing a lot of biz in SA ..... the interesting Cable chart was the one my good pal did, but that is uncopyable ..... basically it's a view stretching over 20 years, but predicted, with various peaks and troughs that $ would trough(!!) at 20700 .... it never quite reached that, but was close enough for me to short - i.e. gamble on $ strengthening ...... shame i did not just stay with it, as it is now <20300 and could easily go to 20000 or even a little lower .... there should have been quite good support between 20500 and 20470, but there was scarcely a pause there
ptholden
- 27 Jul 2007 22:35
- 234 of 504
Something different tonight; I have mentioned previously I'm not a great fan of flags, pennants etc, but for a bit of interest thought I would mention the 'Cup with Handle' formation. I have to be honest though and say that it's not only interest but self-interest! The reason I have spotted this is that I do hold shares in PANR. Here's the criteria:
Cup with Handle Bullish Chart Pattern
A Cup with Handle is considered to be a bullish signal.
Description
Cups with Handles are similar in appearance to Rounded Bottoms. Like rounded bottoms, the pattern includes an elongated U-shape. However, the pattern also includes a short period of consolidation of 1-2 weeks in duration, which tends to be downtrending. The pattern is similar in appearance to a coffee cup with a right-side handle, and indicates the potential for an uptrend.
Important Characteristics
Following are important characteristic to look for in a Cup and Handle.
Shape
The cup always precedes the handle. As the cup develops, the price pattern follows a gradual bowl shape. There should be an obvious bottom to the bowl; a v-shaped turn is not a good indicator.
The depth of the cup indicates the potential for a handle and subsequent breakout to develop. The cup should be fairly shallow.
The handle tends to be down sloping, and indicates a period of consolidation. Consolidation occurs when the price seems to bounce between an upper and lower price limit. You can track the down sloping angle of the handle by drawing trendlines across the upper and lower price limits. If the price ascends outside of the trendlines, then it has the potential for breakout. If the price ascends beyond the upper, right side of the cup, then the pattern is confirmed, particularly if it is accompanied with a sharp increase in volume.
Volume
Volume tends to parallel the price pattern. Consequently, during the cup formation, as price descends, volume tends to decrease. Following a period of relative inactivity (at the bottom of the cup), the price pattern starts an upward turn and volume tends to increase.
During the handle formation, the volume decreases. However, you will notice an increase in volume when the price breaks out beyond the right side of the cup.
Duration of the Cup and Handle
Rounded Bottoms are long-term patterns. Martin J. Pring identifies that the pattern can occur over a period of about 3 weeks, but can also be observed over several years.
Trading Considerations
Duration of the Pattern
Like Rounded Bottoms, the Cup with Handle is a long-term pattern. According to O'Neil, the cup duration is between 7 to 65 weeks. According to Gregory Khun, the cup "is usually three to six months in duration but can be as long as 12 months during bear markets or as short as seven weeks during bull markets." The handle usually develops in 1-2 weeks.
Target Price
Understandably, investors like to buy at the lowest possible price. Ideally, investors would buy at the bottom of the cup formation. However, by the time the handle formation begins to develop, investors must gauge their level of risk. There is no surefire way to predict when the lowest point will occur, and there is a possibility that the pattern will fail, and breakout in a downtrend.
Some technical analysts believe that the best time to buy is after the handle begins to ascend. According to Rick Martinelli and Barry Hyman, O'Neil "recommends buying stocks only as they break out of the cup-with-handle to new highs". Khun suggests a more aggressive method of buying stocks. He suggests that "experienced traders can buy in increments in anticipation of a breakout, but it's tricky."
The handle will often slope downwards initially, however, watch for the price to breakout beyond the price at the right side of the cup. The depth of the cup from the right side is an indicator for the potential price increase. However, Bulkowski notes, "Many cups fail after rising only 10% to 15%. Be sure to use stop-loss orders to limit losses or to maximize gains".
Criteria that Supports
Volume
Volume tends to parallel the price formation. During the handle formation, watch for the price and volume to increase. An increase in volume is an indication that the pattern has potential to continue the uptrend, and ascend beyond the right side of the cup.
Criteria that Refutes
V-shape
There are v-shaped patterns that yield successful returns, however, during the cup formation, watch for a rounded shape because the rounded shape provides a more reliable and predictable formation.
Down sloping handles
The handle will tend to be down sloping, however the following criteria indicate a potential failure:
The handle should not drop below the top half of the cup formation
The price should not drop below the 200 day Moving Average
And here's the chart:
![<a href=]()
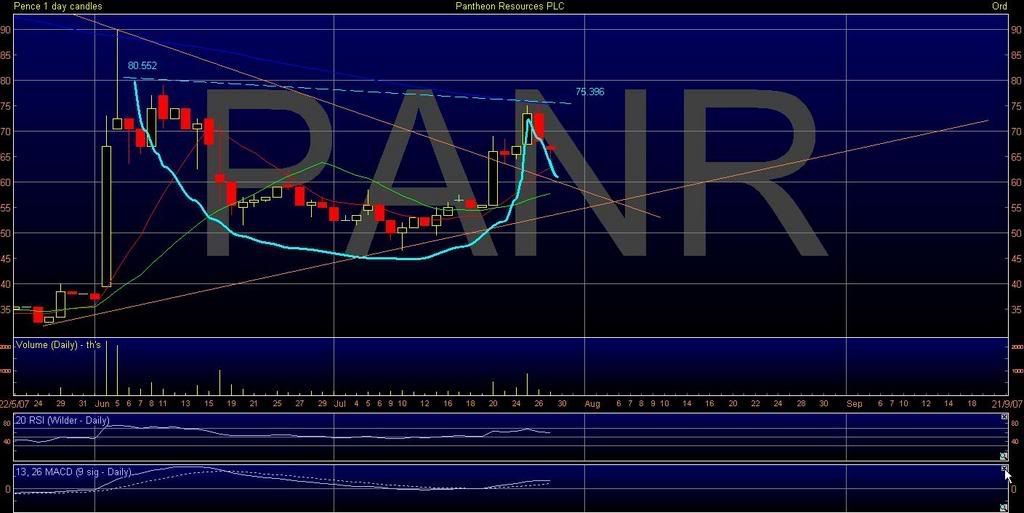
Seems to fit the criteria quite well, although the price has been below the 200MA throughout, so not too sure how applicable that is, might negate the whole thing.
The blue dashed line represents the breakout level - 75p.
I have also drawn two trendlines; the downtrend resistance is drawn from the high of last year, which the SP broke through this week and then acted as support during the first small pull back - a good sign.
Even if the formation fails there is also good support provided by the trendline drawn from May.
As always no advice intended, DYOR etc etc and I shall wish myself good luck for the next weeks or so :))
pth
Cup with Handle Bullish Chart Pattern
A Cup with Handle is considered to be a bullish signal.
Description
Cups with Handles are similar in appearance to Rounded Bottoms. Like rounded bottoms, the pattern includes an elongated U-shape. However, the pattern also includes a short period of consolidation of 1-2 weeks in duration, which tends to be downtrending. The pattern is similar in appearance to a coffee cup with a right-side handle, and indicates the potential for an uptrend.
Important Characteristics
Following are important characteristic to look for in a Cup and Handle.
Shape
The cup always precedes the handle. As the cup develops, the price pattern follows a gradual bowl shape. There should be an obvious bottom to the bowl; a v-shaped turn is not a good indicator.
The depth of the cup indicates the potential for a handle and subsequent breakout to develop. The cup should be fairly shallow.
The handle tends to be down sloping, and indicates a period of consolidation. Consolidation occurs when the price seems to bounce between an upper and lower price limit. You can track the down sloping angle of the handle by drawing trendlines across the upper and lower price limits. If the price ascends outside of the trendlines, then it has the potential for breakout. If the price ascends beyond the upper, right side of the cup, then the pattern is confirmed, particularly if it is accompanied with a sharp increase in volume.
Volume
Volume tends to parallel the price pattern. Consequently, during the cup formation, as price descends, volume tends to decrease. Following a period of relative inactivity (at the bottom of the cup), the price pattern starts an upward turn and volume tends to increase.
During the handle formation, the volume decreases. However, you will notice an increase in volume when the price breaks out beyond the right side of the cup.
Duration of the Cup and Handle
Rounded Bottoms are long-term patterns. Martin J. Pring identifies that the pattern can occur over a period of about 3 weeks, but can also be observed over several years.
Trading Considerations
Duration of the Pattern
Like Rounded Bottoms, the Cup with Handle is a long-term pattern. According to O'Neil, the cup duration is between 7 to 65 weeks. According to Gregory Khun, the cup "is usually three to six months in duration but can be as long as 12 months during bear markets or as short as seven weeks during bull markets." The handle usually develops in 1-2 weeks.
Target Price
Understandably, investors like to buy at the lowest possible price. Ideally, investors would buy at the bottom of the cup formation. However, by the time the handle formation begins to develop, investors must gauge their level of risk. There is no surefire way to predict when the lowest point will occur, and there is a possibility that the pattern will fail, and breakout in a downtrend.
Some technical analysts believe that the best time to buy is after the handle begins to ascend. According to Rick Martinelli and Barry Hyman, O'Neil "recommends buying stocks only as they break out of the cup-with-handle to new highs". Khun suggests a more aggressive method of buying stocks. He suggests that "experienced traders can buy in increments in anticipation of a breakout, but it's tricky."
The handle will often slope downwards initially, however, watch for the price to breakout beyond the price at the right side of the cup. The depth of the cup from the right side is an indicator for the potential price increase. However, Bulkowski notes, "Many cups fail after rising only 10% to 15%. Be sure to use stop-loss orders to limit losses or to maximize gains".
Criteria that Supports
Volume
Volume tends to parallel the price formation. During the handle formation, watch for the price and volume to increase. An increase in volume is an indication that the pattern has potential to continue the uptrend, and ascend beyond the right side of the cup.
Criteria that Refutes
V-shape
There are v-shaped patterns that yield successful returns, however, during the cup formation, watch for a rounded shape because the rounded shape provides a more reliable and predictable formation.
Down sloping handles
The handle will tend to be down sloping, however the following criteria indicate a potential failure:
The handle should not drop below the top half of the cup formation
The price should not drop below the 200 day Moving Average
And here's the chart:
Seems to fit the criteria quite well, although the price has been below the 200MA throughout, so not too sure how applicable that is, might negate the whole thing.
The blue dashed line represents the breakout level - 75p.
I have also drawn two trendlines; the downtrend resistance is drawn from the high of last year, which the SP broke through this week and then acted as support during the first small pull back - a good sign.
Even if the formation fails there is also good support provided by the trendline drawn from May.
As always no advice intended, DYOR etc etc and I shall wish myself good luck for the next weeks or so :))
pth
cynic
- 28 Jul 2007 09:02
- 235 of 504
it is patently obvious that i am quite a fan of charts (as a tool!!), but i sometimes fear that the more complex the chart the easier it is to make the pattern fit the sought conclusion.
over the last few weeks that PT and I have "worked" together, the most compelling charts - i.e the ones that have indeed foretold the future! - have been those where PT's (slightly) more sophisticated system has been reflected in my own charts-for-dummies conclusion - or vice versa if you wish.
certainly PT and i both concur that an sp's relationship to certain daily moving averages, in particular 50 and 200, linked to impetus are most important ...... i assume that does not need further expansion
cynic
- 28 Jul 2007 09:05
- 236 of 504
ICI - given the 3/4 page spread in today's Telegraph re the new Akzo bid, ICI will rocket on monday by about 50p ....... i haven't looked, but it would be interesting to see if the underlying chart indicates that at 577 (friday's close) the price is due for a bounce anyway.
now go to ICI thread and see how the facts will indeed bear out the theory!
now go to ICI thread and see how the facts will indeed bear out the theory!
maddoctor - 30 Jul 2007 12:50 - 237 of 504
crucial level on the ftse , any comments PT
cynic
- 30 Jul 2007 13:29
- 238 of 504
6000 is the big number to watch, which is not that far away, though i would expect at least a reasonable (technical) bounce before that is challenged
maddoctor - 30 Jul 2007 13:32 - 239 of 504
the uptrend line is sitting at 6200 and a bit but we are now well below the 200 ma so some conflict , thats why i was asking for TP,s thoughts
cynic
- 30 Jul 2007 13:33
- 240 of 504
trust me ..... 6000 still applies, and i dare say PT will confirm
chocolat
- 30 Jul 2007 13:38
- 241 of 504
I hate it when anyone says "trust me" ;)
maddoctor - 30 Jul 2007 13:39 - 242 of 504
just thinking the same thing :-)))
cynic
- 30 Jul 2007 13:44
- 243 of 504
good! ... but i'll say it again - lol! ..... TRUST ME!!
Fred1new
- 30 Jul 2007 14:15
- 244 of 504
Blair said "trust me"!.
The problem with TA is that it reflects the market, but doesn't lead it!
I use TA a lot in making B/S decisions, but in a market where sentiment is as edgy as it is at the moment would prefer to sit mainly in cash. I think I will watch others find the way out of the present turbulence.
If you like cup and saucers have a look at SPrice and volume of NIS. Almost perfect Saucer which sadly didn't come to much.
cynic
- 30 Jul 2007 14:51
- 245 of 504
my chart guru reckons that if Dow breaks down through 13255, which is pretty much where it now sits, then 12000 becomes the downside target, though of course there would be upward spikes en route
maddoctor - 30 Jul 2007 15:06 - 246 of 504
break of 13205 will send the dow to 12700-12750 where there is strong support
Greyhound - 30 Jul 2007 16:57 - 247 of 504
You may well be correct, but it shouldn't be forgotten that there are also false breaks that can fool us all and set people scampering around not knowing which direction we're heading. I remain bullish with the FTSE100 PE on a multiple of about 12.
cynic
- 30 Jul 2007 17:52
- 248 of 504
perhaps foolishly, have opened a Dow long, but only because i shall be able to monitor it carefully ..... may well close it tonight or at least set a tight(er) stop o'night
dynamix - 30 Jul 2007 18:56 - 249 of 504
hmm not a day trade I hope lol
the dow = losers index
the dow = losers index
dynamix - 30 Jul 2007 18:58 - 250 of 504
was just reading some of your "ta" posts from around the 11 July on this thread about TAN.. a classic lesson in why MAs mean shite all.. its just an indication of what has already happened...
you need forward thinking indicators not backwards..
you need forward thinking indicators not backwards..
dynamix - 30 Jul 2007 19:04 - 251 of 504
my trades for today using the method I talked to cynic about on Falkland thread.. but only a shorter term timeframe.. I also use a couple of other momentum indicators for DAX.. but commods are easy with that method..

cynic
- 30 Jul 2007 19:25
- 252 of 504
DYNA ..... looks like you called Dow wrong then doesn't it! ..... having bought at 12258 have now raised my stop to 12295 with Dow currently at 12350, so profit guaranteed ..... trust you did not short at a similar level!
as for MA's, of course they are (relatively) historic otherwise they could not be averages! ..... tealeaves tell the future and trends + momentum indicate likelihood
i am sure you are such a clever girl (or une femme d'une certain age) that 97.5% of your calls are correct, because apparently it is all so easy; in which case congrats and how come you have not become a tax exile?
| About MoneyAM | Ts and Cs | Privacy Policy | Investment Warning | Content Standards | Corporate Solutions | Advertise With Us | Site Map | © 2026 MoneyAM |
Register now for FREE
Share Prices,
Stock Quotes,
Charts, Bulletin Boards, Indices, Watchlists, Portfolio, Market News, Research
or see our Premium Services including Level 2, Terminal and much more.