
| Home | Log In | Register | Our Services | My Account | Contact | Help |
You are NOT currently logged in
Register now or login to post to this thread.
Davai - 18 Apr 2012 11:13


Thread designed to record set-ups and targets on index and FX pairs.
'A market is only your enemy until you understand it, then it becomes your best friend.'
Any questions, please feel free to ask.
From time to time i may openly state an opinion regarding direction of a set-up and wish to add that in no way am i recommending a trade. I am sometimes only in trades for a matter of minutes and can't always update as to entry/exits taken.
As always, markets are dangerous places to be and must be respected as such. Always use stop losses and never over-leverage; 3% of your pot as a maximum per trade. As always, YOU are responsible for your own trades! Happy pip hunting!
Click HERE to visit me at FXtechnicals.net
Davai - 18 Jan 2013 18:05 - 243 of 423
Also GbpJpy, looking like finishing its WXY corrective move. Incidentally it also came down to within a pip of breaking its prior reflex point;

Could be good for some upside, lets see... I'm long with stop pip below the low.

Could be good for some upside, lets see... I'm long with stop pip below the low.
Davai - 20 Jan 2013 13:47 - 244 of 423
Ok, gonna have to rely on small timescales, cos i'm now sure we need to correct downwards. The 4hr says to me that we have already had a 5-3-5 (W) move and then an 'X' wave to connect the next set (Y), of which the first move was clearly in 3, so should it not become a flat/irreg?, that would mean a bad week for the Euro ahead;


Davai - 22 Jan 2013 20:03 - 245 of 423
At last the FTSE throws up something recognisable )
I have a 4th wave abc retracing 38.2% of prior wave 3, so now in the 5th of this cycle. Fib extensions are drawn in. The 61.8% is the common target, but its not possible to predict that until the structure of this wave becomes clearer. It looks initially like a normal impulse move, but 5ths can morph into all sorts. I have also made the abc corrective a very simple zigzag, but of course it can be anything... flat/irreg/wedge etc... Lets see, but i have highlighted a target;

I have a 4th wave abc retracing 38.2% of prior wave 3, so now in the 5th of this cycle. Fib extensions are drawn in. The 61.8% is the common target, but its not possible to predict that until the structure of this wave becomes clearer. It looks initially like a normal impulse move, but 5ths can morph into all sorts. I have also made the abc corrective a very simple zigzag, but of course it can be anything... flat/irreg/wedge etc... Lets see, but i have highlighted a target;

Davai - 22 Jan 2013 20:09 - 246 of 423
Was stopped out of GbpJpy yesterday, trading complex correctives is actually not a sensible idea, the discipline req'd is substantial. Very poor results recently. Here was a slightly better one earlier;

Update;


Update;

Davai - 22 Jan 2013 20:18 - 247 of 423
FTSE;
We have just hit our head against both 6200 and the upper Elliott channel line. The wave structure doesn't look to me to be finished yet, so we might just correct back slightly first before giving it a better test tomorrow. As suggested 5th's can be difficult to determine because they can morph into ending diagonals and allow crossover between 'i' & 'iv'. Here's an example;

We have just hit our head against both 6200 and the upper Elliott channel line. The wave structure doesn't look to me to be finished yet, so we might just correct back slightly first before giving it a better test tomorrow. As suggested 5th's can be difficult to determine because they can morph into ending diagonals and allow crossover between 'i' & 'iv'. Here's an example;

Davai - 23 Jan 2013 07:47 - 248 of 423
Ok, well 61.8% ext target achieved, but not as i thought it would, (i did say that it's difficult to determine unless we can read the structure!). It's possible the 5th might be complete already, but i can't make a decent count for a 'iv', so it's more likely it has higher to come yet. Tough call tbh. The other possibility is to extend a further parallel line off of the top of the 3rd and i think this now looks likely. It also means the 5th might yet extend and reach 100% level, (or even further). Can't advise, but you have to agree that the way it reacted to the 61.8% level was canny )
Trying to predict structure at mo is impossible, but just for fun, i am showing another poss, where you can see that now the 5th of the 5th can also extend;

Trying to predict structure at mo is impossible, but just for fun, i am showing another poss, where you can see that now the 5th of the 5th can also extend;

skinny

 - 23 Jan 2013 07:58
- 249 of 423
- 23 Jan 2013 07:58
- 249 of 423


Thanks for the FTSE viewpoint.
Davai - 23 Jan 2013 08:26 - 250 of 423
You're welcome big bloke )
I am certain the 'iv' is correct, so wasn't difficult to predict the 61.8% as a min target. Fifth's can grind on up mercilessly and continue to have extended subwaves, so its difficult to call an absolute top for this cycle, but i would imagine if, it goes higher again now, it will bang its head on the upper trendline drawn off of the top of the 'iii' wave.
Ej reacting nicely to its fibs reproduced off of corrective wave A. Just bounced off of the 100% level, but i doubt it is finished yet. A few more common targets below;

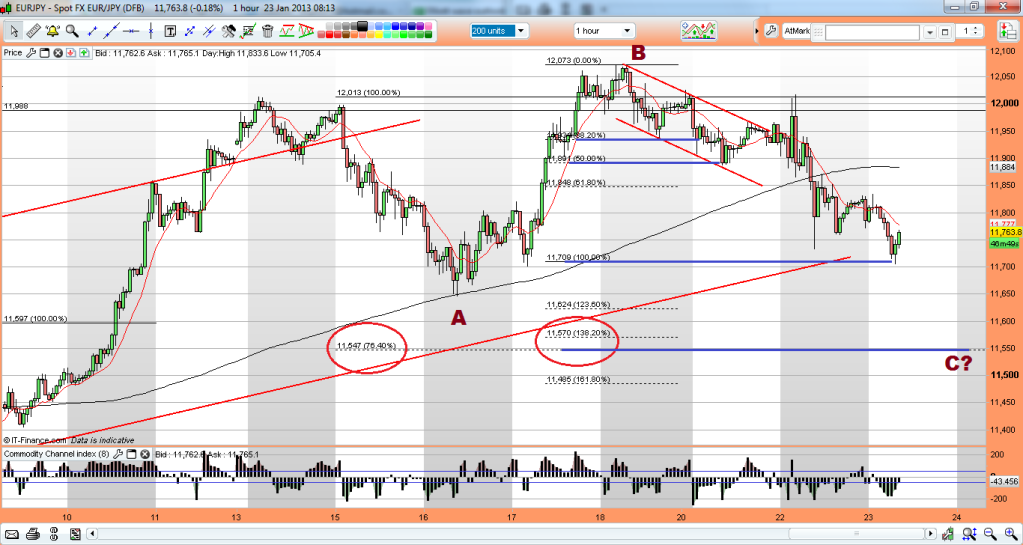
Davai - 23 Jan 2013 09:11 - 251 of 423
Remember this;
well, it seems, i was guilty of what i have been preaching elsewhere recently; the tendency to label everything impulsely. We are correcting and thus, it is a WXY move (2 sets of abc together with an 'X' wave in between). I believe we are within the 'C' of the second set now;
Fairly obviously, the converse to the 61.8% top mentioned in the chart is that we simply retraced 61.8% of the W wave for our X wave.

well, it seems, i was guilty of what i have been preaching elsewhere recently; the tendency to label everything impulsely. We are correcting and thus, it is a WXY move (2 sets of abc together with an 'X' wave in between). I believe we are within the 'C' of the second set now;

Fairly obviously, the converse to the 61.8% top mentioned in the chart is that we simply retraced 61.8% of the W wave for our X wave.
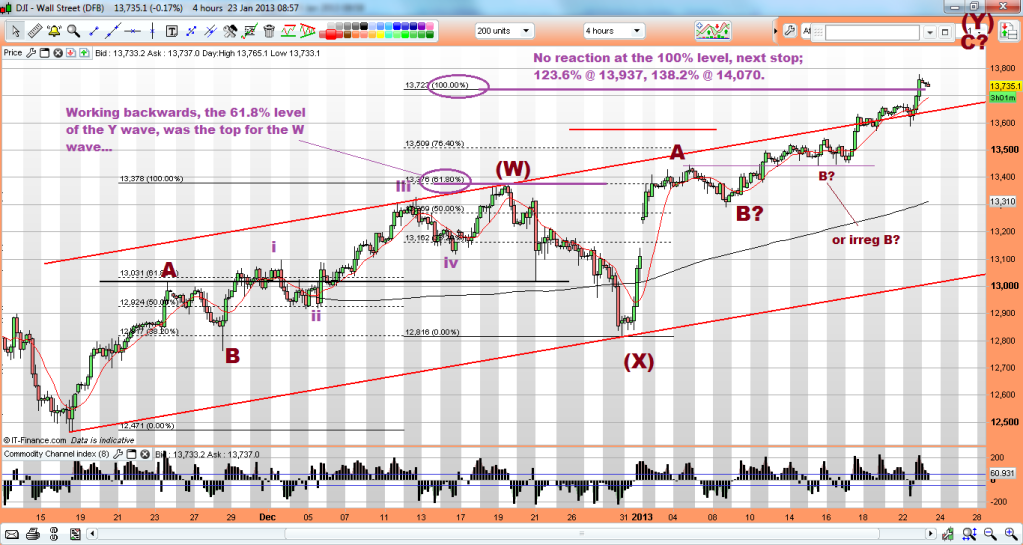
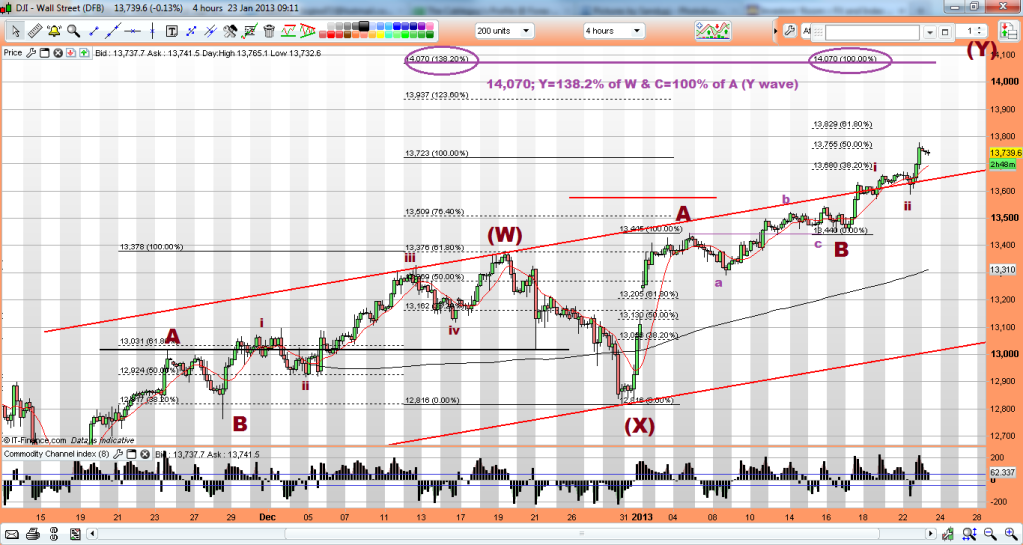
Davai - 23 Jan 2013 09:21 - 252 of 423
Without labeling every last detail, you can see A=5 waves, B corrects in 3 waves, C is always in 5 waves (labeled on chart 'i' to 'v'). I have reason to believe the second 'B' wave (of the Y wave) was irregular and have labeled it as such in this next chart. It looked too small in the above. Now apply fibs from wave 'A' (of Y) and project off of end of 'B' and hey presto, we get the 100% level coinciding with the 138.2% projection of entire set ('W') for end of 'Y'. Hmmmm certainly a possibility;

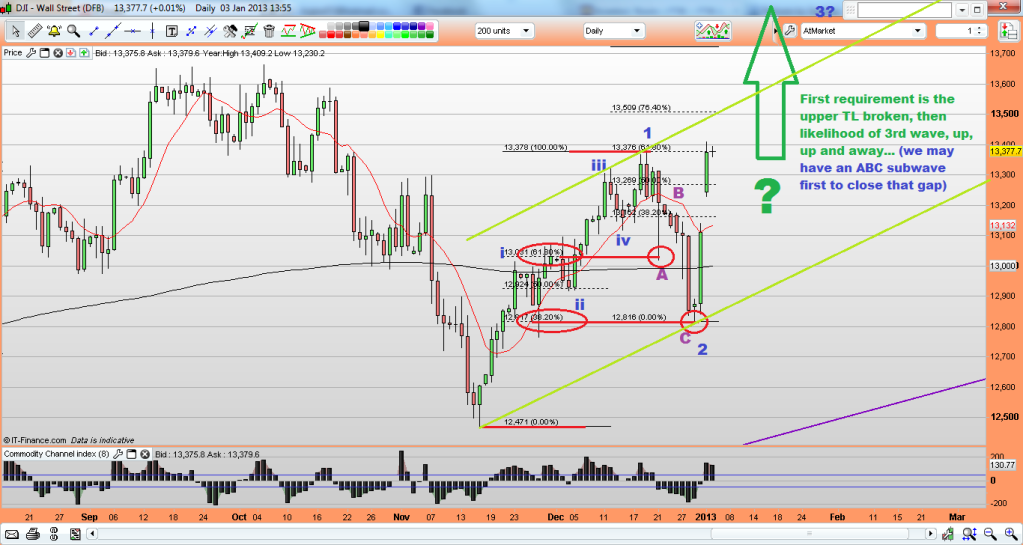
Davai - 23 Jan 2013 09:47 - 253 of 423
I have a little theory for cable. Its only an idea, but i can easily make a case for us not having completed the wedge yet. there is a tonne of bearish talk about the death of the £ for the foreseeable future, but i reckon we have room for one last high yet;


Davai - 23 Jan 2013 09:53 - 254 of 423
I love the way, it broke its lower parallel channel line for a bit, then waits til it coincides with 15,800 to obey it again, 100% level of W wave been providing support for last couple of days too;


Davai - 23 Jan 2013 10:02 - 255 of 423
Don't forget, i am only highlighting observations and sharing thoughts, mainly for myself to use as a diary. I can already look back to the start of the thread and laugh at how i used to label things. That was the whole purpose and the progress has been rapid thus far.
The market has so many phases and being able to adapt quickly to each one as it happens is key to success, as is, not being tied to one count or view.
Happy pips to all, but don't allow my views to alter your own. I have posted many many charts here that have been wrong! Good luck.
The market has so many phases and being able to adapt quickly to each one as it happens is key to success, as is, not being tied to one count or view.
Happy pips to all, but don't allow my views to alter your own. I have posted many many charts here that have been wrong! Good luck.
Davai - 23 Jan 2013 18:45 - 256 of 423
Would ideally like to see the Eu print 100% of wave W for wave Y. It would also mean a fresh low, but without breaching the last HL which is a reflex point;

It would actually predict a turn literally to the pip. We haven't bounced off of a fib level, so reckon its high poss.

It would actually predict a turn literally to the pip. We haven't bounced off of a fib level, so reckon its high poss.
Davai - 24 Jan 2013 10:55 - 257 of 423
Ok so, yesterday i posted a chart of the EJ, showing 'Y' = 100% of 'W' (i labeled it simply as an ABC), we have now just made a lovely 5w move off of that very line;

Also, the GJ has bounced cleanly off of its 70.7% level of the prior 3rd wave and made a similar perfect 5w advance;

The bigger picture;

I like this chart a lot. Now, is it the real deal, or has the market played a trick with an irregular 'B' wave beforehand? (thus this would be an ending 'C' wave ready to drop further...). It's difficult to imagine it to be fair and the more likely scenario would be to say that both Yen pairs have now ended their corrective moves...
I might cast my eye over the UJ...
Davai - 24 Jan 2013 11:17 - 258 of 423
It would be nice to see an extended 5th of current cycle on EJ reaching 12,024...
Davai - 24 Jan 2013 11:38 - 259 of 423
EJ bigger pic so far;


Davai - 24 Jan 2013 12:19 - 260 of 423
Can't believe it, but i may have to contradict myself again. Looking at the longer term EJ chart. I believe my 1&2 to be correct, as it leads to wave 3 = 200% of wave 1.
Now, wave 2 was long, simple and shallow, therefore by rule of alternation we should expect wave 4 to be fast, deep and complex;

That looks far more likely (imo)
Now, wave 2 was long, simple and shallow, therefore by rule of alternation we should expect wave 4 to be fast, deep and complex;

That looks far more likely (imo)
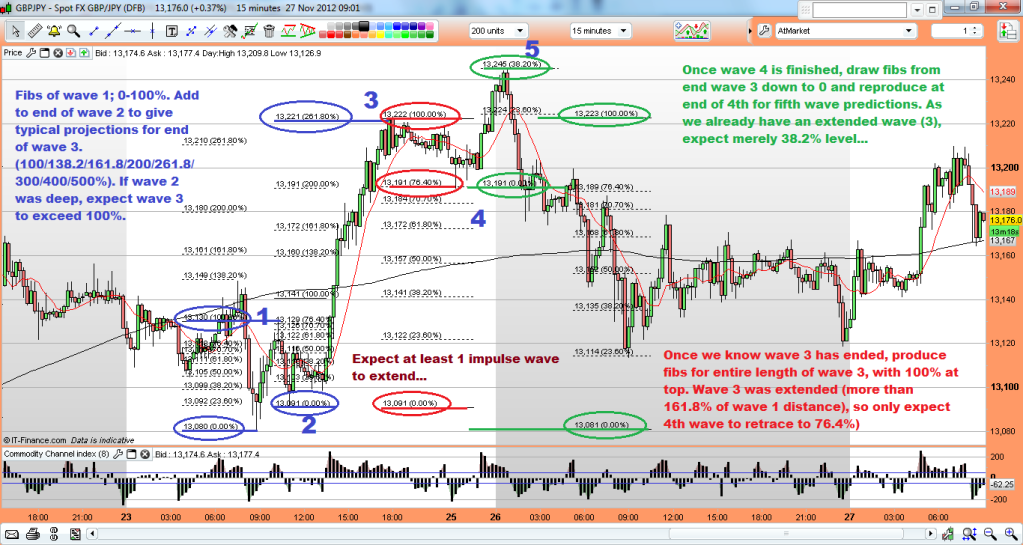
Davai - 24 Jan 2013 14:11 - 261 of 423
With so many conflicting thoughts on the overall direction right now, i need to remind myself of a good trade;

This is exactly what i'm looking for and want to make a note.
I think a lot of the best trades are towards the end of each cycle. I always said the easiest wave to recognise is the 3rd (and subsequently the 4th). That is obviously scaleable into each of the subwaves.
Once we have a set of Elliott lines, we can look for an abc counter-trend and whenever the likely end of a 'c' wave nears the lower channel trendline you can go long with stop some pips below the TL (or vica versa for short).
Here i get the added benefit of a valid trigger out of the flagline, this together with the break of the 38.2% Fib ext gives a virtually gauranteed target for the flagtrade generated target and next fib level... It may be just 30 pips, which to most doesn't seem like a big deal, but as i keep mentioning, its not pips, its percentages. That is as good a 1/2% risk:3/4% reward trade as you can find anywhere, with high probability outcome when executed properly.
Find net two wins like that a week and you are banking 5/6/7% a week or 20/25% gain a month... That's realistic too. I empthasise 'net' wins, 4 trades, 3 wins, 1 loss and a favourable R/R ratio to boot.
Add exponential growth to that and the figures start to multiply well. You don't need to look to catch huge moves, just to add several things together to find a high probability trade.
Been a tough couple of weeks. I really thought i was good enough to trade complex corrective moves, but i've been chewed up and spat out by the markets.
So to highlight the above makes me feel a little more relaxed again.
Davai - 24 Jan 2013 15:41 - 262 of 423
Post 250;
FTSE;
'Fifth's can grind on up mercilessly and continue to have extended subwaves, so its difficult to call an absolute top for this cycle, but i would imagine if, it goes higher again now, it will bang its head on the upper trendline drawn off of the top of the 'iii' wave.'
here's what i meant;

FTSE;
'Fifth's can grind on up mercilessly and continue to have extended subwaves, so its difficult to call an absolute top for this cycle, but i would imagine if, it goes higher again now, it will bang its head on the upper trendline drawn off of the top of the 'iii' wave.'
here's what i meant;

| About MoneyAM | Ts and Cs | Privacy Policy | Investment Warning | Content Standards | Corporate Solutions | Advertise With Us | Site Map | © 2026 MoneyAM |
Register now for FREE
Share Prices,
Stock Quotes,
Charts, Bulletin Boards, Indices, Watchlists, Portfolio, Market News, Research
or see our Premium Services including Level 2, Terminal and much more.