
| Home | Log In | Register | Our Services | My Account | Contact | Help |
You are NOT currently logged in
Register now or login to post to this thread.
Davai - 18 Apr 2012 11:13


Thread designed to record set-ups and targets on index and FX pairs.
'A market is only your enemy until you understand it, then it becomes your best friend.'
Any questions, please feel free to ask.
From time to time i may openly state an opinion regarding direction of a set-up and wish to add that in no way am i recommending a trade. I am sometimes only in trades for a matter of minutes and can't always update as to entry/exits taken.
As always, markets are dangerous places to be and must be respected as such. Always use stop losses and never over-leverage; 3% of your pot as a maximum per trade. As always, YOU are responsible for your own trades! Happy pip hunting!
Click HERE to visit me at FXtechnicals.net
Davai - 01 Feb 2013 16:54 - 291 of 423
Thing is i need a 'C' wave back up for cable early next week, oh the possibilities are endless!
Post 281, i showed a zigzag correction and also an irregular, the other poss was a flat, which is what it currently looks like printing. If it has a couple of up day's early next week, i will keep a watch for a likely turning point. If it all works out, short the crap out of it cos its heading to 1.25...
Post 281, i showed a zigzag correction and also an irregular, the other poss was a flat, which is what it currently looks like printing. If it has a couple of up day's early next week, i will keep a watch for a likely turning point. If it all works out, short the crap out of it cos its heading to 1.25...
Davai - 01 Feb 2013 17:58 - 292 of 423
Likely bounce points for Cable, for further proof;
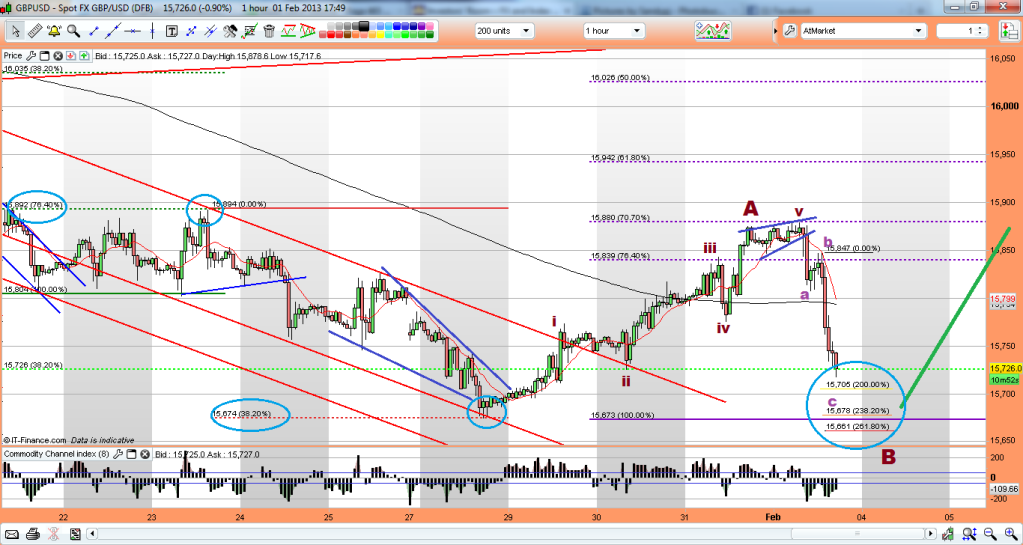
If a miscount, any upturn will only be in 3w, but a further retest of the previous top channel line would make sense.

If a miscount, any upturn will only be in 3w, but a further retest of the previous top channel line would make sense.
Davai - 03 Feb 2013 19:43 - 293 of 423
Like i said, i don't like to try to call a top, usually end up looking silly, but we are 70 pips away from my target suggested a couple weeks ago (14,070). Now look at this for the S&P. This is an awesome chart with fib relationships working perfectly everywhere. It doesn't however, give me more than the top trend line of the ending diagonal for a top, until i go down the timescales, i have a rough guesstimate at around 1525/30ish (50%fib at 1533), but with the strength around at the moment it would lead you to think it will be a rolling top as opposed to a spike, if we are indeed thereabouts. Who knows, maybe N.Korea will kick start proceedings and then debt will become the overall proverbial straw?!


Davai - 03 Feb 2013 20:12 - 294 of 423
Audi weekly;


Davai - 03 Feb 2013 20:43 - 295 of 423
Just in case, (for the not so familiar with counting and impulse/corrective etc); it means this is a large overall ABC 5-3-5 corrective move, of which we are very near the end of the 3w B, we have 5w short to come. This doesn't mean it has to be like the crash of 2008 and doesn't even have to drop so far. minimum would be 50% though. Being a C wave it could be an ending diagonal and last for years...

The caveat is as to whether the crash of 2008 was the 'C' wave and thus we are now in an impulse move. In which case, this simply wont stop climbing. I like the corrective count especially the way the fib ratios work, however, as i keep stressing, the trend is up (until it isn't!). I doubt anyone would want to work on a 1/2/5 year timescale and besides, if we do see a 'C' wave back down, which turns out to be an ending diagonal, it could take years and see many massive upswings along the way...
Its buy the ABC pullbacks until it doesn't work any longer and then we find a different sequence of impulse moves short (LL's/LH's).
Davai - 04 Feb 2013 10:11 - 296 of 423
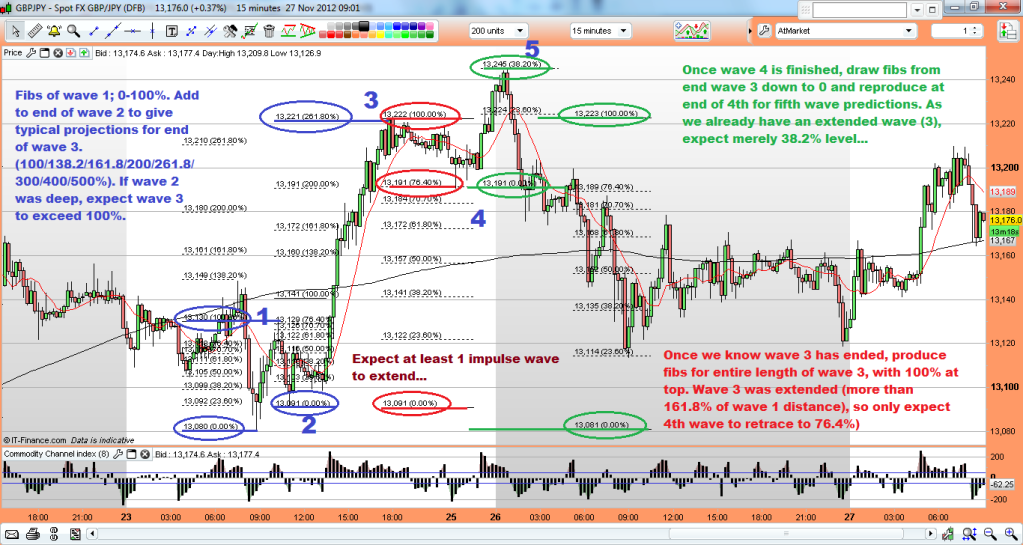
Flagtrade saying GJ will reach at least 14,690 of this leg;


Davai - 04 Feb 2013 12:10 - 297 of 423
Time to short the Euro?
Ok, so need to be keeping a close eye on it now. Back at the turn of the year;
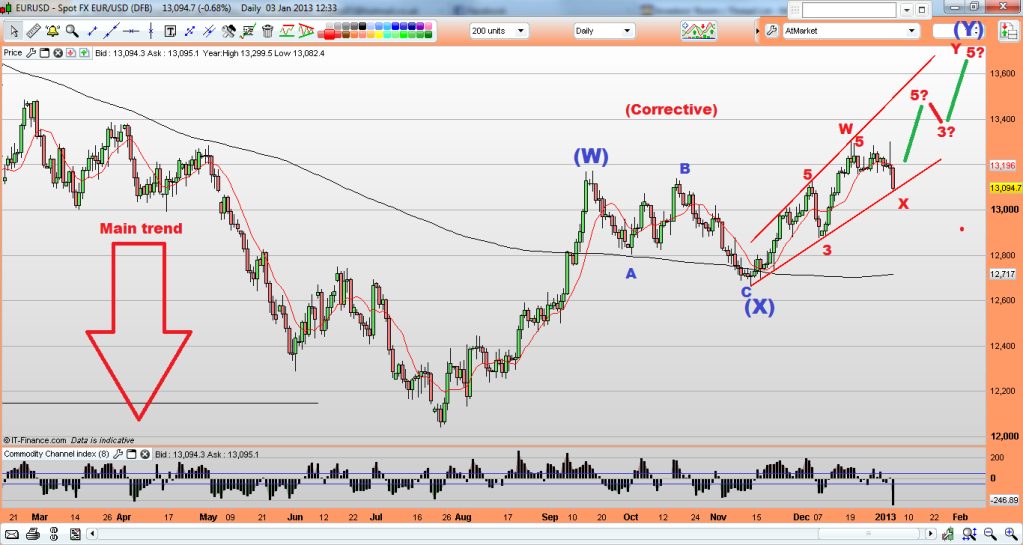
recent;
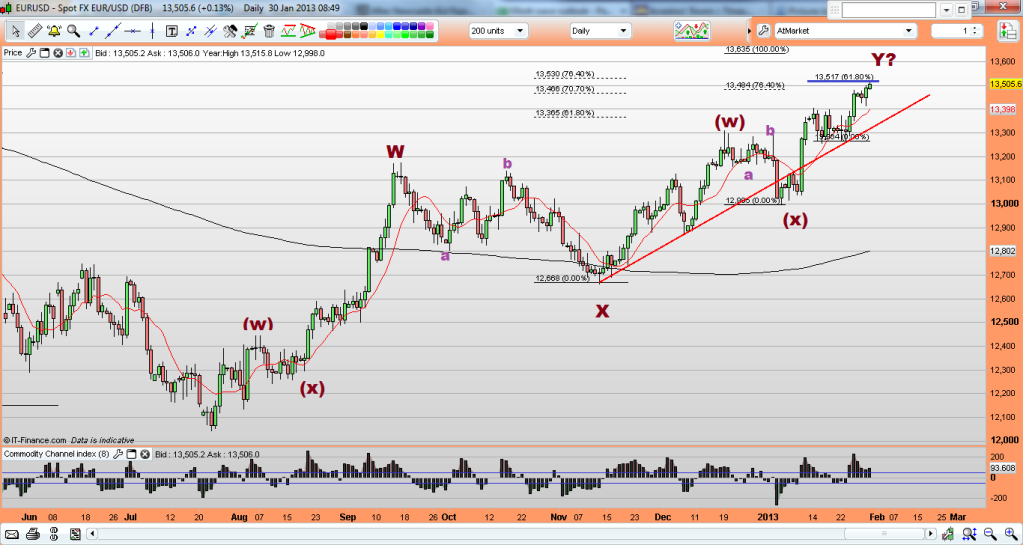
and a little closer shows possibility that of this 'Y' wave, 'C' reached exactly the 138.2% level of wave 'A';

Current action on other Euro crosses looks corrective, so am mindful that a wave 3 on the EU would also equal a fib level of wave 1 (instead of a&c).
Davai - 04 Feb 2013 12:25 - 298 of 423
Thoughts are EJ is in a 4th of its current degree, so higher yet, may coincide with the EU heading back up, (but with trend change and in a corrective wave 2 instead). Will try and confirm a count, but its not actually trending very nicely to read right now... £ needs to sort itself out too, if it is to become a 'C' wave, it looks far more like a 4th this morning of a larger 5w set short. Really want to get short on cable, but can't read current action, despite, so far doing what i printed last week.
Iain


 - 04 Feb 2013 13:35
- 299 of 423
- 04 Feb 2013 13:35
- 299 of 423


Yes......but!
Davai - 04 Feb 2013 13:47 - 300 of 423
but what Iain?
Iain
- 04 Feb 2013 13:53
- 301 of 423
I'm just trying to bring a little balance. A devil's advocate etc
Davai - 04 Feb 2013 14:02 - 302 of 423
Of course! Trend is still up on practically everything, i'm just highlighting events as they happen. If they happen some time after initially being flagged, its always good to question if you have a change of heart once they are met. Most of the targets i had in mind a month ago are being reached, but now we are here, i feel even more bullish! Does that mean it is a time to be cautious? Isn't that how it all works?!
For me it doesn't really matter as i work on smaller timescales and as i keep saying, trend is up, (until it really isn't anymore).
For me it doesn't really matter as i work on smaller timescales and as i keep saying, trend is up, (until it really isn't anymore).
Iain
- 04 Feb 2013 14:04
- 303 of 423
Im with you "Currently"
Davai - 04 Feb 2013 14:19 - 304 of 423
Do i detect an air of cynicism perhaps?!
Iain
- 04 Feb 2013 14:44
- 305 of 423
Not at all
Davai - 04 Feb 2013 15:14 - 306 of 423
Lots of my charts make it look complicated, but generally they are for practice purposes and purely for an overall plan.
Here is a very simple formula for making money. Identify a trend (HH's/HL's etc), wait for a pullback.
Let's assume trend is up. Go down the timescale to determine a,b&c, using EW & Fibs, you should be able to determine end of 'C'.
Now look for minor 5w up/3w back down.
Go long at end of this minor abc, it will often retest a TL. Stop is a pip (plus spread) below prior larger 'C'. Sounds complicated, so here's a chart.

Fibs and EW channels can be used to dictate likely targets, but this was a 10 pip risk and easy 30+ pip gain. That's 1:3 R:R. Its scaleable, but for anyone who says, 'big deal, its only 30 pips', is misunderstanding the idea. Pips are not important, percentages are. If i had a 200 pip target on an hourly set-up, my risk would still have been the same, therefore why wait for hourly/daily set-ups, when they happen all the time on the 5min? If traded as a 1% risk, you would have claimed 3% gain. A max 3% risk would have netted 9% etc...
That's without being greedy, but its also possible using this method to get onboard a longer trend and use the 10MA (+20pips) as a trailing support for your stop.
Davai - 04 Feb 2013 18:30 - 307 of 423
Here's another... Draw a flagline off of previous peak connecting top of the minor 5w peak (wave 1), entry after breakout bar coincides with CCI trigger. Target is equal to risk. Stop is pip below lowest point of pullback;


Davai - 04 Feb 2013 18:36 - 308 of 423
12,499 possible place for bounce on EJ. Eu is obeying 10ma on hourly, usually indicates impulsive move as opposed to corrective. Inconclusive right now, but is sat on 61.8% retrace level of previous wave right now.
EJ also reached exactly 100% level of previous wave, (identical to the earlier Eu chart which reached 138.2% in same move). Have it down as 4th right now.
*Edit 12,479 is fib level
EJ also reached exactly 100% level of previous wave, (identical to the earlier Eu chart which reached 138.2% in same move). Have it down as 4th right now.
*Edit 12,479 is fib level
Davai - 04 Feb 2013 18:50 - 309 of 423
Chart for above, but EU is now lower in last few minutes;


Davai - 04 Feb 2013 18:59 - 310 of 423
Ok, 12,450 is 61.8% ext for minor 5th, Eu is exactly at 13,500 for 50% minor 5th ext...
| About MoneyAM | Ts and Cs | Privacy Policy | Investment Warning | Content Standards | Corporate Solutions | Advertise With Us | Site Map | © 2026 MoneyAM |
Register now for FREE
Share Prices,
Stock Quotes,
Charts, Bulletin Boards, Indices, Watchlists, Portfolio, Market News, Research
or see our Premium Services including Level 2, Terminal and much more.