
| Home | Log In | Register | Our Services | My Account | Contact | Help |
You are NOT currently logged in
Technical Analysis (TA)
ptholden

 - 09 Jul 2007 23:14


I often find all manner of reference to Technical Analysis whilst reading threads, questioning certain elements, asking for advice on indicators and also requesting advice on a stock and whether it's a good time to buy, sell, hold or remain indifferent. I am the first to admit that my own TA is still in its infancy, but I do spend time on expanding my knowledge (hopefully in the right direction!).
Rather than having to ask a TA question on a particular thread, perhaps this thread could be used as a forum for TA queries and become a knowledge base. Just a thought, if there is little or no interest, the thread will sink without trace and that will be the end of that. I will personally add a few snippets to help those with less knowledge (if that's possible) to keep things rolling. There is a danger that the thread will receive countless requests for opinions on a variety of stocks and there is only so much I can do alone, therefore I would more than welcome input from other posters, no matter how rudimentary they believe their own knowledge to be, hopefully some real experts will take the time to contribute.
Rather than having to ask a TA question on a particular thread, perhaps this thread could be used as a forum for TA queries and become a knowledge base. Just a thought, if there is little or no interest, the thread will sink without trace and that will be the end of that. I will personally add a few snippets to help those with less knowledge (if that's possible) to keep things rolling. There is a danger that the thread will receive countless requests for opinions on a variety of stocks and there is only so much I can do alone, therefore I would more than welcome input from other posters, no matter how rudimentary they believe their own knowledge to be, hopefully some real experts will take the time to contribute.
ptholden
- 10 Jul 2007 19:07
- 3 of 504
I posted this yesterday on the Traders Thread and thought a follow up on here would be informative as it does seem to reinforce some TA techniques.
Here we go LW, three screen shots to think about.
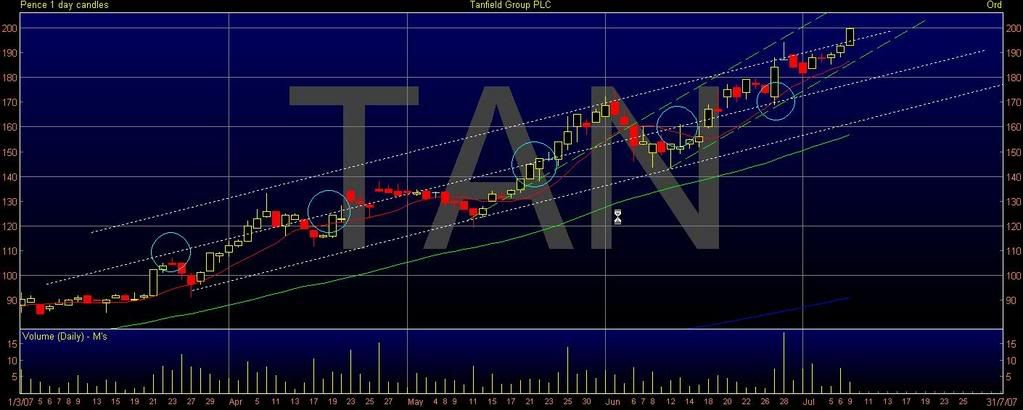
1. Looking at the SP movement. Although the first two are not shown the latest channel (green) is actually the fourth and steeper than the previous three. Personally I wil be surprised if this latest trend is sustainable (reasons for which I will explain shortly). However, I do think that the third channel (white) is the one to watch. It would appear that there is also a mid line to this particular channel and to demonstrate my point I have circled areas of both resistance and support within this channel. Strictly speaking the upper white trendline should provide support now it has broken out into a new trend, but historically the SP has always retraced somewhat following such a breakout and I don't think either this line or the bottom of the 'green channel' will provide sufficient support. I am guessing that the mid line of the 'white channel' will prop the SP up and maintain the Bullish trend. If this doesn't work, the bottom of the 'white channel' supported by a rising 50MA will. In monetary terms you are therefore looking at overall support between 175p-185p (ish). So if you want to set a worst case stop loss, personally I would opt for 170p ish.
![<a href=]()
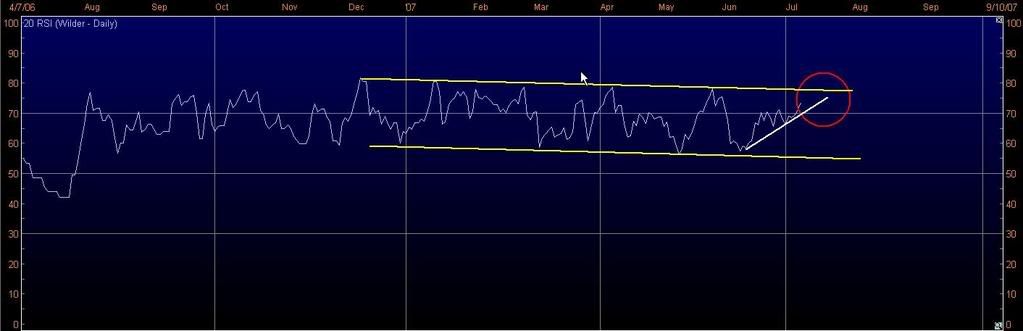
2. The second screen shot is of the RSI. What you can see here is that the RSI is steadily decreasing and clealry within a channel enocmpassed by the two yellow lines. This would seem to indicate that the SP is slowly cooling off and the latest trend unsustainable. You can also see the most recent trend reflected by the steep increase in the RSI and I would expect when this trend bumps into the down sloping resistance the retracement will commence.
![<a href=]()
3. The third screen shot is that of the MACD. I mentioned bearish divergence earlier today, but that was before the last minute small spike. However, I have drawn a hypothetical divergence line as we stand at close today. What you can also see is that the MACD is in a bullish uptrend, but again is close to the top of the channel. This would seem to confirm that the latest move is close to completion.
![<a href=]()
 "
"
In summary;
My personal opinion (FWIW) is that the latest move is close to completion and that some retracement should be expected. If you are looking to trade then keep an eye on the channels, the RSI and the MACD. You may well be able to sell close to the top and then buy back sub 200p, somewhere in the region of 180p+ perhaps, again keep an eye on the chart and indicators for proof of support.
Hope all that helps, just bear in mind I am no expert, my thoughts only. Good luck!
pth
Todays screen shots:
![<a href=]()

![<a href=]()

![<a href=]()
 "
"
Points to note from yesterday's analysis and pretty much as expected although the retracement happened quicker than I thought:
1. The top of the shallower uptrend (white line) did not provide support
2. Will the bottom of the steeper uptrend provide support? I don't think so.
3. The RSI didn't reach the upper channel and has even broken the uptrend, which leads me to think that the steeper SP channel will fail.
4. The MACD has also bounced off the top of its channel and I think may now be constrained by the hypothetical bearish divergence line I drew yesterday, this line may not be hypothetical for much longer.
Obviously a down day across the markets, but to a degree the TA rather predicted the move. Subject to debate of course :)
pth
Here we go LW, three screen shots to think about.
1. Looking at the SP movement. Although the first two are not shown the latest channel (green) is actually the fourth and steeper than the previous three. Personally I wil be surprised if this latest trend is sustainable (reasons for which I will explain shortly). However, I do think that the third channel (white) is the one to watch. It would appear that there is also a mid line to this particular channel and to demonstrate my point I have circled areas of both resistance and support within this channel. Strictly speaking the upper white trendline should provide support now it has broken out into a new trend, but historically the SP has always retraced somewhat following such a breakout and I don't think either this line or the bottom of the 'green channel' will provide sufficient support. I am guessing that the mid line of the 'white channel' will prop the SP up and maintain the Bullish trend. If this doesn't work, the bottom of the 'white channel' supported by a rising 50MA will. In monetary terms you are therefore looking at overall support between 175p-185p (ish). So if you want to set a worst case stop loss, personally I would opt for 170p ish.
2. The second screen shot is of the RSI. What you can see here is that the RSI is steadily decreasing and clealry within a channel enocmpassed by the two yellow lines. This would seem to indicate that the SP is slowly cooling off and the latest trend unsustainable. You can also see the most recent trend reflected by the steep increase in the RSI and I would expect when this trend bumps into the down sloping resistance the retracement will commence.
3. The third screen shot is that of the MACD. I mentioned bearish divergence earlier today, but that was before the last minute small spike. However, I have drawn a hypothetical divergence line as we stand at close today. What you can also see is that the MACD is in a bullish uptrend, but again is close to the top of the channel. This would seem to confirm that the latest move is close to completion.
" In summary;
My personal opinion (FWIW) is that the latest move is close to completion and that some retracement should be expected. If you are looking to trade then keep an eye on the channels, the RSI and the MACD. You may well be able to sell close to the top and then buy back sub 200p, somewhere in the region of 180p+ perhaps, again keep an eye on the chart and indicators for proof of support.
Hope all that helps, just bear in mind I am no expert, my thoughts only. Good luck!
pth
Todays screen shots:
" Points to note from yesterday's analysis and pretty much as expected although the retracement happened quicker than I thought:
1. The top of the shallower uptrend (white line) did not provide support
2. Will the bottom of the steeper uptrend provide support? I don't think so.
3. The RSI didn't reach the upper channel and has even broken the uptrend, which leads me to think that the steeper SP channel will fail.
4. The MACD has also bounced off the top of its channel and I think may now be constrained by the hypothetical bearish divergence line I drew yesterday, this line may not be hypothetical for much longer.
Obviously a down day across the markets, but to a degree the TA rather predicted the move. Subject to debate of course :)
pth
ptholden
- 10 Jul 2007 22:15
- 4 of 504
To prove a point that when below 30 a stock is not necessarily oversold on the RSI take a look at WNG.
![<a href=]()
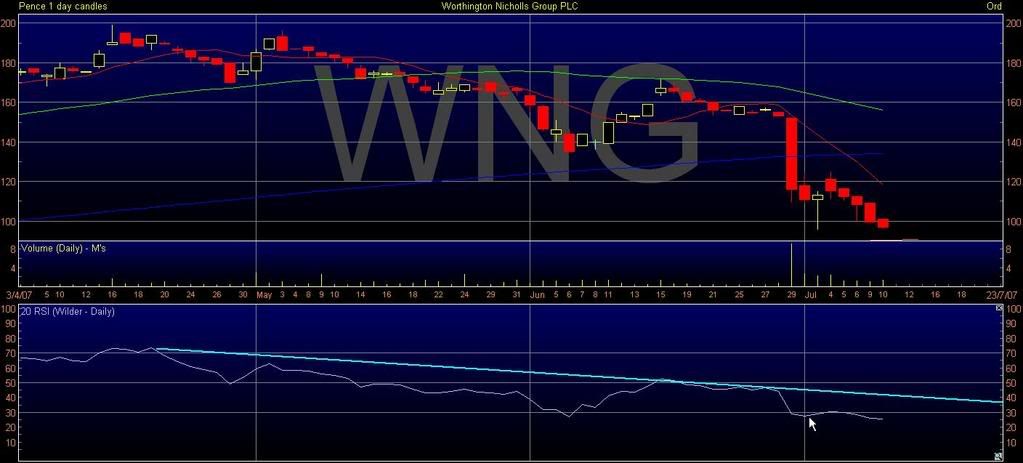
Earlier this week the SP made a recovery to approx 120p before falling away again and is now sub 100p. Anyone using the RSI as an oversold indicator would now be sitting on a 20p loss per share in the short term.
Take a look at June, having fallen below 30 the RSI recovered INDICATING a possible change in momentum; it then fell back slightly recording a higher low and then exceeded the previous high, a failure swing point and CONFIRMED buy signal. Ok you wouldn't have got the bottom, but would have bought at 140p and selling at 160p using the same principles recorded a 20p profit per share.
pth
cynic
- 11 Jul 2007 08:58
- 5 of 504
PT .... what a great looking thread you seem to have started ..... will read it thoroughly later ...... very many thanks; others should take heed too!
David10B
- 11 Jul 2007 09:04
- 6 of 504
Yes I must agree its very well done with a great deal of effort---good show.
Although I dont agree with TA I am trying to undertand it, but I find difficutly.
Although I dont agree with TA I am trying to undertand it, but I find difficutly.
Strawbs
- 11 Jul 2007 09:35
- 7 of 504
It's worth understanding at least the basics David. If you're disciplined it can certainly help with timing buys and sells, although not always totally accurate, definetly worth the effort to learn.
Good thread PT.
Strawbs.
Good thread PT.
Strawbs.
David10B
- 11 Jul 2007 09:39
- 8 of 504
Agreed
cynic
- 11 Jul 2007 10:39
- 9 of 504
i shall have to re-read PT's detailed example several times to understand full what he is saying ...... no bets that my one remaining grey cell will be able to absorb that much info even then! .....
however, if we use my own pathetically basic analysis of TAN (see chart below), i had reached a similar conclusion, but for slightly difefrent reasons
i reckoned that 200 would prove to be a psychological barrier, as round numbers often are, especially if the market was stopping for a breather or even a correction ...... this has proved to be the case, though you would need to look at the intra-day trading to see that 200 has been nudged several times, but not really broken.
looking for retrenchment, the 25 dma is currently at about 175, though still rising strongly, with the 50 dma not far behind at about 160 and running almost parallel (as it happens) ...... either/both these levels are likely to give support.
cynic
- 11 Jul 2007 10:45
- 10 of 504
the above TAN chart was over the last 3 months, merely to make it easier to read ..... below is the 1 year chart, and to me, the interesting thing is that the 25 dma has given consistent support ....... therefore, at least from my own trading perspective, there looks to be little scope for finessing this stock, especially as even in today's soggy market (carrying on from late yesterday), sp has remained pretty solid ..... in conclusion, i shall stay put

garfeebloke - 11 Jul 2007 11:01 - 11 of 504
Excellent, as ever PT. Thanks.
BigTed
- 11 Jul 2007 11:09
- 12 of 504
cracking work guys, makes for interesting reading, have been interested in TA for a while, but confess i do need to put more effort into understanding the correct signals, as hindsight has always been the only (worst) guide
cynic
- 11 Jul 2007 11:23
- 13 of 504
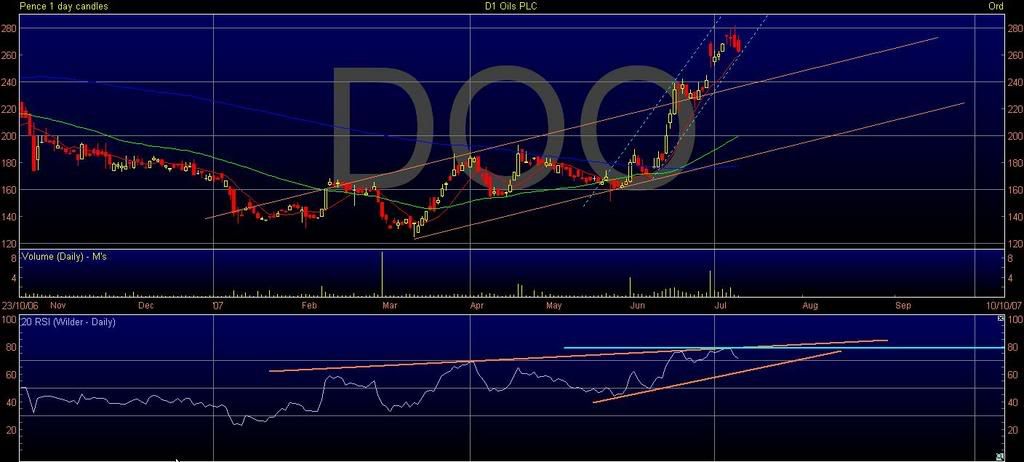
if we now look at DOO (another of my fave shares!), i think PT will agree that TA does not work here, or at least not for the time being ...... the reason being that there has been news of a very important JV with BP which has had an obvious and dramatic impact on sp ....... see 1 year chart below.
my conclusion on this stock would be NOT to buy at current levels as there is potential for sp to fall about 30p before even hitting support on 25 dma ...... imo, this could easily happen if the market starts to catch fright on the back of Wall Street.
however, my own view is that the fall on Wall Street last night was (typically!) overdone and that Bernanke was implying that inflation did not look too serious and that therefore interest rates would not need to be raised .... in fact, having closed my long Dow yesterday afternoon (reasonable profit), i have just re-opened same 70 points lower
ptholden
- 11 Jul 2007 14:43
- 14 of 504
Sorry to bang on about RSI and the misguided belief it is an overbought / oversold indicator but DOO offer another excellent example. Note that when the RSI hit 80, some would have been yelling SELL, overbought and yes it did fall back to 70 but then the SP carried on going up. What the RSI didn't do was make a failure swing, ie, dip below the previous high. One to keep an eye on now, because it may well do so soon, look for the RSI turning down and if it dips below 70, it theoretically posts a confirmed SELL signal.
The problem with these near vertical moves is determining a trend line and where support lies. I'll post a chart in a while looking at speedlines and fib retracement levels which may offer a clue.
pth
The problem with these near vertical moves is determining a trend line and where support lies. I'll post a chart in a while looking at speedlines and fib retracement levels which may offer a clue.
pth
cynic
- 11 Jul 2007 14:51
- 15 of 504
PT .... like all good brokers, you say sell when you mean buy and vice versa! ...... oversold when rsi hit 80? ...... don't think so lol! .... anyway, there are very specific factors driving DOO at the moment, which is why i said TA did/does not work here at least pro tem .... interestingly, sp seems to be getting another head of steam - +15p this afternoon
ptholden
- 11 Jul 2007 14:59
- 16 of 504
oops edited now :)
ptholden
- 11 Jul 2007 15:18
- 17 of 504
Richard re TAN, yes we did come to the same conclusion using different indicators, which when used together further strengthen any TA and therefore the decision process. My thoughts were that a correction / retracement was due, as were your own and we both arrive at support in the region of 175p. Isn't the world a lovely place when we all agree, although my next post disagrees with your thoughts on DOO :)
cynic
- 11 Jul 2007 15:28
- 18 of 504
we did not actually disagree for i said i would NOT buy at the current level ..... in fact, since posting that, sp has bolted a further 20p ...... given that sp has been quite static for the last week or so and wonder if there is any good reason for the new surge.
rsi must eventually correct itself, but if i read you correctly, the upward trend is still maintained provided that rsi does not fall below 70 or thereabouts ...... conversely, i guess your "logic" also implies that if rsi now rises above about 85, then a new buy signal is triggered ...... hmm! that sounds a bit brave to me, so may have misinterpreted
rsi must eventually correct itself, but if i read you correctly, the upward trend is still maintained provided that rsi does not fall below 70 or thereabouts ...... conversely, i guess your "logic" also implies that if rsi now rises above about 85, then a new buy signal is triggered ...... hmm! that sounds a bit brave to me, so may have misinterpreted
ptholden
- 11 Jul 2007 16:02
- 19 of 504
The point on which I disagree is that DOO is affected by special factors (BP) and therefore conventional TA does not or cannot apply. The TA argument goes along the lines of:
1. Market action discounts everything
2. Prices moves in trends
3. History repeats itself
(From JJ Murphy Technical Analysis of the Financial Markets)
Number 1 discounts BP.
Anyway, here's a chart, unfortunately it does not include today's action, I'll have to wait until 1800 before my charting package is updated, but I will post another one later.
First important thing to note is that the RSI failure swings are intended to work only when the indicator is over 70 or under 30 to initiate a short or long position, not to initiate a long position if already over 70. Although it's an interesting concept, but one I feel laced with considerable risk. I'll have to look at the mathematics of the RSI to find out exactly what such an approach would entail.
Back to DOO: Mid June the SP was happliy bouncing within a reasonable trend and then a breakout (again this was confirmed by the RSI, that failure swing once more). Since then it is clear that the SP is in a much steeper channel and thus far is maintaining that channel. This particualr screenshot has compressed the chart somewhat, so it doesn't look that steep, but actually it is. As Cynic says, it needs to at least consolidate sometime if not retrace, problem is determining when it will stop and where support lies. The RSI would seem to set a cap on the move, the upslopey trendline and the horizontal line should both act as resistance and taking today's move into consideration it would appear that this might just be it for now. That isn't to say it WILL retrace, but that the price action will take a breather. The retracement will occur if the RSI support line is broken. If there is a retracement I see support at 240p+, this is the top of the previous shallower channel. If that doesn't hold then there is (although not drawn) a mid line to this particualr channel which would offer support at 220p+. If it were to falll that far I daresay the 50MA would be about in the same place by then and provide additional support.
pth
![<a href=]()
1. Market action discounts everything
2. Prices moves in trends
3. History repeats itself
(From JJ Murphy Technical Analysis of the Financial Markets)
Number 1 discounts BP.
Anyway, here's a chart, unfortunately it does not include today's action, I'll have to wait until 1800 before my charting package is updated, but I will post another one later.
First important thing to note is that the RSI failure swings are intended to work only when the indicator is over 70 or under 30 to initiate a short or long position, not to initiate a long position if already over 70. Although it's an interesting concept, but one I feel laced with considerable risk. I'll have to look at the mathematics of the RSI to find out exactly what such an approach would entail.
Back to DOO: Mid June the SP was happliy bouncing within a reasonable trend and then a breakout (again this was confirmed by the RSI, that failure swing once more). Since then it is clear that the SP is in a much steeper channel and thus far is maintaining that channel. This particualr screenshot has compressed the chart somewhat, so it doesn't look that steep, but actually it is. As Cynic says, it needs to at least consolidate sometime if not retrace, problem is determining when it will stop and where support lies. The RSI would seem to set a cap on the move, the upslopey trendline and the horizontal line should both act as resistance and taking today's move into consideration it would appear that this might just be it for now. That isn't to say it WILL retrace, but that the price action will take a breather. The retracement will occur if the RSI support line is broken. If there is a retracement I see support at 240p+, this is the top of the previous shallower channel. If that doesn't hold then there is (although not drawn) a mid line to this particualr channel which would offer support at 220p+. If it were to falll that far I daresay the 50MA would be about in the same place by then and provide additional support.
pth
cynic
- 11 Jul 2007 16:11
- 20 of 504
#2 - i agree
#3 - everyone knows history is bunkum!
#1 - this was such a significant occurence, that i do not think it can be discounted
therefore Murphy's Law supercedes Murphy's Technical Analysis in this specific .... lol!
#3 - everyone knows history is bunkum!
#1 - this was such a significant occurence, that i do not think it can be discounted
therefore Murphy's Law supercedes Murphy's Technical Analysis in this specific .... lol!
ptholden
- 11 Jul 2007 16:57
- 21 of 504
Seeing that MLR is been ramped all over the chip shop by a certain poster, thought I would have a look at the chart. Problem with these tiddlers is that the price action can and is often quite erratic and somewhat dificult to discern a pattern and therefore a half decent analysis.
![<a href=]()
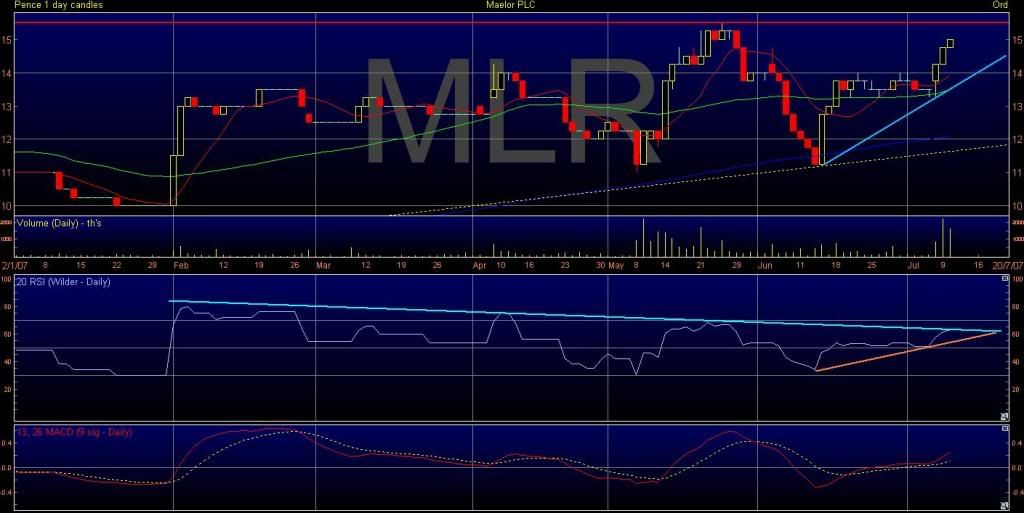
This chart doesn't include today's price action, but we know it lost 0.50p.
The chart itself shows two uptrends, the more recent quite steep and the shallower a much longer term trend, but still up. There is also longer term resistance at 15.5p (red line). Since Feb this year what can also be seen is a fairly robust downtrend on the RSI, this has capped any rise on a number of occasions, including the most recent push to break effectively through 15p. What is quite interesting is that the RSI is actually showing bearish divergence in comparison to the SP, ie the RSI has declined whilst the SP has risen, theoretically not good. What is also apparent is the bearish divergence on the MACD, again the MACD has recorded a lower high (just) at the end of May whilst the SP has risen, seemingly confirming that the rise over the last 5 months is not supported by TA.
Looking to the immediate future I don't believe that the steeper trendline on the chart is sustainable nor will the support on the RSI do any actual support. Best guess is that the SP will revert to the longer term trendline and settle at around 12p.
Having said all that I certainly wouldn't short MLR, the TA just isn't strong enough, but then I certainly wouldn't buy at the moment either. As I said in the first paragraph, these tiddlers really can shift on good or bad news and 30% moves in either direction negate TA full stop.
pth
mg
- 11 Jul 2007 17:00
- 22 of 504
pth
Here's my 5 entry fee. Actually I sneaked in earlier to take a look at this thread - came in whilst you wern't looking.
Good thread - should flush out some interesting observations - and am really looking forward to your TA - Thrush Analysis - I suspect it'll all come down to administering Canestan to help the irritating little infection :)
Haven't really spent much time on RSI - more an SMA, EMA, MACD man myself - but with SIMPLE being the basis of everything I do - even my underwear - if you know what I mean.
Bearing up under the other stuff BTW.
| About MoneyAM | Ts and Cs | Privacy Policy | Investment Warning | Content Standards | Corporate Solutions | Advertise With Us | Site Map | © 2026 MoneyAM |
Register now for FREE
Share Prices,
Stock Quotes,
Charts, Bulletin Boards, Indices, Watchlists, Portfolio, Market News, Research
or see our Premium Services including Level 2, Terminal and much more.