
| Home | Log In | Register | Our Services | My Account | Contact | Help |
You are NOT currently logged in
Register now or login to post to this thread.
Davai - 18 Apr 2012 11:13


Thread designed to record set-ups and targets on index and FX pairs.
'A market is only your enemy until you understand it, then it becomes your best friend.'
Any questions, please feel free to ask.
From time to time i may openly state an opinion regarding direction of a set-up and wish to add that in no way am i recommending a trade. I am sometimes only in trades for a matter of minutes and can't always update as to entry/exits taken.
As always, markets are dangerous places to be and must be respected as such. Always use stop losses and never over-leverage; 3% of your pot as a maximum per trade. As always, YOU are responsible for your own trades! Happy pip hunting!
Click HERE to visit me at FXtechnicals.net
Davai - 04 Feb 2013 14:19 - 304 of 423
Do i detect an air of cynicism perhaps?!
Iain


 - 04 Feb 2013 14:44
- 305 of 423
- 04 Feb 2013 14:44
- 305 of 423


Not at all
Davai - 04 Feb 2013 15:14 - 306 of 423
Lots of my charts make it look complicated, but generally they are for practice purposes and purely for an overall plan.
Here is a very simple formula for making money. Identify a trend (HH's/HL's etc), wait for a pullback.
Let's assume trend is up. Go down the timescale to determine a,b&c, using EW & Fibs, you should be able to determine end of 'C'.
Now look for minor 5w up/3w back down.
Go long at end of this minor abc, it will often retest a TL. Stop is a pip (plus spread) below prior larger 'C'. Sounds complicated, so here's a chart.

Fibs and EW channels can be used to dictate likely targets, but this was a 10 pip risk and easy 30+ pip gain. That's 1:3 R:R. Its scaleable, but for anyone who says, 'big deal, its only 30 pips', is misunderstanding the idea. Pips are not important, percentages are. If i had a 200 pip target on an hourly set-up, my risk would still have been the same, therefore why wait for hourly/daily set-ups, when they happen all the time on the 5min? If traded as a 1% risk, you would have claimed 3% gain. A max 3% risk would have netted 9% etc...
That's without being greedy, but its also possible using this method to get onboard a longer trend and use the 10MA (+20pips) as a trailing support for your stop.
Davai - 04 Feb 2013 18:30 - 307 of 423
Here's another... Draw a flagline off of previous peak connecting top of the minor 5w peak (wave 1), entry after breakout bar coincides with CCI trigger. Target is equal to risk. Stop is pip below lowest point of pullback;


Davai - 04 Feb 2013 18:36 - 308 of 423
12,499 possible place for bounce on EJ. Eu is obeying 10ma on hourly, usually indicates impulsive move as opposed to corrective. Inconclusive right now, but is sat on 61.8% retrace level of previous wave right now.
EJ also reached exactly 100% level of previous wave, (identical to the earlier Eu chart which reached 138.2% in same move). Have it down as 4th right now.
*Edit 12,479 is fib level
EJ also reached exactly 100% level of previous wave, (identical to the earlier Eu chart which reached 138.2% in same move). Have it down as 4th right now.
*Edit 12,479 is fib level
Davai - 04 Feb 2013 18:50 - 309 of 423
Chart for above, but EU is now lower in last few minutes;


Davai - 04 Feb 2013 18:59 - 310 of 423
Ok, 12,450 is 61.8% ext for minor 5th, Eu is exactly at 13,500 for 50% minor 5th ext...
Davai - 04 Feb 2013 20:00 - 311 of 423
Previous 5w end for FTSE;

X wave next, surely not in a 3rd?


X wave next, surely not in a 3rd?

Davai - 05 Feb 2013 08:23 - 312 of 423
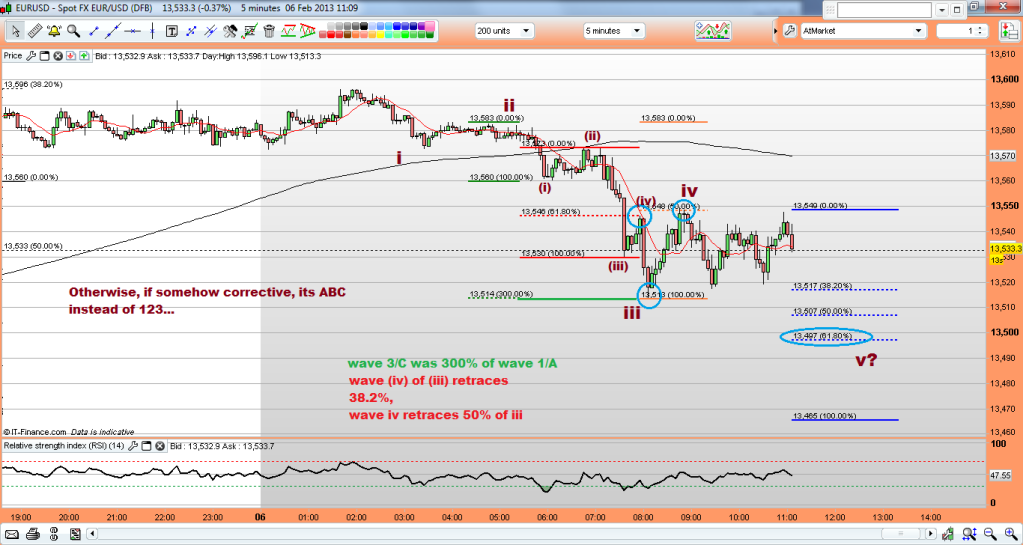
Post 309 EJ, where C=A or 3=1; the pullback in more detail;

So probable low already hit, or poss the lower blue circle yet, but then an up day, (provided no extensions), regardless of whether its 5 or B...
Watching for minor 5w/3w to confirm and looks like we already have the 5w...

So probable low already hit, or poss the lower blue circle yet, but then an up day, (provided no extensions), regardless of whether its 5 or B...
Watching for minor 5w/3w to confirm and looks like we already have the 5w...
Davai - 05 Feb 2013 09:08 - 313 of 423
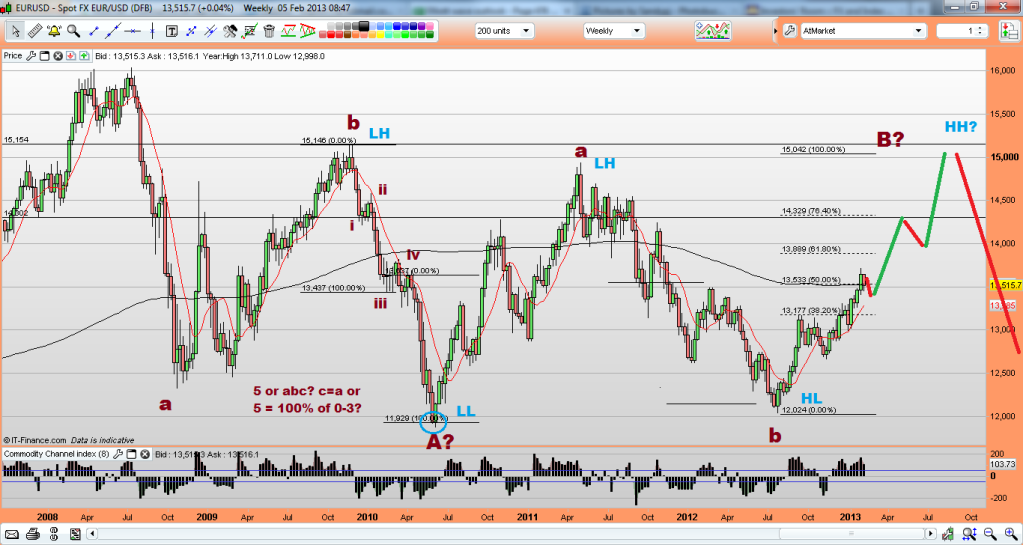
This whole Euro advance starting from a HL is bothering me, without having put a load of thought into this, it would be sensible to at least consider that a HL could/should be followed by a HH, i think the break of 13,490 (last sig high in Mar last year) was possibly an important factor too, as to confirming the last low is definitely a substantial low;

Davai - 05 Feb 2013 13:33 - 314 of 423
What the EU does in the next 10mins will (obviously) give further evidence, but if we are in an X wave, we have already completed wave A (yesterday) thus we can expect a 'B' to follow... 5-3-5 or 3-3-5, now this morning we have a 61.8% extension, after a pullback. I would normally think this to be a 5th (of the first 5w), but the pullback reached 38.2% of the whole move, so where is wave 1&2?! More likely to be two complete sets of a 5-3-5 (of an A wave) thus a 3w move and should be followed by a 3w B move, before a 5w C, follow?
Well, its speculative right now and more for a guesstimate than anything, but if we do now drop right back down, i will be looking to trade the ending of B for our C wave;

Well, its speculative right now and more for a guesstimate than anything, but if we do now drop right back down, i will be looking to trade the ending of B for our C wave;

Davai - 05 Feb 2013 16:32 - 315 of 423
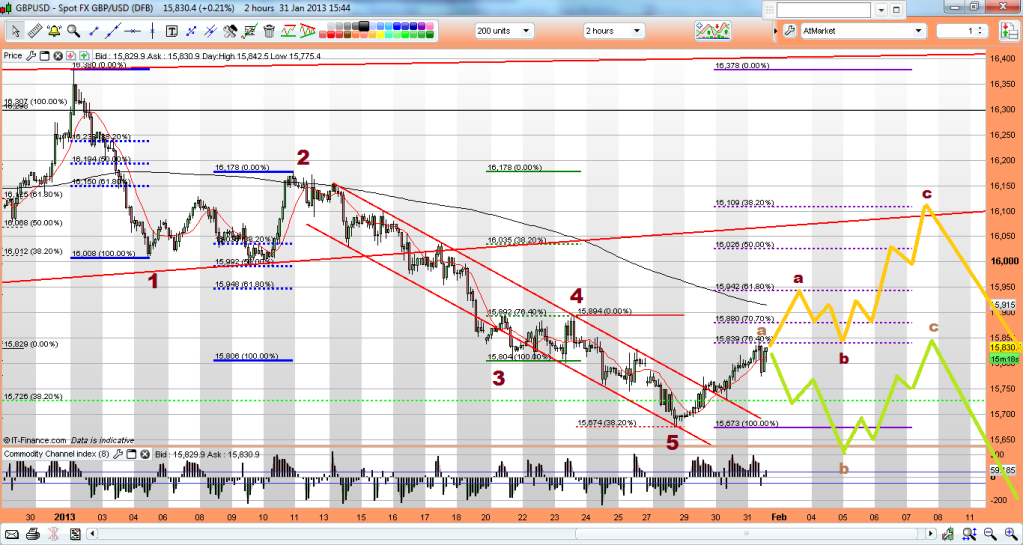
15,595 for a bounce; Cable...? Is 138.2% ext of wave A if this is an irreg, its also bottom of weekly wedge. Even if lower and a miscount, we would be well into a 5th. Cable is certainly a short, but i would love to see a C wave first come back up a few hundred pips...
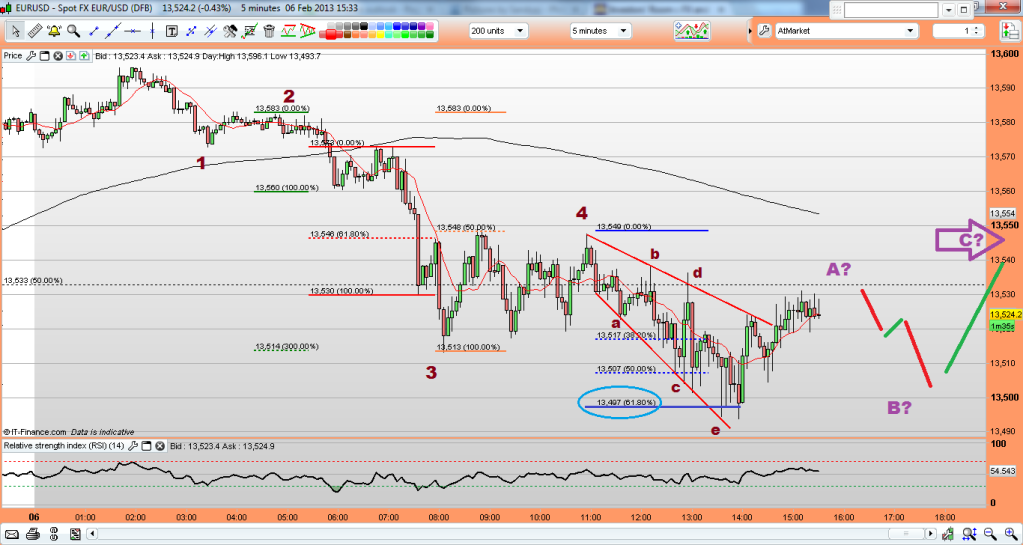
Davai - 06 Feb 2013 12:36 - 316 of 423
EU, not quite as deep as i was expecting, nonetheless;

How i perceive PA since;
and what i'm basing it on currently (although PA this week has been very difficult to follow);

I have earmarked it as an X wave, but there is no difference if this turns into a 5w move of a fresh impulsive move short, just label ab&c as 12&3, with 4&5 to come, its thereafter it changes massively as trend is now down, so after a 3w move back up, its short it into the pavement... i'm sure i heard that phrase somewhere before! )

How i perceive PA since;

and what i'm basing it on currently (although PA this week has been very difficult to follow);

I have earmarked it as an X wave, but there is no difference if this turns into a 5w move of a fresh impulsive move short, just label ab&c as 12&3, with 4&5 to come, its thereafter it changes massively as trend is now down, so after a 3w move back up, its short it into the pavement... i'm sure i heard that phrase somewhere before! )
Davai - 06 Feb 2013 15:17 - 317 of 423
I see other analysts are calling Cables current move as an ending diagonal. It would certainly look nicer than my count, however, mine will be more likely to be correct in the absence of a further LL;
Previously;

Its the way the fibs work so well, that i can overlook the feeble looking 4th (although it has worried me ever since!),
With that i ran a couple of predictions for likely abc's;
and as of last night;

Now you can see why others are labeling that last corrective as a 4th and current as an ending diagonal 5th, but so far it is clearly in 3 waves and not 5. So, they will now be expecting a complete abc long, whereas i will be expecting simply a 'C'... (this as i say, will be negated with a fresh low, but i have just made a 5w count long for today, (minor wave 1 of C), thus it doesn't look corrective... lets see, nothing set in stone, but following previous charts thus far...
Previously;

Its the way the fibs work so well, that i can overlook the feeble looking 4th (although it has worried me ever since!),
With that i ran a couple of predictions for likely abc's;

and as of last night;

Now you can see why others are labeling that last corrective as a 4th and current as an ending diagonal 5th, but so far it is clearly in 3 waves and not 5. So, they will now be expecting a complete abc long, whereas i will be expecting simply a 'C'... (this as i say, will be negated with a fresh low, but i have just made a 5w count long for today, (minor wave 1 of C), thus it doesn't look corrective... lets see, nothing set in stone, but following previous charts thus far...
Davai - 06 Feb 2013 15:31 - 318 of 423
With ref to Cable (above), i must say, it really looks to be struggling and certainly is making a meal of grinding any higher... i will keep an open mind!
Davai - 06 Feb 2013 15:41 - 319 of 423
EU on track so far, but again, looks to be struggling, its as if everything is desperate to die, i haven't even looked at the index's today... next thing on the agenda.
earlier;
and target was hit, looks currently as if 'A' will be inthree, so expect a deep (poss even irreg) 'B', before 'C'. Can't help thinking this will actually be impulsive and the top is in already, but that should become obvious with the degree and speed of the coming drop...
anyway, for now;
earlier;
and target was hit, looks currently as if 'A' will be inthree, so expect a deep (poss even irreg) 'B', before 'C'. Can't help thinking this will actually be impulsive and the top is in already, but that should become obvious with the degree and speed of the coming drop...
anyway, for now;

Davai - 06 Feb 2013 15:48 - 320 of 423
The minor 5w long i mentioned above for Cable, now really appears to be a 'C' wave, so lower we shall go and as i posted last night, the lower TL of our weekly wedge is at approx 15,600. I seriously can't see much strength happening, so a running/irregular corrective looks ominous, before the abyss below...
Davai - 06 Feb 2013 16:22 - 321 of 423
Cable;
Now i had it that the last move up hit its 61.8% retrace of the drop, ('B', which it does to the pip - blue circle), however, could the market be playing a trick, it is only a small handful of pips more than if it was the 61.8% of wave A (red circle); this would fit perfectly with my prev counts and also explain why Cable simply wont get any strength from here. So instead of an ending diagonal, (as others are calling it) with a corrective ABC move to come, we will actually be starting the 3rd of the 3rd? sounds like a plan?!

The small 4th is what would trick most, but it fits the fibs perfectly and recognising it hopefully is the difference here;
The current count as i see it;

Davai - 06 Feb 2013 19:30 - 322 of 423
If tomorrow is an up day, it will simply prolong the procedure in my eyes, The FTSE looks like its well through its abc corrective ready to drop as does the Euro and cable, however, they might drag it out to be bigger corrective moves such as this (Eu, the others similar);


Davai - 06 Feb 2013 20:12 - 323 of 423
Ref above, i think the earlier chart where we reached the 38.2% level of 5th ext first thing this morning is correct;
It means a slightly truncated top, but it fits. Hence the 5w short today would be wave 1;
followed by an abc wave 2;
If correct, tomorrow will be a down day on markets too, lets see...
It means a slightly truncated top, but it fits. Hence the 5w short today would be wave 1;
followed by an abc wave 2;
If correct, tomorrow will be a down day on markets too, lets see...
| About MoneyAM | Ts and Cs | Privacy Policy | Investment Warning | Content Standards | Corporate Solutions | Advertise With Us | Site Map | © 2026 MoneyAM |
Register now for FREE
Share Prices,
Stock Quotes,
Charts, Bulletin Boards, Indices, Watchlists, Portfolio, Market News, Research
or see our Premium Services including Level 2, Terminal and much more.