
| Home | Log In | Register | Our Services | My Account | Contact | Help |
You are NOT currently logged in
Live Crude & Gold 15 minute & Daily Charts. (OIL)
skinny

 - 12 Feb 2015 07:41


link to WTl price
link to Exchange Rates
link to GBP/USD
link to GBP/EUR
Brent Crude & West Texas Light Charts..
---------------------------------------------
BP. and RDSB Charts.
------------------------
Gold and Cable Charts.
--------------------------
Silver and Platinum Charts.
-------------------------------
GBP/USD
-----------
GBP/EUR
-----------
mentor - 26 Jul 2017 15:59 - 309 of 379
POO
spiking up and now moving over yesterday's high
spiking up and now moving over yesterday's high
skinny
- 31 Jul 2017 06:01
- 310 of 379
skinny
- 31 Jul 2017 11:54
- 311 of 379
mentor - 10 Aug 2017 09:44 - 312 of 379
Crude Oil Prices Stuck in a Triangle Consolidation - Aug 9, 2017 2:44 pm - Jeremy Wagner,
Crude oil prices have been range bound for the past year between $39 and $55. The model we are following suggests continued consolidation between these two price points over the coming months.
The Elliott Wave model we are following points towards a developing triangle formation for the past year. According to this model, prices are nearing the end of the fourth leg of the triangle (the ‘d’ leg). According to Elliott Wave theory, that would suggest another dip down the road that becomes a partial retracement of this June 2017 up trend. That final dip becomes the ‘e’ leg or the terminal wave of the triangle.
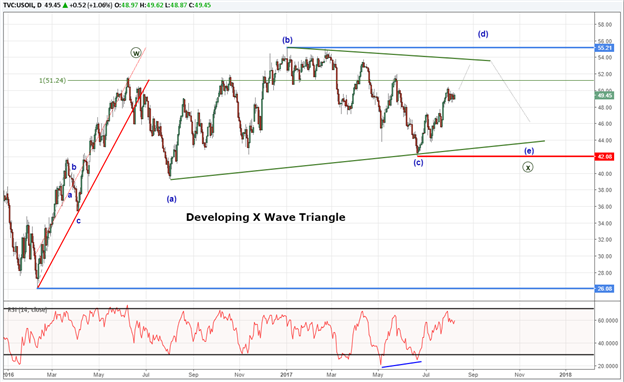
Crude Oil Prices Stuck in a Triangle Consolidation
This triangle pattern is valid so long as this current rise is contained under the 2017 high of $55.21 while holding above the June 2017 low of $42.08. Therefore, we are anticipating a dip to begin from slightly higher prices. This dip could work itself back towards the mid 40’s.
This triangle pattern as labeled is a bullish triangle. Once the triangle pattern exhausts, we are anticipating a bullish breakout to above $55.21. Therefore, since the consolidation appears to be a pause of the previous uptrend, trend traders may want to follow a buy the dip strategy.
Bottom line, look for the current rise in prices to give way to a partial retracement lower that digs towards the mid 40’s. A break below $42.08 will cause the current wave labeling to be invalid and we will reconsider the wave picture at that time. If the current labeling is correct, we are anticipating an eventual break above $55.21 that begins from the mid 40’s.
Crude oil prices have been range bound for the past year between $39 and $55. The model we are following suggests continued consolidation between these two price points over the coming months.
The Elliott Wave model we are following points towards a developing triangle formation for the past year. According to this model, prices are nearing the end of the fourth leg of the triangle (the ‘d’ leg). According to Elliott Wave theory, that would suggest another dip down the road that becomes a partial retracement of this June 2017 up trend. That final dip becomes the ‘e’ leg or the terminal wave of the triangle.
Crude Oil Prices Stuck in a Triangle Consolidation
This triangle pattern is valid so long as this current rise is contained under the 2017 high of $55.21 while holding above the June 2017 low of $42.08. Therefore, we are anticipating a dip to begin from slightly higher prices. This dip could work itself back towards the mid 40’s.
This triangle pattern as labeled is a bullish triangle. Once the triangle pattern exhausts, we are anticipating a bullish breakout to above $55.21. Therefore, since the consolidation appears to be a pause of the previous uptrend, trend traders may want to follow a buy the dip strategy.
Bottom line, look for the current rise in prices to give way to a partial retracement lower that digs towards the mid 40’s. A break below $42.08 will cause the current wave labeling to be invalid and we will reconsider the wave picture at that time. If the current labeling is correct, we are anticipating an eventual break above $55.21 that begins from the mid 40’s.
skinny
- 23 Aug 2017 09:19
- 313 of 379
Not a pretty sight!

mentor - 18 Sep 2017 10:45 - 314 of 379
Some more bounce today as WTl price reaches $50 and moves over
mentor - 20 Sep 2017 15:25 - 315 of 379
OIL spiking up again and now $50.60
Much the same for Sterling
Much the same for Sterling
skinny
- 21 Sep 2017 15:39
- 316 of 379

HARRYCAT
- 25 Sep 2017 19:36
- 317 of 379
Brent Crude just touched $60pb
skinny
- 27 Oct 2017 16:02
- 318 of 379
Brent @$60 earlier.

skinny
- 30 Oct 2017 07:58
- 319 of 379

skinny
- 06 Nov 2017 09:21
- 320 of 379
skinny
- 06 Nov 2017 09:33
- 321 of 379
skinny
- 13 Nov 2017 12:35
- 322 of 379
skinny
- 15 Nov 2017 16:55
- 323 of 379
skinny
- 06 Dec 2017 15:31
- 324 of 379
USD Crude Oil Inventories -5.6M -3.2M -3.4M
skinny
- 10 Jan 2018 05:49
- 325 of 379
skinny
- 01 Feb 2018 12:55
- 326 of 379

skinny
- 14 Feb 2018 15:42
- 327 of 379
USD Crude Oil Inventories 1.8M 2.8M 1.9M
skinny
- 28 Feb 2018 11:11
- 328 of 379
| About MoneyAM | Ts and Cs | Privacy Policy | Investment Warning | Content Standards | Corporate Solutions | Advertise With Us | Site Map | © 2026 MoneyAM |
Register now for FREE
Share Prices,
Stock Quotes,
Charts, Bulletin Boards, Indices, Watchlists, Portfolio, Market News, Research
or see our Premium Services including Level 2, Terminal and much more.