
| Home | Log In | Register | Our Services | My Account | Contact | Help |
You are NOT currently logged in
Register now or login to post to this thread.
Davai - 18 Apr 2012 11:13


Thread designed to record set-ups and targets on index and FX pairs.
'A market is only your enemy until you understand it, then it becomes your best friend.'
Any questions, please feel free to ask.
From time to time i may openly state an opinion regarding direction of a set-up and wish to add that in no way am i recommending a trade. I am sometimes only in trades for a matter of minutes and can't always update as to entry/exits taken.
As always, markets are dangerous places to be and must be respected as such. Always use stop losses and never over-leverage; 3% of your pot as a maximum per trade. As always, YOU are responsible for your own trades! Happy pip hunting!
Click HERE to visit me at FXtechnicals.net
Davai - 07 Feb 2013 08:05 - 325 of 423
EU,
Waiting for a low risk entry;

Ok, might look a bit confusing, but i will try to explain my point. At the moment we have completed a (small) 5w long on the EU, this was expected as per prev charts as a 'C' wave, however, it could still be, simply of a larger wave 1 and thus still 4 more waves to come (typically as in the top purple circle. With the thinking in mind that this will be corrective, we shouldn't break the high of Tuesday, therefore if a count takes us up there, we can enter short near this point, with our stop a pip (plus spread) above the high, (stop2).
In the lower purple circle option, it would mean the minor 5w was our C wave completed. It is roughly the 76.4% fib of A, but not conclusive (and not a favourite fib level for me), however, if we drop, we should wait for a decisive break of the red TL, as this would likely indicate AB&C were complete. Our stop goes a pip above the peak of 'C'(stop1). The middle ground is higher risk, both in pips and evidence...
If the trade is wrong, at least we have minimised risk and/or maximised evidence.
Davai - 07 Feb 2013 08:44 - 326 of 423
For me, looking at the current strength of the EU, it concerns me that it is a scenario playing out as in post 322, therefore the stop2 in last post will not be safe. Its too risky and i haven't seen a clear 4th wave yet, whereas Cable, is nearly good to go for the end of our C wave. It may extend into low 15,700's, but the 38.2% retrace of last drop is at 15,697...
*edit*, still printing 4th right now i think;

Will be trying to follow the 5th on small timescale to determine likely end. The speed of the rise is likely to deter, but must be respected, tight stops are order of the day, in case the count is wrong...
*edit*, still printing 4th right now i think;

Will be trying to follow the 5th on small timescale to determine likely end. The speed of the rise is likely to deter, but must be respected, tight stops are order of the day, in case the count is wrong...
Davai - 07 Feb 2013 08:55 - 327 of 423
Ok, now we have crossover with Cable, so perhaps something like this instead;


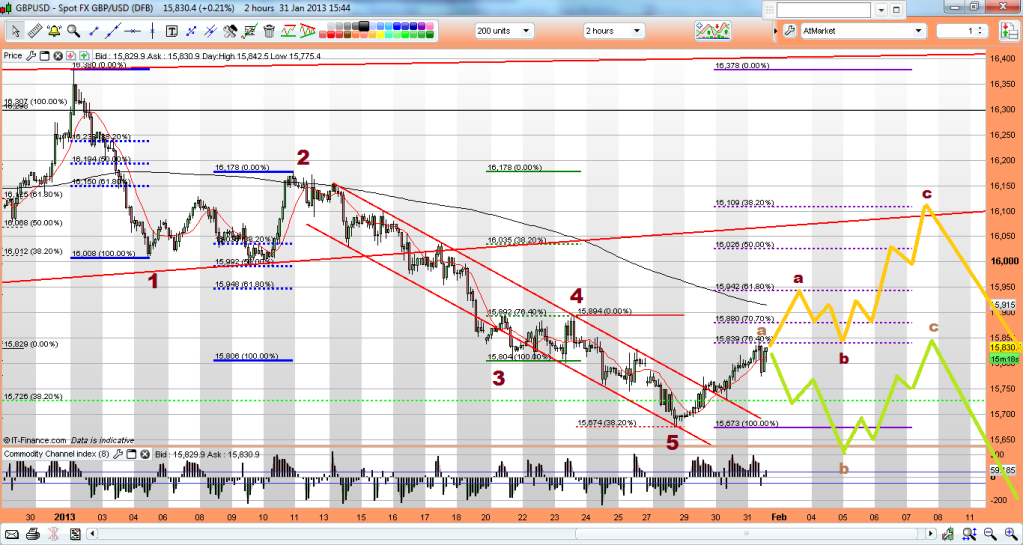
Davai - 07 Feb 2013 09:05 - 328 of 423
Each leg of the abcde is broken down again into 3w (abc), there will likely be a fib relationship between a&c of each, more difficult to spot in the smaller ones, but in the last, c was 138.2% of a, (had me thinking it was the wave 3 relating to wave 1), i will also be watching this if it does follow the chart for our wave e, for a clue hopefully indicating a common level ending at approx 15,700
Davai - 07 Feb 2013 13:37 - 329 of 423
Ah, always the same! Just as you think you've got a good trade! Well, that spike is still well within rights of a C wave, indeed, it looks like a further high to come later. However, whichever way you look at it, it is strength and must be respected as such. No trade until i can recognise something fresh...
If it takes three factors to line up for a good trade, then two factors doesn't cut it. discipline discipline dicsipline... speeling test
If it takes three factors to line up for a good trade, then two factors doesn't cut it. discipline discipline dicsipline... speeling test
Davai - 07 Feb 2013 14:29 - 330 of 423
So, not sure if anyone is following but the earlier advice was sound i believe! Cable may be joining in the fun now, but the euro is where the party is at;
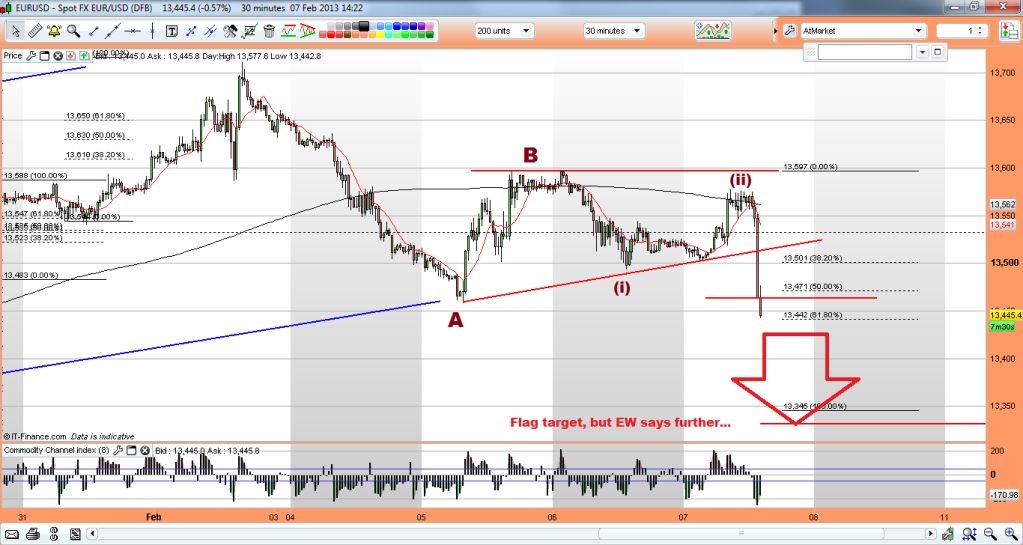
Overall pic;

wait for low risk entry;
and a lovely flag trade too;
Overall pic;

wait for low risk entry;
and a lovely flag trade too;

Davai - 07 Feb 2013 14:59 - 331 of 423
FWIW, Cable, (for now at least), is certainly not doing what i expected and although it hasn't broken any particular rules to conform with my count, i am now expecting my prior count to be proved wrong. The EU does make up for it, so will have to make do!
Davai - 07 Feb 2013 16:49 - 332 of 423

Davai - 08 Feb 2013 08:46 - 333 of 423
Trend now well and truly down for the EJ. We are near, or possibly have just completed 5waves down from the top daily TL, where we finished our 5w cycle of the 5th. At this stage its inconclusive as to whether it was the overall 5th or the 5th of the overall 3rd.
The top Daily TL is drawn off what should be waves 2&4, therefore it suggests it was the overall top.
The action since then as of the 5th wave is now complete;
Wave 3 was 100% of wave 1
Wave 4 retraced 50% of wave 3
Wave 5 reached the top TL and approx 38.2% ext
We now have a nice 5w count short;
Wave 3 was 161.8% of wave 1
Wave 4 retraced 38.2% of wave 3
Wave 4 also retested the break of the Green TL overnight
Wave 5 has now reached its 61.8% ext
Caution as the 5th may extend yet.
Once complete, we will now correct back up in 3 wave abc, but the least we will have after this is another 5w short and poss, this is complete trend change for the foreseeable future. I will be looking to short this pair after each abc retrace.

Davai - 08 Feb 2013 09:17 - 334 of 423
In virtually the time it took to draw the chart, post it along with the above update, go and make a cup of tea, i see it has already bounced some 100 pips from the 61.8% level i have on the chart for its 5th wave target. Doesn't look like any extension! Wow, it loves to move, so i will be leaving wave A and B, but by then we will know if a zigzag,flat etc and can trade the C wave long with the benefit of our fibs from wave A... Capiche?
Davai - 08 Feb 2013 09:26 - 335 of 423
Anybody interested in my FTSE view?
Iain


 - 08 Feb 2013 09:52
- 336 of 423
- 08 Feb 2013 09:52
- 336 of 423


Go on then
My tea leaves say 5080
My tea leaves say 5080
Davai - 08 Feb 2013 10:15 - 337 of 423
Well, i don't want to try to predict too far in advance. The last chart showed a clear end of 5w;

and that of this daily cycle Y=W;

So the least we can expect is a decent correction in the form of an X wave;

I can only highlight what i see, so what you do with anything shown is up to you! But it looks very much like a complex correction so far. The fact that we appear to have had two lots of abc moves, with the 2nd ('b') reaching 123.6% of the first set ('a').
Next comes a 5w ('c') long. Its difficult to determine where this will end and i see we have already reacted off of the 61.8% fib level of 'a'. Seeing the 100% at 6299, i thought that would have been the obvious target, but if this count is correct we will go down (imo) in either a C wave or a wave 3...
*edit* (obviously i meant '3/C' in the chart!)
Davai - 08 Feb 2013 10:21 - 338 of 423
If it is a smaller count then its possible we are in some kind of ending diagonal right now with the above blue 'a' being red 'b' instead. Its the fact that we hit the 123.6% so precisely for 'b', that makes me think otherwise...
Davai - 08 Feb 2013 10:38 - 339 of 423
Isn't it strange how charting can coincide with fundamentals? I read this article earlier about Aso stating that the Yen had weakened more than they expected, which would back up the analysis that the Yen is to strengthen further;
http://www.reuters.com/article/2013/02/08/japan-economy-aso-idUSL4N0B84SR20130208
http://www.reuters.com/article/2013/02/08/japan-economy-aso-idUSL4N0B84SR20130208
Davai - 08 Feb 2013 13:15 - 340 of 423
Previous Cable count now back to plan A for now, as per lower prediction;
If it is indeed wave C right now, its being a b*st*rd and fairly unreadable. Fibs of 'A' in following chart, but its becoming vague. The 123.6% lines up with double top and 70.7% level of whole 5w move @ 15,880, 100% just above @ 15,833, but it can go way higher and still be valid if it so desires;
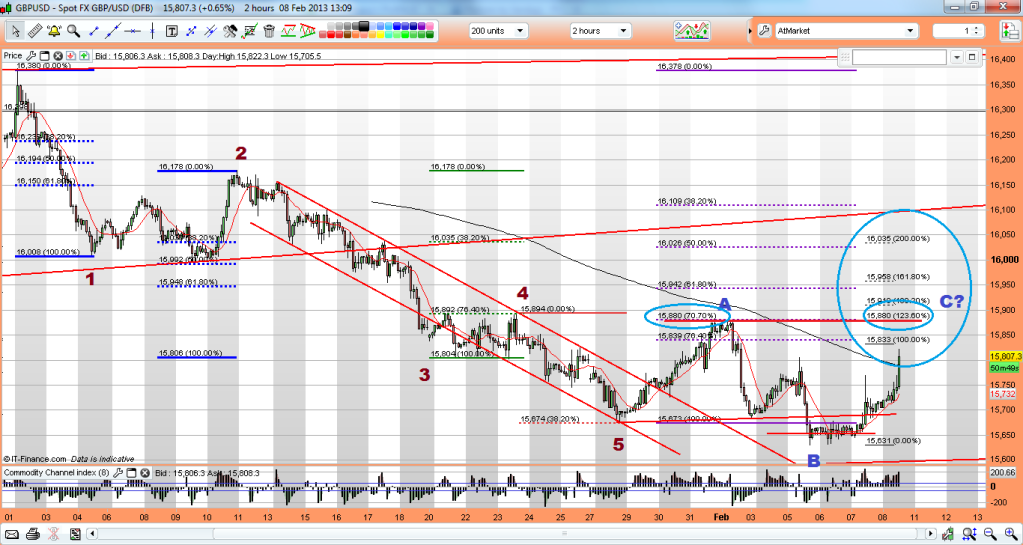

If it is indeed wave C right now, its being a b*st*rd and fairly unreadable. Fibs of 'A' in following chart, but its becoming vague. The 123.6% lines up with double top and 70.7% level of whole 5w move @ 15,880, 100% just above @ 15,833, but it can go way higher and still be valid if it so desires;

Davai - 08 Feb 2013 13:23 - 341 of 423
Cables inverse relationship to the FTSE at present also backs up more downside to come for the index...
Davai - 08 Feb 2013 16:04 - 342 of 423
I have the GJ as in a 5th of a 5th, an impulse wave and hence should head higher, whereas i'm expecting 5w short to come later on the EJ... surely short EurGbp would be a good choice, or poss even long Cable, even now after recent move...
Davai - 08 Feb 2013 16:22 - 343 of 423
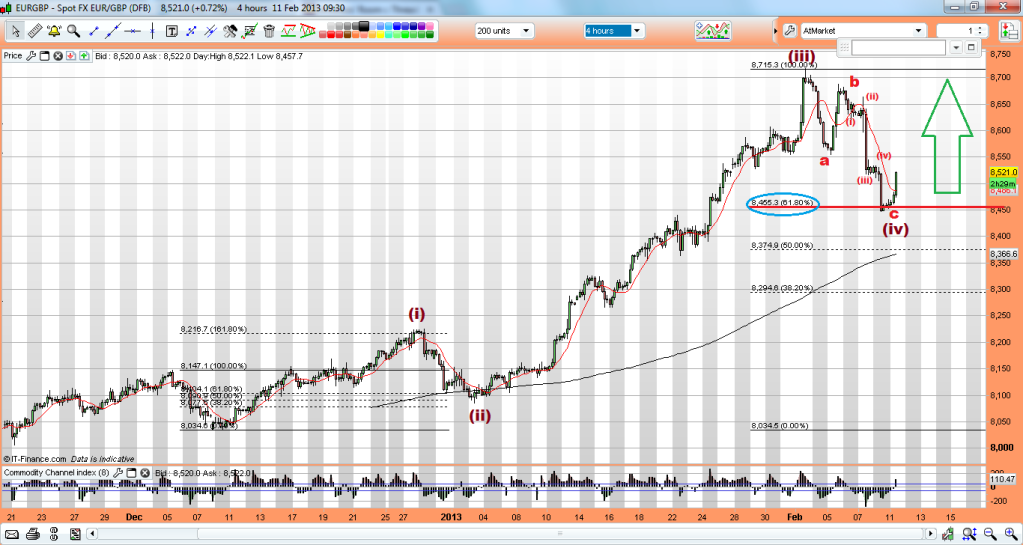
Yep, i hadn't even looked. I would need to put a load of studying time into the EurGbp to work out where it is and i simply don't trade it. It's looks like its actually at (or very close to an end of its cycle), so will be long again... scrap the above...
What that means for the EJ while i'm thinking the GJ has further to go, i will have to look into a bit further.
What that means for the EJ while i'm thinking the GJ has further to go, i will have to look into a bit further.
Davai - 11 Feb 2013 09:36 - 344 of 423
Chart for above ('long again EurGbp');

| About MoneyAM | Ts and Cs | Privacy Policy | Investment Warning | Content Standards | Corporate Solutions | Advertise With Us | Site Map | © 2026 MoneyAM |
Register now for FREE
Share Prices,
Stock Quotes,
Charts, Bulletin Boards, Indices, Watchlists, Portfolio, Market News, Research
or see our Premium Services including Level 2, Terminal and much more.