
| Home | Log In | Register | Our Services | My Account | Contact | Help |
You are NOT currently logged in
Register now or login to post to this thread.
Davai - 18 Apr 2012 11:13


Thread designed to record set-ups and targets on index and FX pairs.
'A market is only your enemy until you understand it, then it becomes your best friend.'
Any questions, please feel free to ask.
From time to time i may openly state an opinion regarding direction of a set-up and wish to add that in no way am i recommending a trade. I am sometimes only in trades for a matter of minutes and can't always update as to entry/exits taken.
As always, markets are dangerous places to be and must be respected as such. Always use stop losses and never over-leverage; 3% of your pot as a maximum per trade. As always, YOU are responsible for your own trades! Happy pip hunting!
Click HERE to visit me at FXtechnicals.net
Davai - 08 Feb 2013 09:17 - 334 of 423
In virtually the time it took to draw the chart, post it along with the above update, go and make a cup of tea, i see it has already bounced some 100 pips from the 61.8% level i have on the chart for its 5th wave target. Doesn't look like any extension! Wow, it loves to move, so i will be leaving wave A and B, but by then we will know if a zigzag,flat etc and can trade the C wave long with the benefit of our fibs from wave A... Capiche?
Davai - 08 Feb 2013 09:26 - 335 of 423
Anybody interested in my FTSE view?
Iain


 - 08 Feb 2013 09:52
- 336 of 423
- 08 Feb 2013 09:52
- 336 of 423


Go on then
My tea leaves say 5080
My tea leaves say 5080
Davai - 08 Feb 2013 10:15 - 337 of 423
Well, i don't want to try to predict too far in advance. The last chart showed a clear end of 5w;

and that of this daily cycle Y=W;

So the least we can expect is a decent correction in the form of an X wave;

I can only highlight what i see, so what you do with anything shown is up to you! But it looks very much like a complex correction so far. The fact that we appear to have had two lots of abc moves, with the 2nd ('b') reaching 123.6% of the first set ('a').
Next comes a 5w ('c') long. Its difficult to determine where this will end and i see we have already reacted off of the 61.8% fib level of 'a'. Seeing the 100% at 6299, i thought that would have been the obvious target, but if this count is correct we will go down (imo) in either a C wave or a wave 3...
*edit* (obviously i meant '3/C' in the chart!)
Davai - 08 Feb 2013 10:21 - 338 of 423
If it is a smaller count then its possible we are in some kind of ending diagonal right now with the above blue 'a' being red 'b' instead. Its the fact that we hit the 123.6% so precisely for 'b', that makes me think otherwise...
Davai - 08 Feb 2013 10:38 - 339 of 423
Isn't it strange how charting can coincide with fundamentals? I read this article earlier about Aso stating that the Yen had weakened more than they expected, which would back up the analysis that the Yen is to strengthen further;
http://www.reuters.com/article/2013/02/08/japan-economy-aso-idUSL4N0B84SR20130208
http://www.reuters.com/article/2013/02/08/japan-economy-aso-idUSL4N0B84SR20130208
Davai - 08 Feb 2013 13:15 - 340 of 423
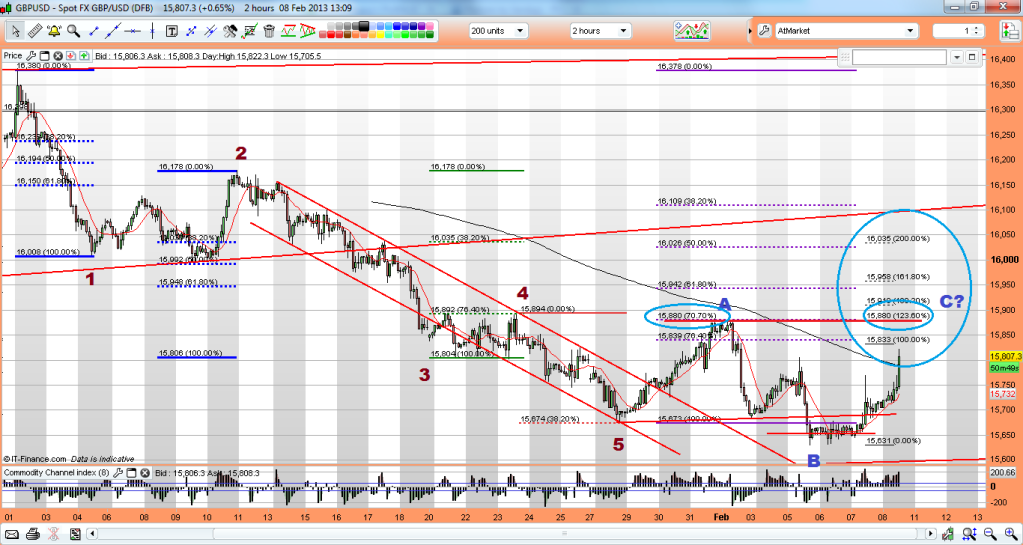
Previous Cable count now back to plan A for now, as per lower prediction;
If it is indeed wave C right now, its being a b*st*rd and fairly unreadable. Fibs of 'A' in following chart, but its becoming vague. The 123.6% lines up with double top and 70.7% level of whole 5w move @ 15,880, 100% just above @ 15,833, but it can go way higher and still be valid if it so desires;

If it is indeed wave C right now, its being a b*st*rd and fairly unreadable. Fibs of 'A' in following chart, but its becoming vague. The 123.6% lines up with double top and 70.7% level of whole 5w move @ 15,880, 100% just above @ 15,833, but it can go way higher and still be valid if it so desires;

Davai - 08 Feb 2013 13:23 - 341 of 423
Cables inverse relationship to the FTSE at present also backs up more downside to come for the index...
Davai - 08 Feb 2013 16:04 - 342 of 423
I have the GJ as in a 5th of a 5th, an impulse wave and hence should head higher, whereas i'm expecting 5w short to come later on the EJ... surely short EurGbp would be a good choice, or poss even long Cable, even now after recent move...
Davai - 08 Feb 2013 16:22 - 343 of 423
Yep, i hadn't even looked. I would need to put a load of studying time into the EurGbp to work out where it is and i simply don't trade it. It's looks like its actually at (or very close to an end of its cycle), so will be long again... scrap the above...
What that means for the EJ while i'm thinking the GJ has further to go, i will have to look into a bit further.
What that means for the EJ while i'm thinking the GJ has further to go, i will have to look into a bit further.
Davai - 11 Feb 2013 09:36 - 344 of 423
Chart for above ('long again EurGbp');
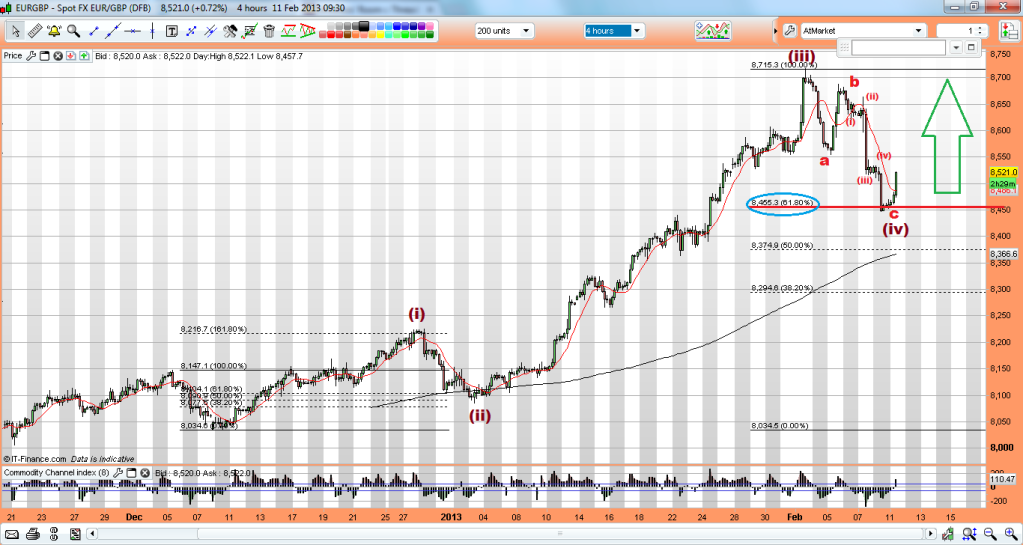

Davai - 11 Feb 2013 09:46 - 345 of 423
Something i mentioned last week with ref to the FTSE 'surely not' being in a 3rd wave. It does look a lot to me as if we are in an extending 5th wave, thus this pullback is indeed the 4th of the 3rd (of the 5th), so not only the 5th of the 3rd to come this year, but also the 4th&5th subwaves of the overall larger 5th too. Its not actually making the 5th easy to predict and i certainly don't like my ('i') placement, it doesn't look like a leading diagonal, so perhaps and irreg 'b' instead etc, still, if it ends up looking like this, we will see 7000+ before the turn...


Davai - 12 Feb 2013 10:48 - 346 of 423
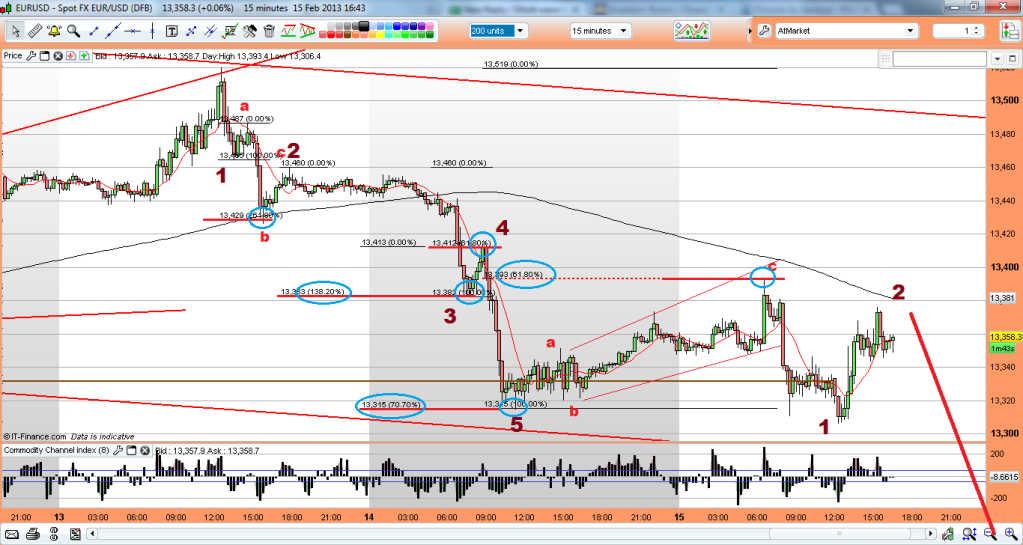
Returning to Cable;
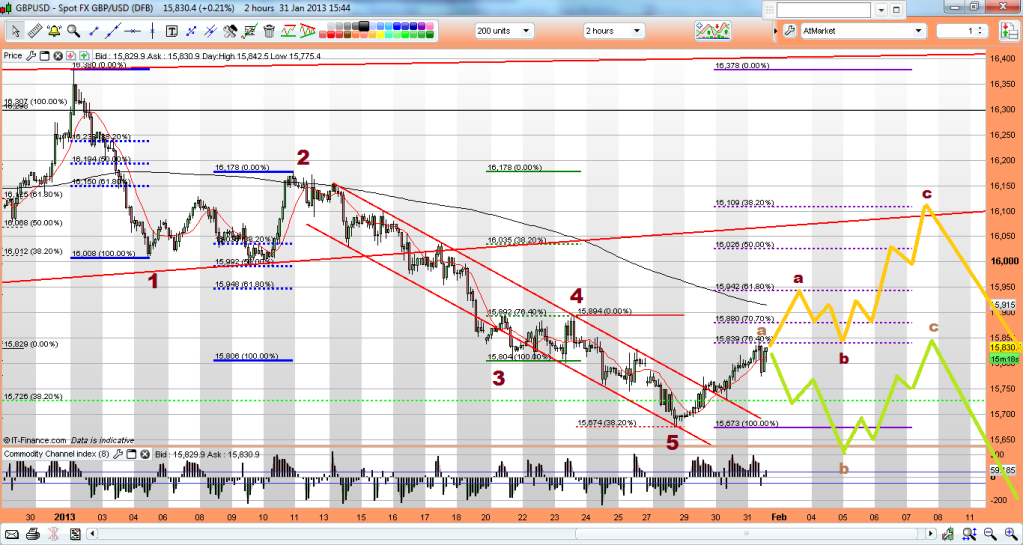
As stated before, the last count was slightly out, so we revert back to previous, lower green projection was the route (from 31st Jan);
Predicting end of 'C' was too tricky and i missed with my 123.6% prediction, (8th Feb);
It reacted off of the 100% level of A and the 23.6% retrace of entire 5w move.
Now we have our fresh wave 1 (of the 3rd i am expecting). There is zero strength about for it at the mo. We have punched through the weekly wedge (according to my charts at least) which has lasted 4 years or so.
The hourly shows a 5w count, with wave 3 reaching 261.8% of wave 1 and wave 5 hitting its channel line projection;
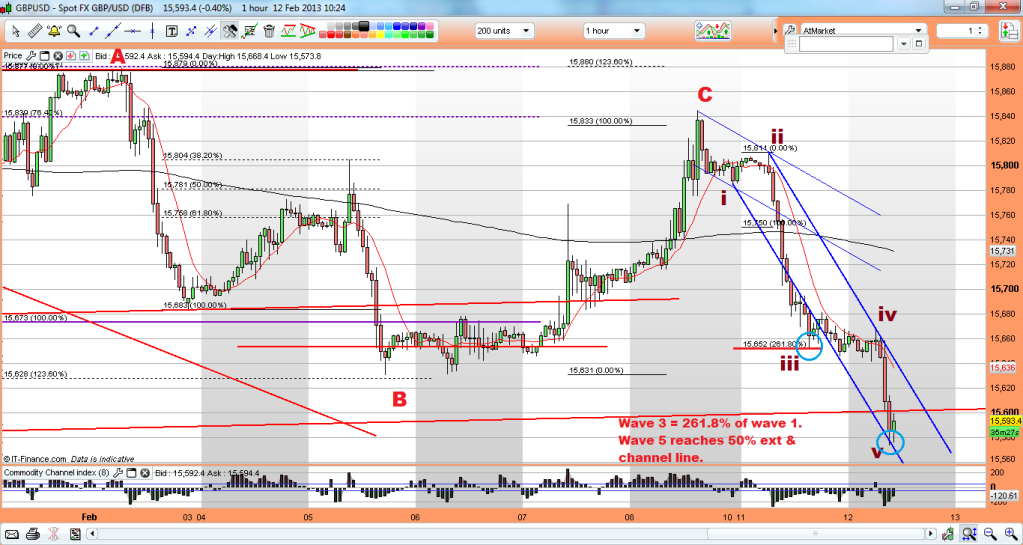
breaking down waves 4&5 on the 2min, i have the 5th reaching the 50% extension whilst simultaneously also reaching its own 61.8% minor 5th;

The immediate observation is though, that it isn't going back up!!!
Davai - 14 Feb 2013 11:44 - 347 of 423
Euro, been a bit tough to follow recently, i overlooked my earlier post. This was my old trading system, but requires too much discretion. In my quest to learn which phase the market is in and thus which flags work (and which do not), i moved onto EW!
Last week... break of flagline, risk = target;
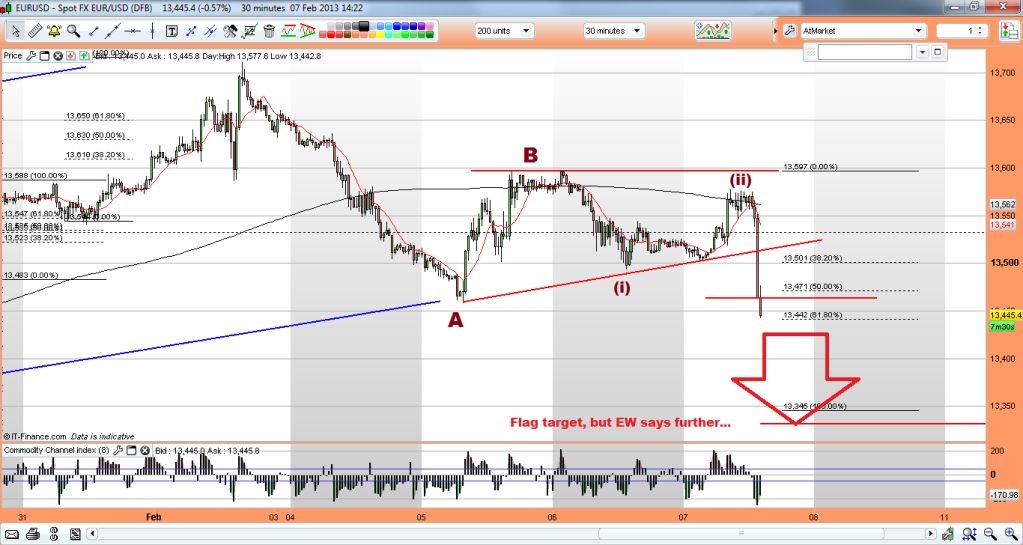
A nasty pullback inbetween, but... et voila;
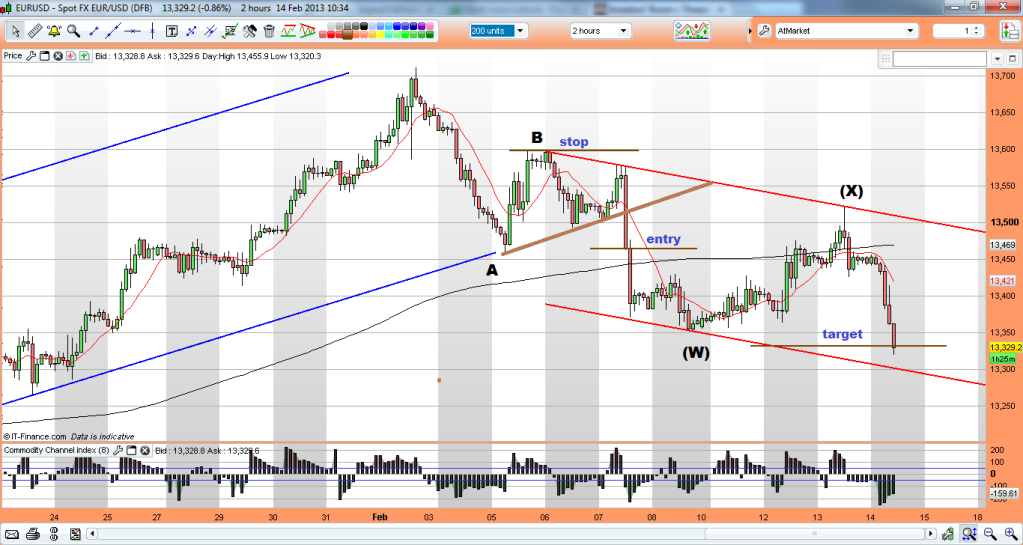
Last week... break of flagline, risk = target;

A nasty pullback inbetween, but... et voila;

Davai - 14 Feb 2013 11:45 - 348 of 423
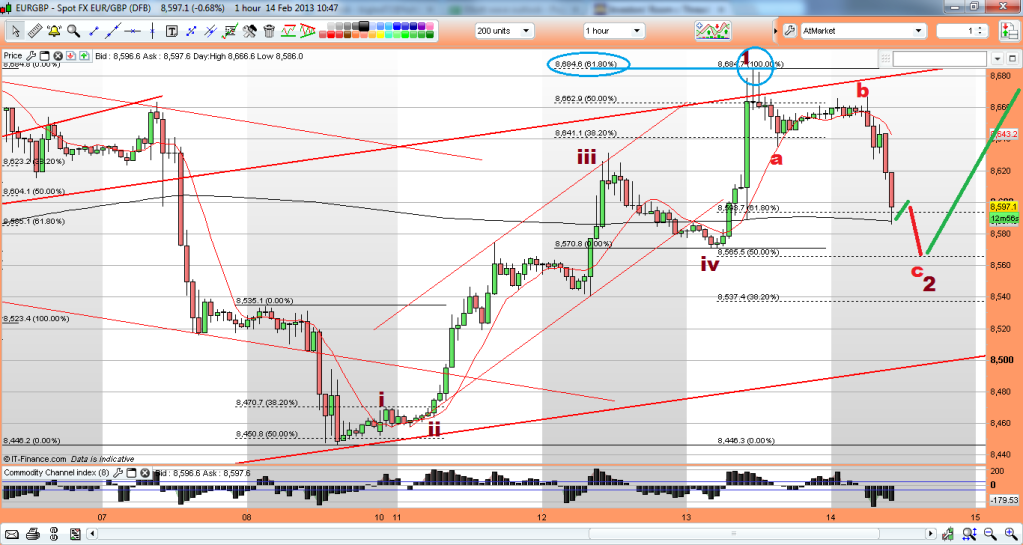
EurGbp, completed 5w cycle and now a good way through its corrective move;

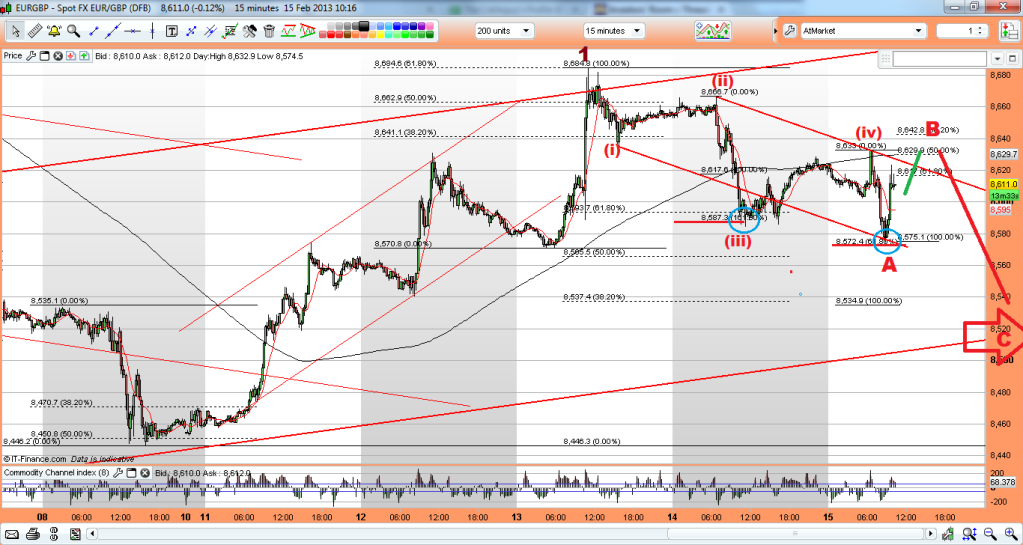
Davai - 15 Feb 2013 10:25 - 349 of 423
EurGbp, now looks to have become a larger ABC, so will be looking out for a poss diagonal as this is a 5th wave. 'A' breaks down into 5w;

Davai - 15 Feb 2013 19:11 - 350 of 423
Couple other ideas saying weakness in Euro short term;
EJ poss;
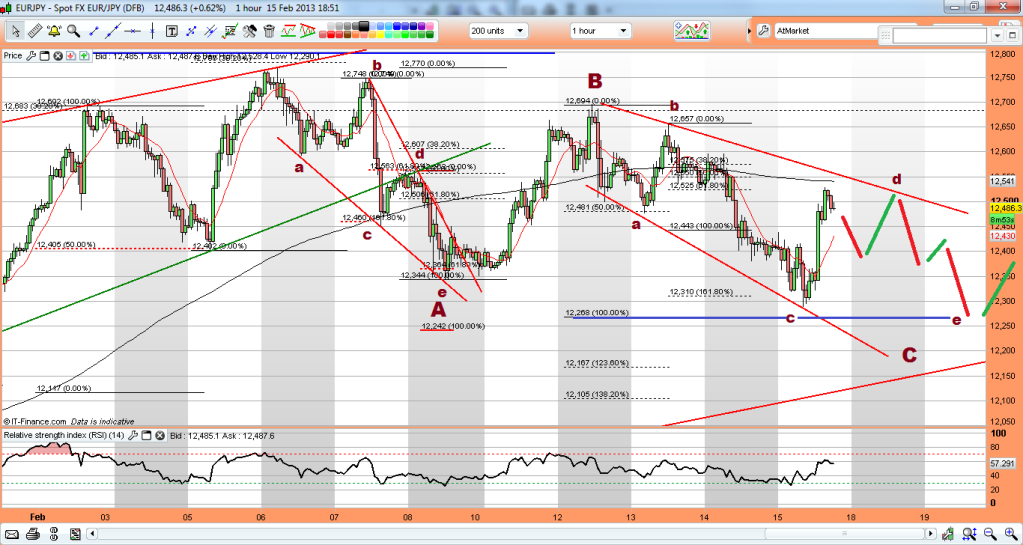
and i also have a slightly different view to the obvious as a label for the Euro (current cycle), i don't like the structure of this count, but i do very much like the way the fibs line up, so difficult to trade with confidence, but worth watching;
EJ poss;

and i also have a slightly different view to the obvious as a label for the Euro (current cycle), i don't like the structure of this count, but i do very much like the way the fibs line up, so difficult to trade with confidence, but worth watching;

Davai - 18 Feb 2013 08:44 - 351 of 423
Down day for the FTSE?

The safer bet is to wait for a break of point 'i', in case the entire 5w 'C' was a short leg and indeed as i have labelled 'i'.

The safer bet is to wait for a break of point 'i', in case the entire 5w 'C' was a short leg and indeed as i have labelled 'i'.
Davai - 19 Feb 2013 14:37 - 352 of 423
Right, lets try and right a few wrongs. Ref the above, at the time the small (apparent 5w) point 'i', didn't conform to fib of entire 'A', so i didn't consider it to be complete 'C', however, it now appears to have been wave 'a' of larger 'C' being a diagonal. It looks horrible, but the ending at exactly 61.8% of 'A' is too good to be coincidental and PA since makes a HH, so this looks to be the case. Correction over and a fresh impulse wave up? or just a larger A wave and now in B? or even.... a complex B which has just ended, with C to follow? Only a clear count down next will tell, if in 5w its start of C, if in 3 its corrective wave 2 and we have higher to come. Lets hope PA is kind to us...

Considering how easy to spot waves A&B were, it was only right that C was a cock.
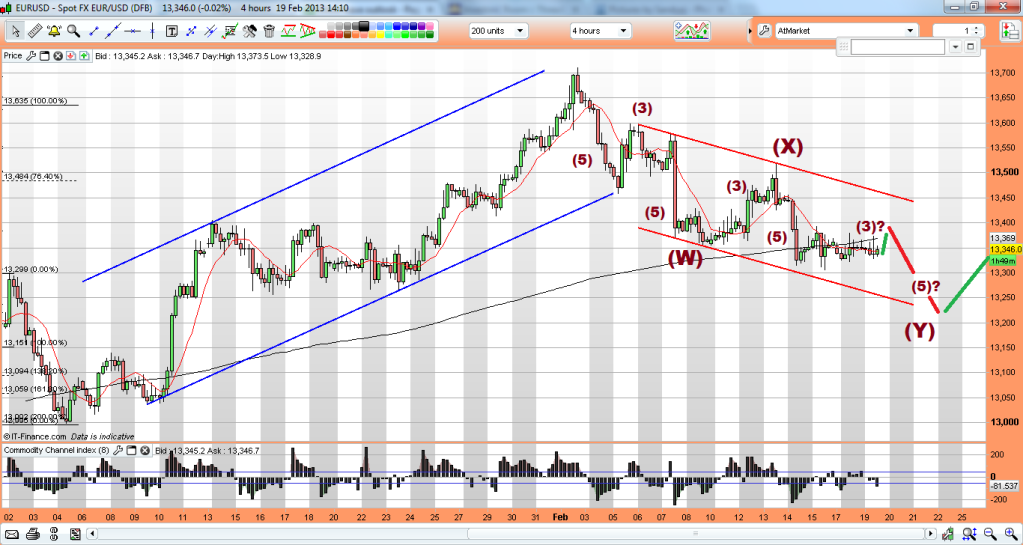
Elsewhere, loads of complex moves are making it really slow going. Moving to a larger view, i'm still of the opinion that the Euro has 5w short to make yet (with room for a little more upside yet);

Considering how easy to spot waves A&B were, it was only right that C was a cock.
Elsewhere, loads of complex moves are making it really slow going. Moving to a larger view, i'm still of the opinion that the Euro has 5w short to make yet (with room for a little more upside yet);

Davai - 20 Feb 2013 09:33 - 353 of 423
Mistakes coming thick and fast lately, luckily they haven't cost me anything other than probable lost earnings.
The two enemies of Elliotticians are irregular B waves and short (truncated) waves, (C in particular). I have fallen foul of labeling the recent 5w short move on the EurGbp as wave A, when in fact, it was wave C following an irregular B;
The original count;
The mad thing was i ignored the obvious 4th wave of wave 1 and even had the 5th reaching its upper channel TL at around midday on the 12th.
The reason for doing so was that the following rise hit exactly 61.8% ext of prior move (indicating it likely a 5th wave). It fell inbetween the 161.8% & 200% ext levels of what now has to be wave A (and not 4).
Thus the new count;
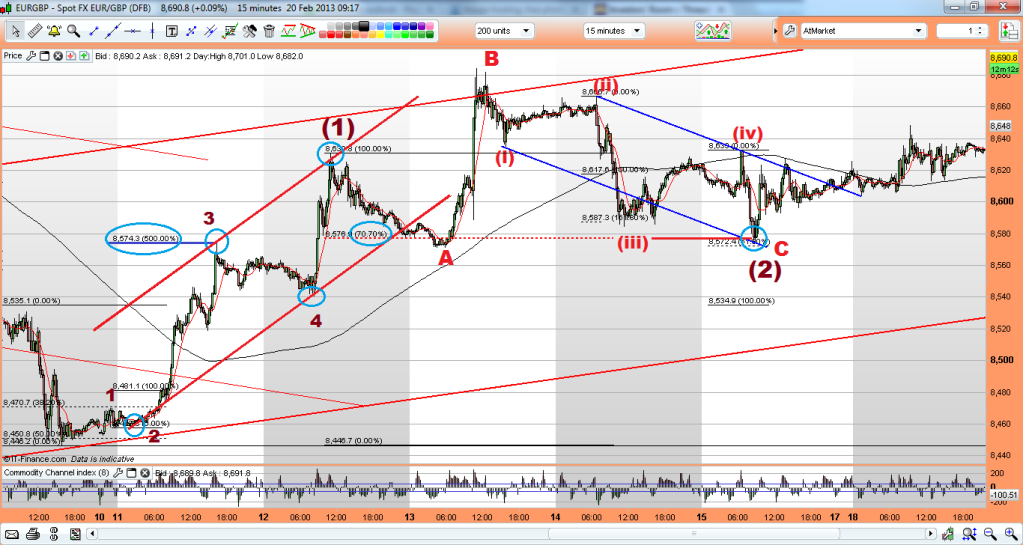
Unfortunately it is only subsequent PA that has confirmed it all, so once again, malodyets mr.Market, hats doffed. The only thing to gain from this is not to try counter-trend trades. At least if not catching the move, because of a mislabel, DO NOT lose money trying to trade against the trend...
| About MoneyAM | Ts and Cs | Privacy Policy | Investment Warning | Content Standards | Corporate Solutions | Advertise With Us | Site Map | © 2026 MoneyAM |
Register now for FREE
Share Prices,
Stock Quotes,
Charts, Bulletin Boards, Indices, Watchlists, Portfolio, Market News, Research
or see our Premium Services including Level 2, Terminal and much more.