
| Home | Log In | Register | Our Services | My Account | Contact | Help |
You are NOT currently logged in
Register now or login to post to this thread.
Tanfield Group - any info out there? (TAN)
mr mike - 21 Jan 2004 13:49
Tanfield Group is the new company name of Comeleon. As I understand it, Comoleon was getting into trouble so TAN (paerent company?) took over. Since this has happened the share price has dropped by 0.25p each day for the last week or so (on average) and are now around the 3p mark with very little activity.
Does anyone know much about this company or previously held stock in Comeleon? There is virtually no info out there other than on the company website.
cheers
Mike
Does anyone know much about this company or previously held stock in Comeleon? There is virtually no info out there other than on the company website.
cheers
Mike
cynic

 - 18 Dec 2007 08:10
- 417 of 1076
- 18 Dec 2007 08:10
- 417 of 1076


latest encouraging trading update below ..... note the first order for 100 Smith's trucks .... a also wonder whether a weak $ is actually beneficial for TAN, albeit that they account in £
Tanfield Group PLC said its second-half trading has been in line with management expectations and that it is highly confident of further progress in 2008.
The company also said its Smith Electric Vehicles unit, which produces electric vans and trucks, has won a contract to manufacture 100 vehicles, which will be a mixture of the Newton truck and Edison van models.
Financial details were not disclosed.
Tanfield said it has increased capacity in line with its view of producing up to 30 vehicles a week.
cynic
- 20 Dec 2007 17:38
- 418 of 1076
in some ways, the chart is pretty ugly, but note that recxent lows seem to be forming a reasonable support level ...... would be interesting to see what Peter (PTH) has to say, but would not deter anyone from buying, though i am already o'weight here and might be a bit extravagant in buying more.

ptholden
- 20 Dec 2007 19:28
- 419 of 1076
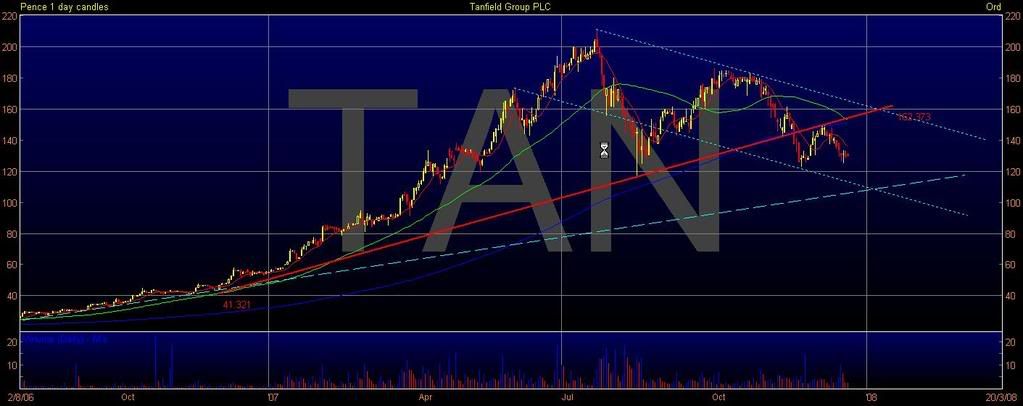
Here you go then Richard, a few observations:
1. The red line is the uptrend drawn from support found at 120p during the collapse from 205p. This failed to provide support recently confirming the downtrend from the all time high, incidentally this trend line also capped the recovery at 150p, coincidental with the 200MA.
2. The stock is frimly in a downtrend since late July, possibly in a channel encompassed between the two dotted blue trend lines, certainly the upper channel may well stall any recovery.
3. I have drawn a much shallower up trend, dashed blue, but this is rather historical and somewhat tenuous at best. Should the drift continue this may provide support.
4. 120p is proving to be quite important support and has been tested on numerous occasions, if this fails 80p could be a possibility.
5. The SP has made a lower high recently and if 120p supports once more, the next move must be above 150p otherwise the downtrend is accelerating. I wouldn't be surprised to see some range bound trading for the coming months.
All a bit of a fudge I'm afraid, but I certainly don't see any strong reason to go long or short, a bit in no-man's land at the moment, although if I was forced to come off the fence I would suggest there may be mileage on a long tack to 150p or thereabouts.
cynic
- 20 Dec 2007 20:46
- 420 of 1076
thanks Peter .... an intelligent assessment as always
will you be around at the end of May? .... if so, please be my guest at Wentworth for a jolly we always have over the PGA tournament
will you be around at the end of May? .... if so, please be my guest at Wentworth for a jolly we always have over the PGA tournament
oilyrag
- 24 Dec 2007 07:26
- 421 of 1076
Merry xmas and happy new year everyone.
lex1000 - 06 Jan 2008 01:26 - 422 of 1076
Things have not changed since last comment in August.TAN reflecting bearish market & could go much lower.With DOW sat on 12800. IF falls below as per DOW theory confirmation of downtrend level, suggesting primary bear market is confirmed & all stocks will suffer including TAN.Shorters have got their teeth into TAN a tad under 10% still out on loan.
Chart looks horrible share price fallen below supports,sell confirmed on drop below 134p.At the moment no compelling reasons to buy.Wait direction.Cash is king.No position.imho.

Powered by IST's
Chart looks horrible share price fallen below supports,sell confirmed on drop below 134p.At the moment no compelling reasons to buy.Wait direction.Cash is king.No position.imho.
Powered by IST's
cynic
- 06 Jan 2008 16:16
- 423 of 1076
lex ..... were i not already a holder, i would find it difficult to justify buying given what the charts say ..... however, for the life of me i can see no reason why sp should be so depressed and inclining south even when markets are not .... any idea?
by the way, my memory tells me that the key number for Dow is 12650, but would be happy to be corrected
by the way, my memory tells me that the key number for Dow is 12650, but would be happy to be corrected
lex1000 - 06 Jan 2008 23:48 - 424 of 1076
cynic,I had made a note as 12,800.bwtfdik.
He has been right 17 times out of 18.
David Schwartz: I dont plan to follow the random path
Published: January 4 2008 16:33 | Last updated: January 4 2008 16:33
I love stock market trivia that helps me to turn a profit.
A good example is the high likelihood of a loss from January 5-13. Since 1990, the FTSE 100 rose just once during this period versus a whopping 17 declines.
The single exception to the rule occurred in 1997 when the Dow Jones Industrial Average kicked off the year by setting several all-time highs. But even during this euphoric time, the FTSE 100 remained in the red until the final day of the period when a fresh Dow record finally triggered a rally to wash away the red ink........
Source & full article: http://www.ft.com/cms/s/0/1aebc6b6-babb-11dc-9fbc-0000779fd2ac.html
cynic
- 07 Jan 2008 08:09
- 425 of 1076
interesting bit of trivia that, i agree ...... i think there is another bit about how the first few weeks of a new year's trading set the tone for the whole ...... i also wonder if the liklelihood of a democrat in WH is demed to be good or bad for markets
Fred1new
- 07 Jan 2008 10:44
- 426 of 1076
Have you considered the effect of withdrawal of 150,000 american soldiers from IRAQ on the unemployment figures in America. The resultant slow down on the armanent production and support services to maintaining the "troops" in Iraq.
America will need another war to support the back pockets of Bush, Cheney and Rumfelt.
America will need another war to support the back pockets of Bush, Cheney and Rumfelt.
Fred1new
- 07 Jan 2008 10:48
- 427 of 1076
Mind they can fall back to "Enron" and its like, perhaps having Blair as it roving ambassador.
I am holding Tanfield, but wish I hadn't bought back. Didn't expect the fall to be so severe and prepared to wait until the next set of figures come out. Think it is a winnerm but a little slower than expected.
I am holding Tanfield, but wish I hadn't bought back. Didn't expect the fall to be so severe and prepared to wait until the next set of figures come out. Think it is a winnerm but a little slower than expected.
cynic
- 07 Jan 2008 10:58
- 428 of 1076
i don't think the troops in iraq are conscripts, and even if they are, does not mean they will become unemployed .... that said, wars are always good for the economy
skinny
- 07 Jan 2008 11:40
- 429 of 1076
Currently in auction.
cynic
- 07 Jan 2008 12:12
- 430 of 1076
why at this time of day?
skinny
- 07 Jan 2008 13:18
- 431 of 1076
Because of % price change.
skinny
- 07 Jan 2008 14:11
- 432 of 1076
cynic - have a look here - https://www.moneyam.com/help/?page=level2 and look for this text The auction process occurs regular at opening and closing of the markets and sometimes intraday auctions are called if a stock moves 5% or more in one trade.
Fred1new
- 07 Jan 2008 14:13
- 433 of 1076
INVESTEC suggest sell from hold. Drop of target price to 112p. (I think opion is Balls, but I think we will see that price.)
lex1000 - 07 Jan 2008 15:06 - 434 of 1076
Some may have benefitted trading intra day lows Bid 103p v Offer 103.5p.
hlyeo98 - 07 Jan 2008 15:41 - 435 of 1076
I hope TAN won't do a Worthington Nicholls.
Falcothou - 07 Jan 2008 18:56 - 436 of 1076
Not looking pretty,still got a PE of 53 according moneyam which is high by even Chinese standards
| About MoneyAM | Ts and Cs | Privacy Policy | Investment Warning | Content Standards | Corporate Solutions | Advertise With Us | Site Map | © 2026 MoneyAM |
Register now for FREE
Share Prices,
Stock Quotes,
Charts, Bulletin Boards, Indices, Watchlists, Portfolio, Market News, Research
or see our Premium Services including Level 2, Terminal and much more.