
| Home | Log In | Register | Our Services | My Account | Contact | Help |
You are NOT currently logged in
Register now or login to post to this thread.
Sirius Exploration -Green play? (SXX)
P J H - 30 Jun 2009 16:01
mentor - 25 Oct 2016 10:18 - 738 of 976
35.50p +1.25p
Nice agreement and confidence on the company ( Australian mining billionaire Gina Rinehart's company to become an investor in and backer of fertiliser company).
Expect lots of positives views from the press on benefits to UK economy that the Government is trying to encourage ...............
Proactive Investor - -07:23 25 Oct 2016
Sirius Minerals strikes US$300mln deal with Gina Rinehart company
The pact with a subsidiary Gina Rhinehart’s Hancock Prospecting will form an important plank of the overall funding package for the AIM-listed group’s North Yorkshire Polyhalite Project.
Sirius Minerals PLC has signed a financing deal worth up to US$300mln with the company controlled by one of the world’s richest woman.
The pact with a subsidiary Gina Rhinehart’s Hancock Prospecting will form an important plank of the overall funding package for the AIM-listed group’s North Yorkshire Polyhalite Project.
Under the terms of the agreement, Hancock British Holdings is acquiring a 5% royalty on the first 13mln tonnes of fertiliser produced every year and 1% on anything over that output figure at a cost of US$250mln.
Hancock has also agreed to acquire US$50mln-worth of Sirius shares.
Hancock deal values Sirius Minerals Yorkshire project at US$3.9bn
Sirius Minerals seen as compelling for responsible investment
Time to be serious about Sirius?
The deal is subject to a number of conditions, the main one being Sirius must secure Stage-One funding for the mine, sited near Scarborough in Yorkshire, which is put at just over US$1.6bn.
The company said it is making good progress in this regard.
Chief executive Chris Fraser told investors: "We are delighted to have signed this agreement with such an experienced party in the mining industry, as well as one that has very successful and strong leadership and a long term and growing agricultural interest."
Hancock Prospecting owns the rights to large tracts of the Pilbara in Western Australia, the world’s largest iron ore deposit.
Rinehart, who is Australia’s richest person and owns almost 77% of the private company, took over it over from her late father and the firm’s founder, legendary prospector entrepreneur Lang Hancock.

Gina Rinehart with Indian Prime Minister Narendra Modi (left).
Nice agreement and confidence on the company ( Australian mining billionaire Gina Rinehart's company to become an investor in and backer of fertiliser company).
Expect lots of positives views from the press on benefits to UK economy that the Government is trying to encourage ...............
Proactive Investor - -07:23 25 Oct 2016
Sirius Minerals strikes US$300mln deal with Gina Rinehart company
The pact with a subsidiary Gina Rhinehart’s Hancock Prospecting will form an important plank of the overall funding package for the AIM-listed group’s North Yorkshire Polyhalite Project.
Sirius Minerals PLC has signed a financing deal worth up to US$300mln with the company controlled by one of the world’s richest woman.
The pact with a subsidiary Gina Rhinehart’s Hancock Prospecting will form an important plank of the overall funding package for the AIM-listed group’s North Yorkshire Polyhalite Project.
Under the terms of the agreement, Hancock British Holdings is acquiring a 5% royalty on the first 13mln tonnes of fertiliser produced every year and 1% on anything over that output figure at a cost of US$250mln.
Hancock has also agreed to acquire US$50mln-worth of Sirius shares.
Hancock deal values Sirius Minerals Yorkshire project at US$3.9bn
Sirius Minerals seen as compelling for responsible investment
Time to be serious about Sirius?
The deal is subject to a number of conditions, the main one being Sirius must secure Stage-One funding for the mine, sited near Scarborough in Yorkshire, which is put at just over US$1.6bn.
The company said it is making good progress in this regard.
Chief executive Chris Fraser told investors: "We are delighted to have signed this agreement with such an experienced party in the mining industry, as well as one that has very successful and strong leadership and a long term and growing agricultural interest."
Hancock Prospecting owns the rights to large tracts of the Pilbara in Western Australia, the world’s largest iron ore deposit.
Rinehart, who is Australia’s richest person and owns almost 77% of the private company, took over it over from her late father and the firm’s founder, legendary prospector entrepreneur Lang Hancock.
Gina Rinehart with Indian Prime Minister Narendra Modi (left).
HARRYCAT
 - 25 Oct 2016 12:53
- 739 of 976
- 25 Oct 2016 12:53
- 739 of 976

Shore Capital note today (last para is the important bit!):
"Sirius is developing the paradigm-shifting North Yorkshire polyhalite project (henceforth, ‘the project’) in England. The company has devised a two-stage construction financing plan, and the first pieces of Stage 1 have fallen into place today. Australian billionaire Gina Rinehart’s Hancock Prospecting has agreed to provide US$300m of the US$1.09bn Stage 1 requirement, comprising US$250m in royalty financing and US$50m in equity funding. We see this as a resounding endorsement of the project, given that Hancock (as Sirius puts it) is “such an experienced party in the mining industry and also one with a strong agricultural interest”.
· Equity investment would be concurrent with royalty drawdown: Hancock’s US$50m equity investment would occur concurrently with drawdown by Sirius of funds from the royalty financing. We understand from Sirius that the issue price will be determined following further progress with remainder of the Stage 1 financing package.
· Royalty equivalent to 3.6% on 20Mtpa: In return for providing US$250m, Hancock is to receive 5% of the gross revenue on the first 13Mtpa of sales for each calendar year, and 1% for any volumes above 13Mtpa (effectively, 3.6% on 20Mtpa at steady-state production). This will continue for the longer of the life of the project or 70 years. The royalty financing agreement is conditional upon completion of Stage 1 financing, and two confirmatory due diligence items that will be satisfied prior to the ‘remainder’ of the Stage 1 equity and structured capital raises being finalised.
· Confidence in production profile implied: The Hancock funds will become available once Sirius has expended US$630m of the total amount of the Stage 1 financing (the total includes the Hancock funds). The royalty returns an IRR (yield) of c.19-21% (depending on exact timing of drawdown) on our 20Mtpa 50-year ‘base case’. With 20% typically targeted by mining investors, this implies confidence in the production profile’s achievability, we believe.
· Good progress on two-stage financing plan: According to Sirius, “good progress” continues to be made on its two-stage financing plan. Details of (the remainder of) the Stage 1 capital structure and timing will be subject to further announcement “at an appropriate time.
We continue to anticipate the conclusion of Stage 1 financing during the autumn of 2016. If all goes to plan, there would be no further need to raise equity thereafter, dilution would cease to be a concern, and we believe the resulting improved clarity on potential equity returns could trigger a significant re-rating. While Sirius is currently at development stage and still some years from becoming a cash flow-generating company, an investment in Sirius will become progressively de-risked and should enjoy significant value uplift as it advances towards production, we believe. Our latest Risked NPV estimate is 70p/share post-Stage 1 financing (previously: 75p/share); we reiterate our BUY recommendation."
HARRYCAT
- 25 Oct 2016 12:57
- 740 of 976
Liberum Capital today reaffirms its buy investment rating on Sirius Minerals PLC (LON:SXX) and set its price target at 50p.
mentor - 25 Oct 2016 23:08 - 741 of 976
.png)
mentor - 25 Oct 2016 23:10 - 742 of 976
Australia's richest woman backs Sirius Minerals - By Lee Wild | Tue, 25th October 2016 - 11:37
Australia's richest woman backs Sirius Minerals In a major coup for Sirius Minerals (SXX), Australia's richest woman has just backed the AIM-listed firm's North Yorkshire potash mine. Gina Rinehart's Hancock Prospecting Group (HPPL) will pay Sirius US$250 million (£204 million) in cash and acquire $50million of Sirius shares to secure access to the company's high-quality agricultural fertilizer.
As part of what is Sirius's first royalty financing agreement, privately-owned Hancock will receive a 5% royalty stream on revenue from the first 13 million tonnes per annum (Mtpa) of sales every calendar year, and 1% for volumes above that.
Hancock, headed by Rinehart since her father and company founder Lang Hancock died in 1992, also gets the right to buy up to 20,000 tonnes of product every year for use on its Australian agricultural operations.
Sirius is rightly chuffed with the deal, which is part of managing director and CEO Chris Fraser's plan, flagged back in March, and again last month.
"Considering Mrs Rinehart's and Hancock's expertise in each of mining and agriculture, this investment is a significant vote of confidence in not only our project, but also our product," said Fraser.
Of course, the big money which will bankroll the project is yet to appear, although we're told that Sirius continue to make "good progress" on its two-stage approach to financing. We'll get more on the Stage One capital structure and timing "at an appropriate time".
"On our numbers, with full production of 13Mt/a of Polyhalite and a forecast sales price of $150 per tonne (WH Ireland est), this equates to $98 million/year," says WH Ireland analyst Paul Smith, who repeats his 'buy' rating and 60p price target for Sirius.
"The effect of this would be to reduce our EBITDA at the mine of ~$1,500 million by $98 million. The mine has a large operating cash margin with operating costs of only $30/t and Sirius has always guided that a royalty sale was a potential source of some mine finance".
The royalty deal is still conditional upon Sirius completing its Stage 1 financing and two confirmatory due diligence items which will be satisfied prior to the Stage 1 financing being finalised.
Then, drawdown of funds under the agreement is conditional on, among a long list of other criteria, Sirius informing Hancock that it has spent US$630 million of its Stage 1 financing.
"This project delivers a new and natural product which is relevant to Hancock’s focus on agriculture and after years of field tests and across many crop types, demonstrated improved yields," says Rinehart. "Sirius has a large, high quality mineral resource and is located in a stable jurisdiction with a competitive tax rate."
"Through the North Yorkshire Polyhalite project, Sirius Minerals is focused on the development of what we believe to be the world’s largest high-grade known polyhalite deposit and our patented multi-nutrient fertilizer product."
mentor - 26 Oct 2016 10:36 - 743 of 976
38.50p +3p
By SARAH MEDDINGS CITY CORRESPONDENT FOR THE DAILY MAIL, 26 October 2016
Australian tycoon pours £250m into UK mine: Country's richest woman backs dig for fertiliser in the North Yorkshire Moors
The North York Polyhalite Project will dig for fertiliser a MILE down
One of the UK’s most ambitious mining projects for decades has secured nearly £250million of investment from Australia’s richest woman.
The North York Polyhalite Project to dig for fertiliser a mile below the North York Moors National Park has been given backing from mining tycoon Gina Rinehart.
Sirius Minerals, the company behind the scheme, revealed yesterday that Mrs Rinehart has agreed to pour £247million into the mine, which is thought to contain 2.2billion tonnes of a specialist mineral used in fertiliser............
Australian tycoon pours £250m into UK mine SXX
mentor - 26 Oct 2016 15:28 - 744 of 976
Has moved upon early demand after various comments and then profit taking has started to take place and now holding around the 39.25.

mentor - 27 Oct 2016 22:41 - 745 of 976
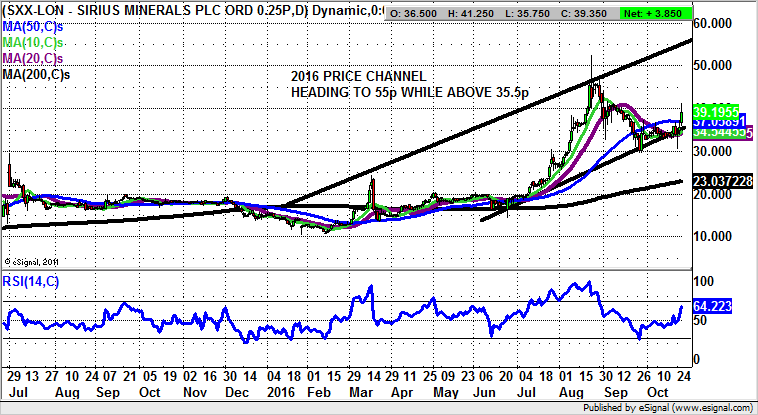
Sirius Minerals: Technicals target 55p post Rinehart intervention - By Zak Mir - 26 October 2016
Sirius Minerals: Technicals target 55p post Rinehart intervention
It has certainly been a long journey for fans of the would-be Yorkshire Potash miner Sirius Minerals. As most of us are aware, it is usually the case that for mining companies the key is less about the digging, and more about the funding. This is of course, whether or not there is actually anything under the ground.
But at least it would appear that things are starting to take shape in a reasonably positive way. Indeed, this comment could be regarded as something of an understatement given the announcement of the intervention of one of the world’s richest women. Gina Rinehart’s Hancock Prospecting is set to back the Sirius Project, now valued at up to $4bn, to the tune of $300m.
The intervention is probably the reason the shares have gone back on the front foot over the past 24 hours, with the technical breakthrough being the push back above the 50 day moving average, currently at 37.05p. The message at the moment is that provided there is no decline back below the floor of a rising trend channel from the beginning of the year at 35.5p, one would be looking to a technical target here as high as the January resistance line projection at 55p over the next 1-2 months. In the meantime, any dips towards the floor of this year’s channel can be regarded as buying opportunities.
mentor - 31 Oct 2016 10:31 - 746 of 976
Close position earlier 38.375p
31 Oct '16 - 08:40 - 13 of 13
SXX 38.50p -1p
Profit taking since last Friday, after not able to go higher on the Intraday of the day before, Indicators have reached also overbought
&IND=MACD(26,12,9);RSI(14);SlowSTO(14,3,3)&Layout=2Line;Default;Price;HisDate&XCycle=&XFormat=)
31 Oct '16 - 08:40 - 13 of 13
SXX 38.50p -1p
Profit taking since last Friday, after not able to go higher on the Intraday of the day before, Indicators have reached also overbought
mentor - 02 Nov 2016 08:22 - 747 of 976
35p -2p -
placing- open Offer and Convertible Bond
The price will be determined by what the institutional investors are willing to pay.
"Record Date for entitlements under the Open Offer 5.30 p.m. on 1 November 2016
Announcement of the Firm Placing and Placing and Open Offer 7.00 a.m. on 2 November 2016
Ex-entitlement date for the Open Offer 8.00 a.m. on 4 November 2016"
This means shareholders need to retain their holding to qualify, till 4th
---------------
Sirius Minerals Plc
Launch of Comprehensive Stage 1 Financing Solution
Sirius Minerals Plc (the "Company" and, together with its subsidiaries, the "Group") today announces the launch of a comprehensive financing plan for its Stage 1 financing requirements to begin the construction of its North Yorkshire polyhalite project (the "Project"), aiming to raise gross proceeds of approximately US$1.2 billion including:
(i) a Royalty Financing Agreement for a total of US$300 million with a subsidiary of Hancock Prospecting Pty Ltd as announced on 25 October 2016;
(ii) an underwritten Firm Placing and Placing and Open Offer to raise approximately £330 - 400 million1; and
(iii) an underwritten Convertible Bond Offering to raise approximately US$400 - 450 million.
1. Key Highlights
· Underwritten Firm Placing and Placing and Open Offer at a price between 20 and 30 pence per New Ordinary Share (the "Issue Price") to be determined by the Bookbuild.
· The Issue Price represents a discount of between approximately 18.9 and 45.9 per cent to the closing price on 1 November 2016 (being the last Business Day prior to this announcement).
· The Company intends to raise approximately 90 per cent of the gross proceeds of the Firm Placing and Placing and Open Offer through the underwritten Firm Placing at the Issue Price to certain institutional investors.
· Approximately 10 per cent of the underwritten Firm Placing and Placing and Open Offer will be subject to clawback by existing shareholders by way of an Open Offer. The Joint Bookrunners and the Co-Lead Managers intend to conditionally place the Open Offer Shares with certain institutional investors at the Issue Price, subject to clawback to satisfy valid applications by Qualifying Shareholders under the Open Offer.
mentor - 02 Nov 2016 09:14 - 748 of 976
33p -4.25p (-11.49%)
Most likely Pi's and Institutions are selling, knowing that the open offer price is going to be below 30p
so able to buy cheaper later
" Underwritten Firm Placing and Placing and Open Offer at a price between 20 and 30 pence to be determined by the Bookbuild."

Most likely Pi's and Institutions are selling, knowing that the open offer price is going to be below 30p
so able to buy cheaper later
" Underwritten Firm Placing and Placing and Open Offer at a price between 20 and 30 pence to be determined by the Bookbuild."
skinny
 - 03 Nov 2016 07:17
- 749 of 976
- 03 Nov 2016 07:17
- 749 of 976

Results of Firm Placing and Placing
Results of Firm Placing and Placing
Sirius Minerals Plc (the "Company") announced on 2 November 2016 the details of a proposed Firm Placing and Placing and Open Offer. The Company has completed the Bookbuild and has raised gross proceeds of approximately £370 million through the Firm Placing and Placing in connection with its Stage 1 financing requirements to begin the construction of its North Yorkshire polyhalite project.
Concurrently, the Company has successfully placed US$400 million of Convertible Bonds through the Convertible Bond Offering.
more.....
skinny
- 03 Nov 2016 07:18
- 750 of 976
Convertible Bond Offering Results
Sirius Minerals Plc (the "Company" or the "Guarantor") today announces the successful placement of US$400 million of Guaranteed Convertible Bonds due 2023 (the "Bonds"), guaranteed by the Guarantor.
more.....
Sirius Minerals Plc (the "Company" or the "Guarantor") today announces the successful placement of US$400 million of Guaranteed Convertible Bonds due 2023 (the "Bonds"), guaranteed by the Guarantor.
more.....
mentor - 03 Nov 2016 09:57 - 751 of 976
Reading at the results of the placing I have reached a conclusion and is not good for shareholders .....
1 - Firm Placees have agreed to subscribe for 1,665,805,761 Firm Placed Shares at an issue price of 20 pence ( 40.0 per cent of the Company's issued Ordinary Shares )
2 - Have placed 185,089,529 Open Offer Shares ( 4.4 per cent )
3 - Qualifying Shareholders will be given the opportunity to apply for the Open Offer Shares at the Issue Price 20p
4- On the following basis: 2 New Ordinary Shares for every 25 Existing Ordinary Shares
Conclusion
Diluting current investors to high heaven, as they are given only 11.11% of the total subscription on a very low share price 20p (185K : 1,665K x 100 = 11.11% ).
Capital Research with 10% at the moment, has been well awarded on the participation in the Firm Placing and the Placing so shareholder got not much to say on the open offer.
Ruthbaby
- 03 Nov 2016 10:41
- 752 of 976
That is quite brutal actually!!!
skinny
- 03 Nov 2016 14:51
- 753 of 976
mentor - 15 Nov 2016 08:54 - 754 of 976
bought some @ 22.2145p
why?
Is on a open offer placing situation @ 20p that soon will be over, has moved down a big thing since and should now start moving higher from this point. Order book looking strong now.
---------------
Reality strikes at Sirius Minerals - By John Cornford 04 November 2016
Shares in Sirius Minerals have rightly suffered a major pullback over the past few days, and many private-investor enthusiasts for the stock have been badly burned. The trouble with Sirius is that there is a lot of questionable analysis out there in the public domain right now. Here’s my attempt at setting the record straight…
https://masterinvestor.co.uk/equities/reality-strikes-sirius-minerals/
mentor - 21 Nov 2016 16:17 - 755 of 976
21.125p =
Very level today on the share price but slowly the buys are taking over the order book, still plenty of shares for sell on the offer side, so I do not expect to change YET.
Now there was a post on III giving a good detail of the stock from "1328745" ......
I'd just like to make it clear that I'm not an employee of Sirius Minerals as some have assumed.
I'd also like to answer your question in relation to why I believe that the current share price doesn't reflect the 'shovel ready project' value. The share price immediately before the launch of stage 1 financing (37p) in some part factored in the expectation of successful financing. The 20p placing price of course doesn't include any element of 'shovel readiness' as the institutional investors aren't funding a shovel ready project.
They're funding a great idea with mineral rights, planning consents, project plans etc. Without that funding it's not going to be shovel ready. Of course the share price was going to converge with the placing price as private investors sold shares to take up their open offer allocations. Institutional investors aren't going to be picking any shares up in the low 20's though until those two resolutions are passed and the project is genuinely shovel ready. Now it isn't. If those resolutions aren't voted through then they get their placing money back – no additional risk due to the uncertainty of private investor behaviour.
Buying shares on the open market now at a similar price to the placement price is a risk too far until that vote goes through (even though the placing was oversubscribed at 20p). Once it does, the re-rate starts. In theory, based on the 37p share price immediately before stage 1 financing launch and the 20p placing price, the share price should be 29.5p when the new shares start trading. This was detailed in the circular. That's still very much on the low side though as the 37p only partly reflected the shovel ready value so I'd expect it to climb quite quickly beyond that.
Remember that figures of 15p – 20p/share have been forecast for a long time for the equity raise. The link below shows the figures from Sirius Mineral's DFS and Liberum's own figures – albeit before the capital funding reduction was announced. The model's most optimistic setting allowed for 30p/share but the default was 15p. Shore Capital's research note on the 27th May used 20p/share.
http://liberum.com/models/sxxj79vi8n502m
And no, I don't work for Liberum either!
mentor - 22 Nov 2016 13:02 - 756 of 976
Bought some more @ 21.475p
Looks like the roller coaster is now ready to go much faster as the order book on the bid side is weakening on size
The chart below is showing the bounce for the last couple days, once was marked down heavily last Friday and bounce back more than half the fall.

Looks like the roller coaster is now ready to go much faster as the order book on the bid side is weakening on size
The chart below is showing the bounce for the last couple days, once was marked down heavily last Friday and bounce back more than half the fall.
mentor - 22 Nov 2016 22:19 - 757 of 976
Serious worries on Sirius Minerals chart? - By Alistair Strang | Tue, 22nd November 2016
A chartist's take on Sirius Minerals polyhalite mine project share technical We last viewed this a couple of months ago and speculated a scenario where weakness toward 19.5p was possible. At time of production, Sirius (SXX) was trading at 39p and thus, it appeared a silly prospect. Needless to say, the AIM market has obliged!
Currently trading at 21p, it's sufficiently close to our 19.5p and in a region where we'd hope for a bounce if some strength remains. Unfortunately, share prices sometimes almost insist on bonking against trend lines and currently, 'red' on the chart is a nuisance 19.5p!
This is where things risk getting seriously nasty. Should this share price actually manage to close below 'red', it opens the first chapter in a magical tale called Fantastic Bottoms and Where to Find Them.
Or, in plain English, it starts a cycle toward an initial 12.7p with secondary a hopefully trampoline level of 8p.
However, at this point in the game, it's probably worth keeping an eye open if any spike downward at the start of trading breaches 19.5p. We'd tend to look favourably on such a ploy.
Near-term, in the event of the share bettering 22.25p, we're able to calculate an initial expectation of 25p. While in the great scheme of things such a small movement is useless, if 25p is beaten, it sends the first signal of the price actually having experienced a bottom.
In such an instance, we're able to calculate a longer-term secondary at 31.75p and a need for us to update our projections.
For now, we hope it bounces. Soon.
_0.png)
A chartist's take on Sirius Minerals polyhalite mine project share technical We last viewed this a couple of months ago and speculated a scenario where weakness toward 19.5p was possible. At time of production, Sirius (SXX) was trading at 39p and thus, it appeared a silly prospect. Needless to say, the AIM market has obliged!
Currently trading at 21p, it's sufficiently close to our 19.5p and in a region where we'd hope for a bounce if some strength remains. Unfortunately, share prices sometimes almost insist on bonking against trend lines and currently, 'red' on the chart is a nuisance 19.5p!
This is where things risk getting seriously nasty. Should this share price actually manage to close below 'red', it opens the first chapter in a magical tale called Fantastic Bottoms and Where to Find Them.
Or, in plain English, it starts a cycle toward an initial 12.7p with secondary a hopefully trampoline level of 8p.
However, at this point in the game, it's probably worth keeping an eye open if any spike downward at the start of trading breaches 19.5p. We'd tend to look favourably on such a ploy.
Near-term, in the event of the share bettering 22.25p, we're able to calculate an initial expectation of 25p. While in the great scheme of things such a small movement is useless, if 25p is beaten, it sends the first signal of the price actually having experienced a bottom.
In such an instance, we're able to calculate a longer-term secondary at 31.75p and a need for us to update our projections.
For now, we hope it bounces. Soon.
| About MoneyAM | Ts and Cs | Privacy Policy | Investment Warning | Content Standards | Corporate Solutions | Advertise With Us | Site Map | © 2026 MoneyAM |
Register now for FREE
Share Prices,
Stock Quotes,
Charts, Bulletin Boards, Indices, Watchlists, Portfolio, Market News, Research
or see our Premium Services including Level 2, Terminal and much more.