
| Home | Log In | Register | Our Services | My Account | Contact | Help |
You are NOT currently logged in
Register now or login to post to this thread.
FTSE + FTSE 250 - consider trading (FTSE)
cynic

 - 20 Oct 2007 12:12


rather than pick out individual stocks to trade, it can often be worthwhile to trade the indices themselves, especially in times of high volatility.
for those so inclined, i attach below charts for FTSE and FTSE 250, though one might equally be tempted to trade Dow or S&P, which is significantly broader in its coverage, or even NASDAQ
for ease of reading, i have attached 1 year and 3 month charts in each instance
for those so inclined, i attach below charts for FTSE and FTSE 250, though one might equally be tempted to trade Dow or S&P, which is significantly broader in its coverage, or even NASDAQ
for ease of reading, i have attached 1 year and 3 month charts in each instance
Davai - 15 Jun 2012 09:13 - 8393 of 21973
For certain the Nzd is going to break its 4hr supporting trendline, but the question is; when?!
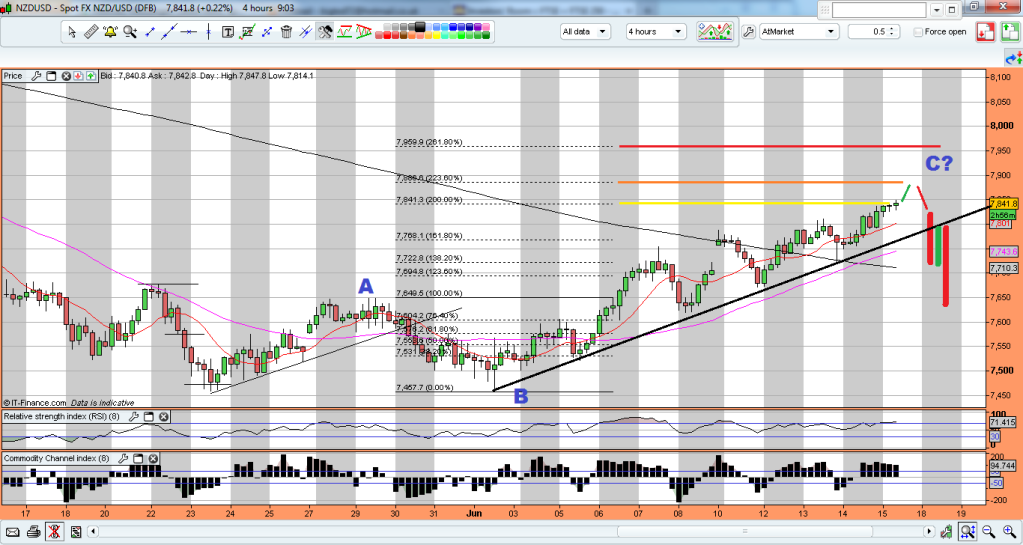
We have already tagged the 200% fib of 'A', but with my thoughts that the Dow might head higher, we may see the 223.6%, possibly even the 261.8%, (although i doubt it).
Looking for a strong 4hr candle to break the trendline, to start the ball rolling. this should be in tandem with the index's, or may even give a slight heads up.
Anyway, all just speculation, but just trying to share the things that i'm looking out for. Out of all the posts recently, this would be a great trade if what i have highlighted above comes off.
ahoj
- 15 Jun 2012 09:26
- 8394 of 21973
I think, over the last three weeks the affect of external factors was serious on the movement of shares and reduced the value of analysis of the charts.
I think we should rely on your analaysis from now on, as everything is getting stable.
I think we should rely on your analaysis from now on, as everything is getting stable.
maggiebt4
- 15 Jun 2012 10:04
- 8395 of 21973
Keep posting Davai, I find it all very interesting if way beyond me!
jonuk76
- 15 Jun 2012 14:00
- 8396 of 21973
"everything is getting stable." - Wish I was as confident!
FTSE100 just given up gains for the day... NY Fed data was pretty bad.
FTSE100 just given up gains for the day... NY Fed data was pretty bad.
Davai - 15 Jun 2012 14:52 - 8397 of 21973
I've tried and tried to simplify the chart, but it doesn't really work! :(
In the last few days i've (tried to) show two different scenarios for the Dow.
The conflict i talked about is shown in the following chart.
The blue line shows a last LH being breached and a swing long scenario, this gives me a break of the flagline and a target of the blue line (as suggested is possible last night) at 12848/50. This would then look to be a top of an irregular 'B' wave as part of an ABC correction. This means once hit, we head back down in 5 waves for our 'C', this also means we wont see any fresh lows, so once completed, we are going up for weeks thereafter to fresh highs...
Here was the original;
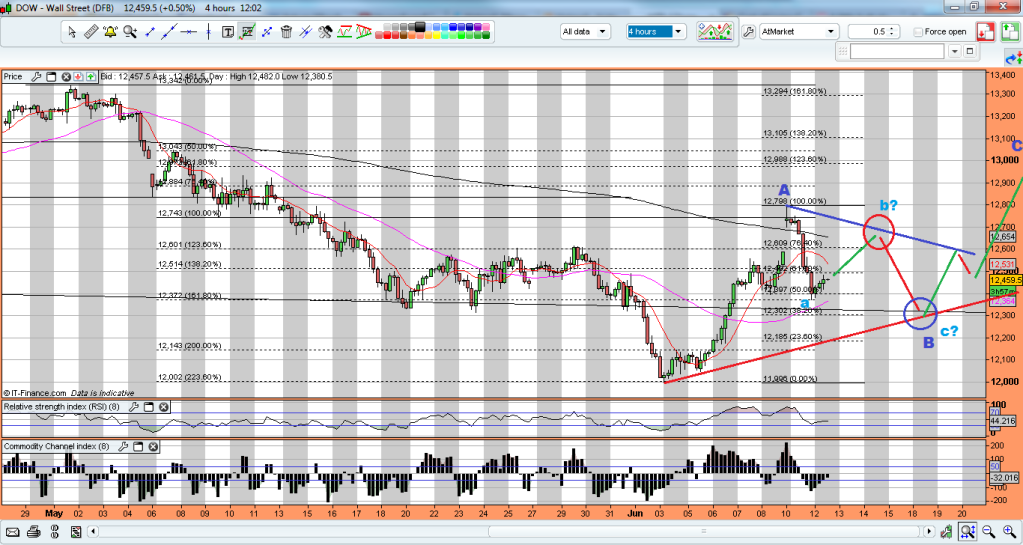
so all i have done is changed it to an 'irregular' correction, (whereby the light blue 'b' goes above dark blue 'a')
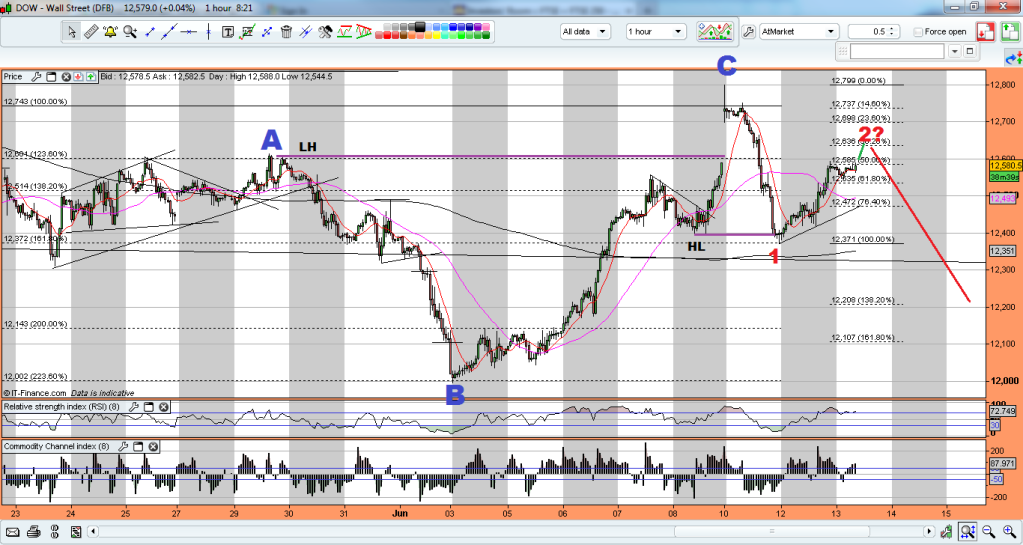
The other (and imo more likely) scenario is the red line. This is where the recent high was the end of a 'C' wave (probable irregular 4th). As noted before all the Fib levels fitted perfectly. That would mean the drop on Monday was a fresh wave 1 and so we retrace in an ABC move back to a common Fib level for wave 2. Further, Monday's drop also took out a previous 'reflex' point, (at the red line, top chart, prev 50% fib), giving added confusion.
(The original chart);
so all we have done so far is print a slightly higher '2'...
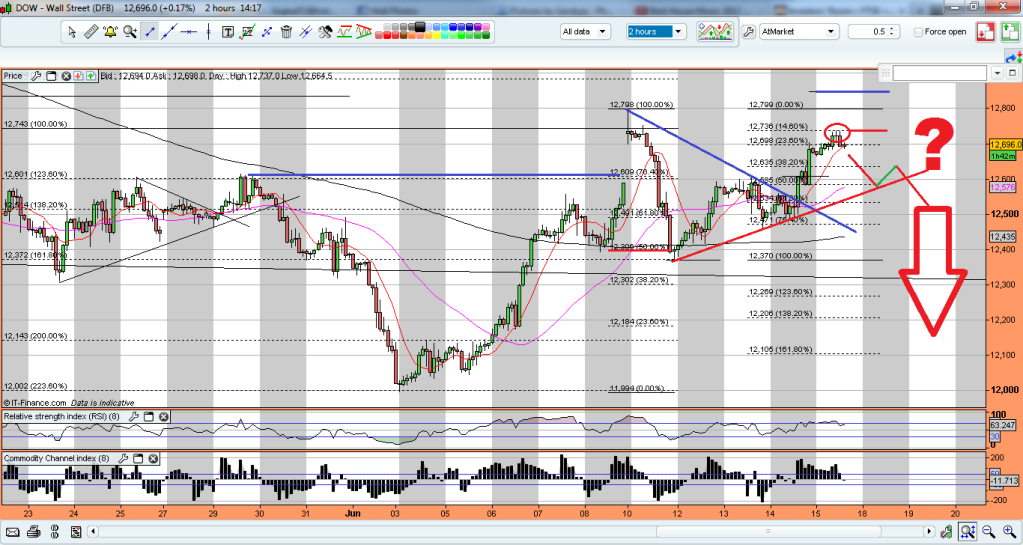
We have currently rejected the 14.6% level, so the answer will be nigh. If we make a HH, then it negates the second scenario, (point 2 can not exceed point 1) and expect minimum 12848, but probable reverse shortly thereafter as per previous plan...
If it carries on up..... well, i don't have a plan for that one!
In the last few days i've (tried to) show two different scenarios for the Dow.
The conflict i talked about is shown in the following chart.

The blue line shows a last LH being breached and a swing long scenario, this gives me a break of the flagline and a target of the blue line (as suggested is possible last night) at 12848/50. This would then look to be a top of an irregular 'B' wave as part of an ABC correction. This means once hit, we head back down in 5 waves for our 'C', this also means we wont see any fresh lows, so once completed, we are going up for weeks thereafter to fresh highs...
Here was the original;

so all i have done is changed it to an 'irregular' correction, (whereby the light blue 'b' goes above dark blue 'a')
The other (and imo more likely) scenario is the red line. This is where the recent high was the end of a 'C' wave (probable irregular 4th). As noted before all the Fib levels fitted perfectly. That would mean the drop on Monday was a fresh wave 1 and so we retrace in an ABC move back to a common Fib level for wave 2. Further, Monday's drop also took out a previous 'reflex' point, (at the red line, top chart, prev 50% fib), giving added confusion.
(The original chart);

so all we have done so far is print a slightly higher '2'...
We have currently rejected the 14.6% level, so the answer will be nigh. If we make a HH, then it negates the second scenario, (point 2 can not exceed point 1) and expect minimum 12848, but probable reverse shortly thereafter as per previous plan...
If it carries on up..... well, i don't have a plan for that one!
jonuk76
- 15 Jun 2012 14:58
- 8398 of 21973
Davai is there a good 'idiots guide' anywhere for Elliott Wave that you know of?
cynic
- 15 Jun 2012 14:59
- 8399 of 21973
sock it to 'em davai ..... keep confusing them (and me!) all with loadsa goobledegook and science lol
cynic
- 15 Jun 2012 15:00
- 8400 of 21973
jonuk - best idiots guide is to throw your hands in the air and let someone else do the work and explain it to you ...... you can then follow or not as you choose :-)
maggiebt4
- 15 Jun 2012 15:07
- 8401 of 21973
I'm with you on that one cynic :-)
jonuk76
- 15 Jun 2012 15:24
- 8402 of 21973
Yes that's one option! In the meantime this pic shows a bit more than I understood before!
Link to massive pic of elliot wave formations
Link to massive pic of elliot wave formations
chuckles - 15 Jun 2012 15:27 - 8403 of 21973
Chillax davai, I love yr charts, but it's easier to label the waves after the move than it is before the move, which kinda means predicting each wave count is meaningless. Anyway you're posting stuff with entries, stops and targets with the reasons why which is more than can be said for the majority of share site posters. Credit
chuckles - 15 Jun 2012 15:32 - 8404 of 21973
Next £/$ target = 15750 yup
Davai - 15 Jun 2012 15:37 - 8405 of 21973
Cheers, chucks!
So my simplified version didn't really simplify things at all did it?!
Ok lets try again...
open a chart, timescale to suit yourself, if its lower on the left and higher on the right, buy the pullbacks...
In the event of the opposite; sell the spikes!
So my simplified version didn't really simplify things at all did it?!
Ok lets try again...
open a chart, timescale to suit yourself, if its lower on the left and higher on the right, buy the pullbacks...
In the event of the opposite; sell the spikes!
Davai - 15 Jun 2012 15:43 - 8406 of 21973
Had to laugh;
jonuk76 - 15 Jun 2012 15:24 - 8402 of 8405
'Link to massive pic of elliot wave formations'
)))))))
jonuk76 - 15 Jun 2012 15:24 - 8402 of 8405
'Link to massive pic of elliot wave formations'
)))))))
halifax - 15 Jun 2012 16:20 - 8407 of 21973
bullshit baffles brains!
HARRYCAT
- 16 Jun 2012 09:33
- 8408 of 21973
Looks like the greeks will be dominating the news early next week. Banking stocks will either surge or fall back sharply (depending on their exposure to greek debt), depending on election result. Does anyone know how long it takes before they have finished counting and ready to announce?
cynic
- 16 Jun 2012 10:01
- 8409 of 21973
would expect markets to have a strong indication at opening .... now you know why i banked my RBS profit yesterday!
skinny
- 16 Jun 2012 10:47
- 8410 of 21973
Harry :-
Sunday's vote
Voting begins 04:00 GMT (07:00 local time)
Voting ends 16:00 GMT with exit polls released immediately afterwards
First official results expected after 18:30 GMT
Campaigning ends ahead of crucial Greek elections
Sunday's vote
Voting begins 04:00 GMT (07:00 local time)
Voting ends 16:00 GMT with exit polls released immediately afterwards
First official results expected after 18:30 GMT
Campaigning ends ahead of crucial Greek elections
HARRYCAT
- 16 Jun 2012 16:56
- 8411 of 21973
Cheers skinny.
chuckles - 16 Jun 2012 20:27 - 8412 of 21973
Expecting dem pounds to have a rest and revisit 15600 before trundling up to 16100. Yup
| About MoneyAM | Ts and Cs | Privacy Policy | Investment Warning | Content Standards | Corporate Solutions | Advertise With Us | Site Map | © 2026 MoneyAM |
Register now for FREE
Share Prices,
Stock Quotes,
Charts, Bulletin Boards, Indices, Watchlists, Portfolio, Market News, Research
or see our Premium Services including Level 2, Terminal and much more.