
| Home | Log In | Register | Our Services | My Account | Contact | Help |
You are NOT currently logged in
Register now or login to post to this thread.
The really useful silver thread (AG)
squirrel888 - 12 Jun 2013 10:30


gazkaz - 22 Oct 2013 14:19 - 852 of 1034
Eric Sptotts observations
"There is an interesting thing going on there, Eric
We get data out of India.
- They consumed slightly less than 2,000 tons ...of silver late year.
- It would appear they are going to consume...... 6,000 tons this year....
"It might be a little early for me to say that because as gold has been restricted, that number might even..... be well above..... that (total of 6,000 tons of silver).
- In the first 8 months there were something like 4,000 tons (already consumed), so we are just extrapolating that trend,
but .....the trend was gaining strength as the year went on.
But when you (as India) buy an ......extra 4,000 tons..... of silver in a year,
- you are buying......... an extra 17%
- of the (entire global) market.
So we have a new entrant into the (silver) market who takes down...... 17% of the supply, and...... the price goes down.
- It’s the same analogy as China buying gold. They (China) buy 25% more of the (entire global) market and the price (of gold) goes down.
Those things don’t hold together. .........Logically this should not happen
(the price of silver going down).
So, I’m very optimistic on.... silver.
The US Mint silver sales have just been booming here.
- They are still 50/1.... in terms of the physical relationship to gold at the US Mint.
- We (only) produce ..11-times ...more silver (than gold).
- We (only) have about... 3-times ....more silver (available) for investment,
- and yet investors, via the (US) Mint, are buying it at.... a 50/1 ratio to gold.
That cannot persist too long without the price of silver going..... up
.....(substantially)."
gazkaz - 22 Oct 2013 15:36 - 853 of 1034
GLD ETF now 882.23 metric tonnes,
DOWN 467.69 metric tonnes
- or 34.65% year-to-date.
•The Sprott Physical Gold Trust (PHYS) Down..... 1.3% year-to-date.
•The iShares Silver Trust (SLV) held 10,084.96 metric tonnes of silver on 12/31/12. YET with the silver price down 28% year-to-date,
- the SLV shows an "inventory" of 10,391.35 metric tonnes,
UP 3% year-to-date.
......................................................................................................................
Last Wed'Thur - GLD - lost.... 6.9....Tonnes
JP Morgue....Eligible...Shot up...4 tiny oz short of exactly 6 Tonnes
The 3 Major Comex players have only actually got skin in the game to a Grand Total Of Dealer Inventory of
i) Scotia: 162,121.611 oz ....or 5.043 tonnes
ii) HSBC: 131,673.323. oz.... or 4.09 tonnes
iii) JPMorgan: 283,102.634 oz.... or 8.805 tonnes
(Total App 18 Tonnes)
Just 18 Tiny Tonnes - plays the COMEX Market......when 6.9 Tonnes
- moves ....in ONE DAY
......................................................................................................................
If my memory serves me correctly - around 6 months ago - a Huuuuge 10% ish of GLD shares had been.....borrowed....and then sold......or more interestingly
REDEEMED in 100,000 share baskets.....for physical
In round figures GLD is 800 tonnes by way of gold backing their shares
- if 10% OF THE SHARES HAVE BEEN BORROWED AND SOLD
- There are 10% more holders....than there is gold backing their shates
- 10% of 800 tonnes therefore equals
- 80 "phantom" tonnes of gold
In terms of a 2400 tonnes mine production p.a
- thats a huge 3% equivalent in annual mine production....of "Phantom Physical Gold"
- just in respect of...just the GLD ETF
........................................................................................................................
Musing thought
So Sprott physical has lost just over 1% physical ytd, yet
GLD has Lost ..............................35%
& GLD has 80+ tonnes of...."phantom gold" backed shares washing around
And the Big Three Comex Bank.....are playing the international gold Comex Market
- with a tiny dealer inventory..... between them of
-....just 18 tonnes
And as seen above SEVEN tonnes can move...in ONE day
Add to that the B of E - had 1,300 tonnes difference in its published figures......just go walkabout :o)
Plus Comex Gold inventory (Dealer & Customer) - has totally fallen off a cliff ytd
.......................................................................................................................
Whilst true demand for real gold - has been subdued by
- unallocated gold accounts,
- gold tracking products
- unbacked Gold ETFs
- Gold backed ETFs
- spot/futures/options dealing
There is currently still a staggering demand for actual physical
China & India alone - will account for the whole 2,400 tonne newly mined output this year.
- So where is all the gold supplying Rssia and a long list of other sovereign buyers coming from
- The US & Canadian mints sales- account for more than all the gold mined in the US & Canada tis year
- and even that mine output figure has already been counted - as taken by China & India in te above 2,400 world mining output figure.
- and ....US & Canadian - "Private" mints - sell several multiples worth....of what the National Mints themselves Sell
- And refineries were working 24/7 and running 6/8 week delivery delays
And you know the rest on....... the huuuuuge demand side
So whee is all the gold coming from ?????
........................................................................................................................
Do you really think this .....ever really ended ?
In his book “Gold Wars”, Swiss banker Ferdinand Lips
- wrote:
“It was decided to keep the gold pool.... secret at the time.
- Keeping with.... traditional practices...... at the BIS meetings,
- not a scrap of paper... was initialed
- or even exchanged;
- the word of each governor was as binding as any contract”.
(Lipps, Gold Wars, 2001: pg 53)
......................................................................................................................
gazkaz - 23 Oct 2013 08:22 - 854 of 1034
'Aint no stoppin' 'em now
- US just removes the debt ceiling limit
- and now....
FITCH revises the rating goalposts....just for the US
(Can't have US T-Bonds falling out the....acceptable collateral category...into just junk-bonds...can we :o)
................................................................................
Fitch Ratings says in a new report that even for a sovereign with
- the strongest credit fundamentals,
- there will be a gross general government debt (GGGD)/GDP level above which
- Fitch believes its rating is no longer compatible..... with 'AAA'.
This is usually.... 80%-90%,
- but (There it is - the famour US "but" get out)
- can be higher .......for sovereigns
- with exceptional financing flexibility,
- such as benchmark borrowers with...(Here we go).... reserve currency status.
As we have highlighted before, for France, Germany and the UK,
- this threshold is ......currently....... 90%-100%,
- and (Drum Roll).... for the US,
- it is currently 110%,
provided debt is... then placed... on a firm downward path over the medium term.
(& I would imagine... downward path....in Fitch definition is
- can keep going up and up with a prospect of ....still going up & up, but more slowly...at ....some point)
........................................................................................................................
And just in case - FITCH needs another get out of downgrading the US card to play.....here comes "Leeway" and "Temporary" too)
............................................................................................................................
"Fitch... gives... a 'AAA' rated sovereign
- some leeway
- in allowing a temporary rise
in its GGGD/GDP ratio before a downgrade".
gazkaz - 23 Oct 2013 08:31 - 855 of 1034
Eric SPROTT
- highlights that the Gold Industry WGC....doesn't ...really work for ..THE Industry's benefit
- and....fiddles the figures.....to the detriment...of - The Industry
.......................................................................................................................
To illustrate my point, Table 1 below contrasts mine production with demand from some of the world’s largest gold consumers.
- According to WGC/GFMS data, the world will mine, on an annualized basis, about 2,800 tonnes of gold for 2013.
But, I adjusted these figures
- to reflect mine production from China and Russia,
- which never leaves the country and is used solely to satisfy domestic demand.
After adjustments, we have a total world mine supply of about ...2,140 tonnes.
(Sprott - then calculates REAL DEMAND at .......5,184 Tonnes)
 http://www.zerohedge.com/news/2013-10-22/eric-sprotts-open-letter-world-gold-council
And what happens to prices.....when
- demand rockets up
- to more than....double supply
- of course.....prices tank :o)
Yes that's the law of supply & demand
(At least in the world of...secret........."London Gold Pool" style markets)
- highlights that the Gold Industry WGC....doesn't ...really work for ..THE Industry's benefit
- and....fiddles the figures.....to the detriment...of - The Industry
.......................................................................................................................
To illustrate my point, Table 1 below contrasts mine production with demand from some of the world’s largest gold consumers.
- According to WGC/GFMS data, the world will mine, on an annualized basis, about 2,800 tonnes of gold for 2013.
But, I adjusted these figures
- to reflect mine production from China and Russia,
- which never leaves the country and is used solely to satisfy domestic demand.
After adjustments, we have a total world mine supply of about ...2,140 tonnes.
(Sprott - then calculates REAL DEMAND at .......5,184 Tonnes)
http://www.zerohedge.com/news/2013-10-22/eric-sprotts-open-letter-world-gold-councilAnd what happens to prices.....when
- demand rockets up
- to more than....double supply
- of course.....prices tank :o)
Yes that's the law of supply & demand
(At least in the world of...secret........."London Gold Pool" style markets)
gazkaz - 24 Oct 2013 10:11 - 856 of 1034
Paints a story
- in the past (although no real indication of the future, as they say)
- when the "net commercial position" gets around this sort of....territory
- a noticeable rally ....tends...to ensue thereafter,
once the net position has completed its climb towards "net neutral/0"....and turned the corner

- in the past (although no real indication of the future, as they say)
- when the "net commercial position" gets around this sort of....territory
- a noticeable rally ....tends...to ensue thereafter,
once the net position has completed its climb towards "net neutral/0"....and turned the corner
gazkaz - 24 Oct 2013 10:22 - 857 of 1034
Incidentally - re GLD - (potentially being raided and raped of it's physical)
- GLD a few days back lost just under 11 Tonnes.....in one day
Ball park wise - that's around 1.3% of its total holding
- in ONE DAY
Recollect a few posts back..Sprott Physical ETF
(General opinion ....backed by real tangible physical)
Lost just 1.3% .....in the whole YEAR to date
- GLD a few days back lost just under 11 Tonnes.....in one day
Ball park wise - that's around 1.3% of its total holding
- in ONE DAY
Recollect a few posts back..Sprott Physical ETF
(General opinion ....backed by real tangible physical)
Lost just 1.3% .....in the whole YEAR to date
gazkaz - 24 Oct 2013 13:17 - 858 of 1034
Just - interesting....going back a couple of years ...but still interesting
A new report prepared for Prime Minister Putin by the Federal Security Service (FSB) says that former International Monetary Fund (IMF) Chief
- Dominique Strauss-Kahn
- was charged and jailed in the US for sex crimes on May 14th
- after his discovery that
- all of the gold held in the United States Bullion Depository located at Fort Knox was ‘missing and/or unaccounted’ for.
http://www.eutimes.net/2011/05/russia-says-imf-chief-jailed-for-discovering-all-us-gold-is-gone/
According to this FSB secret report, Strauss-Kahn had become “increasingly concerned” earlier this month
- after the United States began........ “stalling”
- its pledged delivery to....... the IMF of 191.3 tons of gold
(agreed to under the Second Amendment of the Articles of Agreement signed by the Executive Board in April 1978 that were to be sold to fund what are called Special Drawing Rights (SDRs) as an alternative to what are called reserve currencies).
.......................................................................................................................
Coincidentally - The IMF's own WEB PAGE makes mention of exactly the 191.3 tons mentioned above
http://www.imf.org/external/np/exr/facts/gold.htm
Quote
"In February 2010, the IMF announced the beginning of sales of gold on the market. At that time, a total of .....191.3 tons of gold remained to be sold.
In order to avoid disrupting the gold market, the on market sales were to be conducted in a phased manner over time.
.......................................................................................................................
Of course "the bad guys" - have much more time and resources
- to create strawman style dis-info
- than the good guys have in searching for.....the truth.
But - the WORLD BANK - table I posted a little while back - had US total reserves inclusive of...GOLD (At Market price - ie NOT the oft quoted $35 FEDy figure)....at a grand total figure
- which was - way below just what ...the gold value alone ....should have significantly exceeded .
Silly example (to illustrate the above)
- "alleged" market value of US Gold Reserves $1,000
- but the world bank total of ...all US reserves (Inc Gold & at prevailing market price)
- showing as only.. totalling... $500
- ie the above alleged gold alone should....have given a Total Reserve Holding....
- exceeding the $1,000 (used in this example)
.......................................................................................................................
It's some while since I posted it (in the other place) so it's from memory
- but an alleged credible eye witness....logged (in para phrase)...convoys of large tonnage lorries...leaving Ft.Knox,... fully loaded
- around a couple of years....after...Nixon ....closed the US Gold Window.
(Destination.....Unknown :o)
gazkaz - 25 Oct 2013 20:32 - 859 of 1034
One of my contacts with one of the largest European precious metals brokers told me this morning that
- they could not find... any... silver.
All the refiners they contacted
- could not take their orders
- and could not give any delay.
“Call us next next month”, they said.
( This is the first time that such an event has occurred).
On Wednesday, he attempted to source a ton of silver (32,000 oz),
- from... the... three main Swiss refiners.
- Two of them .....refused to take the order entirely,
- and the third refiner stated delivery would take 2 weeks.
The refiners claimed they had been very busy during the last month trying to fulfill an...... “enormous” Chinese order.
(Cyrille Jubert, Author of Silver Throughout History)
gazkaz - 25 Oct 2013 20:53 - 860 of 1034
Rememer a few months back - Comex suddenly added a disclaimer
- to its published figures
- to the effect we don't check..we just publish what the Banksters tell us
Have a look at Shanghai - silver stocks...."trend"
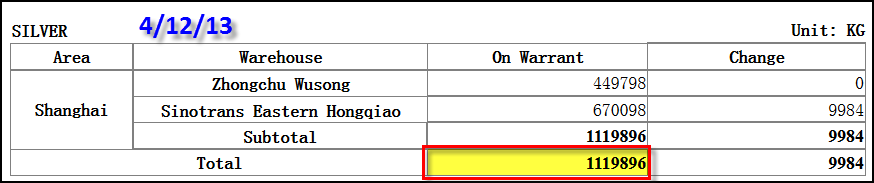


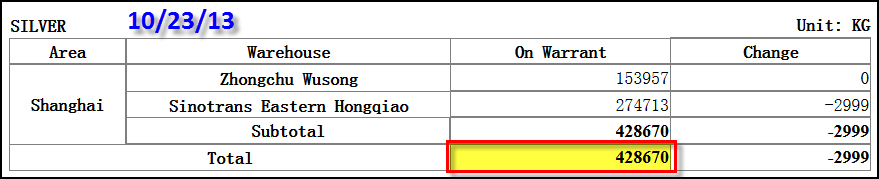
So In a little more than a half a year,
- the silver stocks at the Shanghai warehouses
- have declined 692 tonnes
- or 62% - of their total before the April 12th silver & gold price take-down
So after having seen the huuuuuge.....plummet in Shanghai Silver Stocks
- what would you expect to see happening....
- to Comex Silver Stock
- over broadly the smae period ??
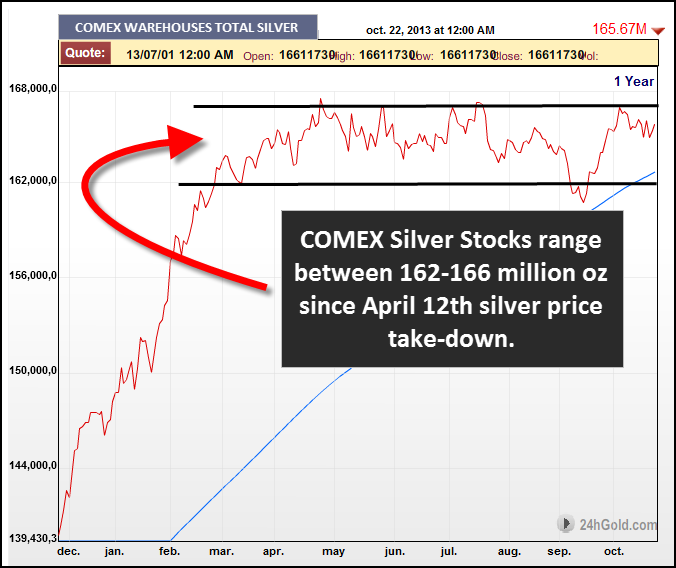 Very much in the...
- "No change here boys & girls.....just steady as you go. Move along, nothing to see here"
Genre
Perhaps Comex
- added the "they could be telling us a load of old tosh...for us to publish"
Disclaimer....for a reason
- to its published figures
- to the effect we don't check..we just publish what the Banksters tell us
Have a look at Shanghai - silver stocks...."trend"
So In a little more than a half a year,
- the silver stocks at the Shanghai warehouses
- have declined 692 tonnes
- or 62% - of their total before the April 12th silver & gold price take-down
So after having seen the huuuuuge.....plummet in Shanghai Silver Stocks
- what would you expect to see happening....
- to Comex Silver Stock
- over broadly the smae period ??
Very much in the... - "No change here boys & girls.....just steady as you go. Move along, nothing to see here"
Genre
Perhaps Comex
- added the "they could be telling us a load of old tosh...for us to publish"
Disclaimer....for a reason
gazkaz - 25 Oct 2013 21:12 - 861 of 1034
In addition, all the old....... French silver coins
- seem to have vanished.
My contacts who used to trade..... 500 kilos a day between 2007 and 2011,
- told me in spring 2012, that they..... didn’t trade this amount.... in a month.
For the past 6 months,
- the coins dealers have had ........no French silver coins to sell
(and even the black market..... seems to be completely dry).
Cyrille Jubert,
Author of Silver Throughout History
gazkaz - 25 Oct 2013 21:45 - 862 of 1034
Gold & Silver bars - very rarely meet the "perfect" good delivery weight, to the exact round ounce.....and are in fact quoted by weight
- right down to 3 decimal places
So the odds of getting a delivery to the perfect round.... XXX.000 oz
- is statistically odds of.....a thousand : one
Well last Friday
JPM eligible addition was a flat, round number.
- Not only that, the round number in question is 192,900.000 troy ounces.
- What is so significant about that number?
- Well, the generally-accepted number of ounces in a metric ton is 32,150.
- If you multiply that number by six, you get 192,900.
So, last Friday,
JPMorgan booked into their eligible account exactly and precisely six metric tonnes of gold........right down to three decimal places - 192,000.000
(getting all those odd weigh bars to exactly to the perfect round oz of .000 must have been a challenge.....1,000 : 1 odds in fact)
But hold on....on this Monday
Not only did JPMorgan magically book in......... another
- precise and round number,
- the actual increase in eligible gold was reported as 96,450.000 ounces.
(You’re probably pretty good with math so I imagine you’ve already figured out)
- that that is precisely three metric tonnes.
- again to the perfect round oz .000
- that on it's own is odds of ......1,000 :1
So two days running.....odds of 1,000,000 :1
What's the odds of a ....Hat Trick ??
What do you think we saw on Weds ?
- Could JPMorgan have the audacity to report another perfect to the exact round ounce.....another number multiple of metric tons ?
- Nope.
- They simply reported.... one single metric ton !
- Again, nothing to the right... of the decimal point.
- Just 32,150.000 troy ounces, ......exact and on the nose to 3 decimal places
So that makes hat trick running odds of.....1,000,000,000 :1
Anybody thinkg - the Physical - wasn't delivered by pallet & forlift truck
- more likely fantasy paper metal....delivered in...an envelope
The reason Comex - added the disclaimer becoming even more....evident ???
Recall that back in 2007, Morgan Stanley
- paid $4.4MM to customers to settle a lawsuit
- brought by customers who had been charged storage fees on....... paper metal.
http://www.reuters.com/article/2007/06/12/idUSN1228014520070612
Old habbits ....die hard perhaps
squirrel888 - 28 Oct 2013 13:43 - 863 of 1034
Saturn filtered - mustn't let any satanic spirits in.
Karma is my best friend as is turning the other cheek. Proven time and again.
Amazing energy.
Karma is my best friend as is turning the other cheek. Proven time and again.
Amazing energy.
squirrel888 - 28 Oct 2013 13:51 - 864 of 1034
Gaz - brilliant posts. :-)
gazkaz - 30 Oct 2013 01:58 - 865 of 1034
Clips from Dizards FT Article - the suprise is....in the FT !!
Something is unsettling the animals in the forest of the gold market
The "gold price" found in a box on the homepage, has, after bouncing off its June lows of around $1,150, had a depressed September and has begun to move up again, to Friday's level of about $1,300.
Much more interesting is
- that Indians are willing to pay about ....$270 .....above the world market price,
However, the continuing high level of premiums..... for physical gold
- over the kinds you can trade on a screen suggests
- that the next move in the major gold indices or the various exchange traded funds
could be..... discontinuous and...... dramatic.
"This could turn into a very violent wake-up for (screen-traded gold).
- People talk about 'fiat currencies,'
- but we also have fiat gold.
Volatility is too cheap right now."
Taken together, this collection of persistent microeconomic signals in gold could flag macro trouble to come.
- These noises worried me in August. They worry me more now.
http://www.ft.com/intl/cms/s/0/445c613a-2ce4-11e3-8281-00144feab7de.html
Interesting article again from him ....also in the... FT back in 2011
Quote
It appears that the faulty plumbing connections in the euro-area banking system are now creating something........ I have never seen before:
- a crisis of confidence in a monetary system
- that leads to..... a frantic selloff in gold.
The partnership between the Federal Reserve and European Central Bank to provide hundreds of billions of relatively low-cost dollars for euro-area banks should have relieved the pressure to come up with greenbacks.
Yet gold market people say European commercial banks
- are being driven to lend gold for dollars at negative interest rates just to raise some extra cash for a few weeks.
There's not a lot of transparency about
- where the banks are getting the gold they are lending out,
- but it could be lent to them by either their national central banks
or by....... gold exchange-traded funds.
As James Steel, a gold market analyst for HSBC Securities (USA), says: "Until the funding difficulties at European banks are resolved,
- it is difficult for us to see ....any near-term halt....... in gold lending.
http://www.ft.com/intl/cms/s/0/4b931eec-1f5a-11e1-ab49-00144feabdc0.html
.......................................................................................................................
Suprising to see in the latter article - the FT acknowledge
- central banks
- and perhaps more so - GOLD backed ETF's
As being strog contenders for.....lending gold.... into the market....via third parties.
The suggestion (Particularly....in the FT)
- that .....the gold "you thought" was ....hopefully backing...your Gold backed ETF ...paper IOU
- might have been - lent out
- might just perhaps worry some holders of
- what might therefore just turn out to be....another.....fiat gold
gazkaz - 30 Oct 2013 08:37 - 866 of 1034
According to James Turk
- re Silver
- massive long term ....cup and handle formation....in progress
This chart is illustrating over a decade of distribution from 1980 to to the early 1990s, a decade of stabilizing, and since 2003, a decade of accumulation marked by rising prices. Silver also made its low in June, but the four months since then are hard to see on this very long-term chart.
- Nevertheless, the base being built by silver around $20 per ounce is forming the bottom of the handle.

He also comments
In many ways everything happening today regarding money and investing is unprecedented.
- But in some ways older guys like me have seen this all before, and maybe the younger people out there have read about it in history books.
- But there are many similarities today with March 1968 and the collapse of the London Gold Pool.
In the years leading to the Pool’s collapse, the central planners dishoarded 12,000 tons of gold from Ft. Knox at the unbelievably low price of $35 per ounce.
- The rest of the world gobbled up all of the gold they could get at that price until
- the central planners finally threw in the towel rather than empty their vaults any further.
We are seeing the same thing today.
- Physical metal is coming out of central bank vaults
- and their propaganda machine rarely misses a chance to disparage gold
- in the same vain attempt as the 1960s
- to make the market believe that gold is of little use here.
But try as they might,
- the central planners cannot stop people from flocking to undervalued assets like gold and silver.
In other words, the market is..... bigger than any government or group of governments .....trying to defy reality
- by making the market believe that the dollar is worthy of being the world’s reserve currency,
- when events in Washington make clear that...... it is no longer suited for that critical role in global commerce.”
- re Silver
- massive long term ....cup and handle formation....in progress
This chart is illustrating over a decade of distribution from 1980 to to the early 1990s, a decade of stabilizing, and since 2003, a decade of accumulation marked by rising prices. Silver also made its low in June, but the four months since then are hard to see on this very long-term chart.
- Nevertheless, the base being built by silver around $20 per ounce is forming the bottom of the handle.
He also comments
In many ways everything happening today regarding money and investing is unprecedented.
- But in some ways older guys like me have seen this all before, and maybe the younger people out there have read about it in history books.
- But there are many similarities today with March 1968 and the collapse of the London Gold Pool.
In the years leading to the Pool’s collapse, the central planners dishoarded 12,000 tons of gold from Ft. Knox at the unbelievably low price of $35 per ounce.
- The rest of the world gobbled up all of the gold they could get at that price until
- the central planners finally threw in the towel rather than empty their vaults any further.
We are seeing the same thing today.
- Physical metal is coming out of central bank vaults
- and their propaganda machine rarely misses a chance to disparage gold
- in the same vain attempt as the 1960s
- to make the market believe that gold is of little use here.
But try as they might,
- the central planners cannot stop people from flocking to undervalued assets like gold and silver.
In other words, the market is..... bigger than any government or group of governments .....trying to defy reality
- by making the market believe that the dollar is worthy of being the world’s reserve currency,
- when events in Washington make clear that...... it is no longer suited for that critical role in global commerce.”
gazkaz - 30 Oct 2013 08:44 - 867 of 1034
John Emby's opinion
Q: “John, you remember how the prices of gold and silver exploded roughly six times higher in price in the early 1970s as the London Gold Pool was overrun.
- Are we nearing a point where this latest Western ‘Gold Pool’ is going to be overrun?”
Embry:
- “Yes, but this time the fundamentals.... for higher gold and silver prices
- are ...materially better... than they were in the 1970s.
The other thing that doesn’t exist today is the capacity for doing what Paul Volcker did in 1980, and that is to hike interest rates to remove inflationary expectations.
This means
- that when the next inflation gets going... there will be no way to stop it.
So, on that premise the gold and silver prices are headed significantly higher
-- far beyond ...what 99% of the population ...thinks is possible.”
Embry added: “I just want to add that Andrew Maguire is exposing the truth about the true state of the gold market, and how vulnerable the paper gold Ponzi scheme is. The bottom line is gold and silver are going multiples higher than they are now, and he will be proven correct about the LBMA paper system imploding.”
gazkaz - 30 Oct 2013 08:47 - 868 of 1034
Doesn't look to....bode well.....as to where the roller coaster...may be heading
 Adjusting that for inflation.....makes the amount of leveraged money.....even more apparent
- if /when...they start heading for the exits
- the margin losses could prove to be .....a biblical type experience for many
- if/when - they start snowballing - & selling accross the shere...to cover margin losses
-could be....another one for the history books

Adjusting that for inflation.....makes the amount of leveraged money.....even more apparent- if /when...they start heading for the exits
- the margin losses could prove to be .....a biblical type experience for many
- if/when - they start snowballing - & selling accross the shere...to cover margin losses
-could be....another one for the history books
gazkaz - 30 Oct 2013 09:07 - 869 of 1034
Von Greyez thoughts
But what is very interesting is that
- while the US stock market is making new highs,
- many European stock markets are well below their 1999/2000 highs.
The principle reason for this is that the US has printed so much more money than Europe, and a lot of this liquidity has gone into the US stock market.
According to the Nobel Prize winner, Schiller,
- the inflation-adjusted S&P 500 Index is now at..... a P/E of 25,
- which is the highest at any time since 1929.
So, the reality is that, technically,
- the European markets look set up for....... a major and long-lasting decline,
- and the US is very near the end of a bull market, with horrific consequences for the US and for the world.
But inflation will not remain subdued for much longer.
- As soon as the velocity of money accelerates, inflation will super-surge, and that is likely to start in 2014.
- The trigger for the turnaround in the US economy will be the fall of the US dollar.
A reserve currency cannot be based on debt ...that is increasing exponentially,
and this is why..... the world will soon dump the dollar at an accelerated pace.
It is this fall of the dollar which will be the trigger for the major economic decline. The stock market will fall,
- bonds will fall,
- and the money printing and the velocity of money will go up dramatically.
This will be the beginning of a hyperinflationary depression.
As the dollar falls, so will the euro, yen, and the pound, but at a slower rate. This is all part of the race to the bottom for these currencies.
But the fall of the dollar should not be measured in other currencies, instead it should be measured in gold.
- And gold will soon start an exponential rise..... measured in paper money.”
Greyerz added:
“Looking at gold demand from India and China, it continues unabated.
- Premiums in the Indian market reached $100 per ounce last week.
This is an indication of a massive shortage of supply.
Meanwhile, the UK has exported well over 1,000 tons of gold to Switzerland in just the first eight months of this year.
(This was against only 85 tons last year).
This is yet more proof of the demand for gold being so much greater than the production, - as Eric Sprott recently explained in his letter to the World Gold Council.
But the reason for this massive increase in gold going from the UK, which produces virtually no gold, to Switzerland, is the fact that the Swiss refiners could not get enough supply from the mining companies -- so they had to buy from the bullion banks.
And London has the biggest concentration of 400-ounce gold bars in the world, with a large stash of central bank gold being stored there.
- And this central bank gold .....is leased into the market.
But now a lot of it is gone to the East, via Switzerland and Swiss refiners.
This clearly emphasizes that there is a massive shortage of physical gold.
- And when the holders of paper gold demand delivery,
- there will be........ the most spectacular surge in the gold price.
The good news for gold bulls is the start of that historic rise is
- not far away.... in my view.”
gazkaz - 31 Oct 2013 19:06 - 870 of 1034
We all know the US Banks have since near dawn of time itself - been forever net short the precious metal....and net short to a significantly higher ratio, than the non-US banks
- the.. non US banks.. traditionally run around a ratio of 1 : 2 Gross Shorts to Gross Long
But as we know the US banks in the participation report have since smack down...been taking full advantage to redress that position
- and....although we are aware they have ...managed to achieve a huge swing from their time eternal net short - to net long
The trend is quite significant.
MAY: U.S. Banks still NET SHORT but the ratio had declined.... to just 1.28:1
(this is the gargantuan swing - from the above net short....to a hefty...net long)
JUNE: For the first time, the U.S. Banks are NET LONG with a ratio of.... 2.09:1
JULY: The NET LONG ratio ...has grown to.... 2.79:1
AUGUST: A ....little higher at..... 2.89:1
SEPTEMBER: .....A little lower at.... 2.82:1
OK, let’s pause here for a moment.
Go back and look at the NET POSITION CHANGES
- Note that the July U.S. bank NET LONG POSITION was 44,867.
- In August, it rose to 59,473
- but, in September, it fell back to July levels at 44,906.
That’s a pretty big swing of over 30% but note that the NET LONG RATIOS barely changed over that time period.
Now let’s look at the October 1st numbers.
If we divide the 80,735 GROSS LONG position by...... the 22,368 GROSS SHORT position,
- we get a U.S. Bank NET LONG RATIO of 3.61:1
So since the beginning of the year - net short to
3.6 : 1 net long ratio
That is one helluva swing.
Saturn6 - 01 Nov 2013 08:33 - 871 of 1034
Nice work Gaz - Keep it coming.
S.
S.
| About MoneyAM | Ts and Cs | Privacy Policy | Investment Warning | Content Standards | Corporate Solutions | Advertise With Us | Site Map | © 2026 MoneyAM |
Register now for FREE
Share Prices,
Stock Quotes,
Charts, Bulletin Boards, Indices, Watchlists, Portfolio, Market News, Research
or see our Premium Services including Level 2, Terminal and much more.