
| Home | Log In | Register | Our Services | My Account | Contact | Help |
You are NOT currently logged in
Davai - 18 Apr 2012 11:13


Thread designed to record set-ups and targets on index and FX pairs.
'A market is only your enemy until you understand it, then it becomes your best friend.'
Any questions, please feel free to ask.
From time to time i may openly state an opinion regarding direction of a set-up and wish to add that in no way am i recommending a trade. I am sometimes only in trades for a matter of minutes and can't always update as to entry/exits taken.
As always, markets are dangerous places to be and must be respected as such. Always use stop losses and never over-leverage; 3% of your pot as a maximum per trade. As always, YOU are responsible for your own trades! Happy pip hunting!
Click HERE to visit me at FXtechnicals.net
Davai - 15 May 2012 11:41 - 88 of 423
Back to the loonie as of last nights chart (above);

and in closer detail, for this morning;

and in closer detail, for this morning;

Davai - 15 May 2012 12:24 - 89 of 423
Extending diagonal on the (5th of the) minuette 1st, bit of pain yet before the 3rd!


Davai - 15 May 2012 20:19 - 90 of 423

Davai - 15 May 2012 21:01 - 91 of 423

Davai - 16 May 2012 13:36 - 92 of 423
If the first small 'i'/'ii' is too risky to determine, we look for a follow on 5w up, half position entered long on pullback to a fib level. In this instance such a deep pullback, gives a fantastic low risk entry at points 'a' & 'c', wave structure here is very important, with 'a' being down in 3, it was going to be either a flat or irregular correction, sure enough, 'b' heads right back up nearly retracing all of 'a' and 'c' making a slightly LL. More confirmation comes with a break of the top of '1' by a full pip, enter second half of position long and look to fibs for target once the 3rd can be determined...

Davai - 16 May 2012 19:50 - 93 of 423

Davai - 18 May 2012 08:37 - 94 of 423
Respite for the markets. This is a perfect 5w count;


Davai - 18 May 2012 08:38 - 95 of 423
Davai - 15 May 2012 21:27 - 8189 of 8202
I do have a primary target for the Dow;

Update;

I do have a primary target for the Dow;
Update;

Davai - 18 May 2012 10:58 - 96 of 423
Get ready for a small pullback on the Dow;
12,500, 138.2% fib obvious target. Round number and was support yesterday, therefore, def resistance today

12,500, 138.2% fib obvious target. Round number and was support yesterday, therefore, def resistance today

Davai - 18 May 2012 11:57 - 97 of 423
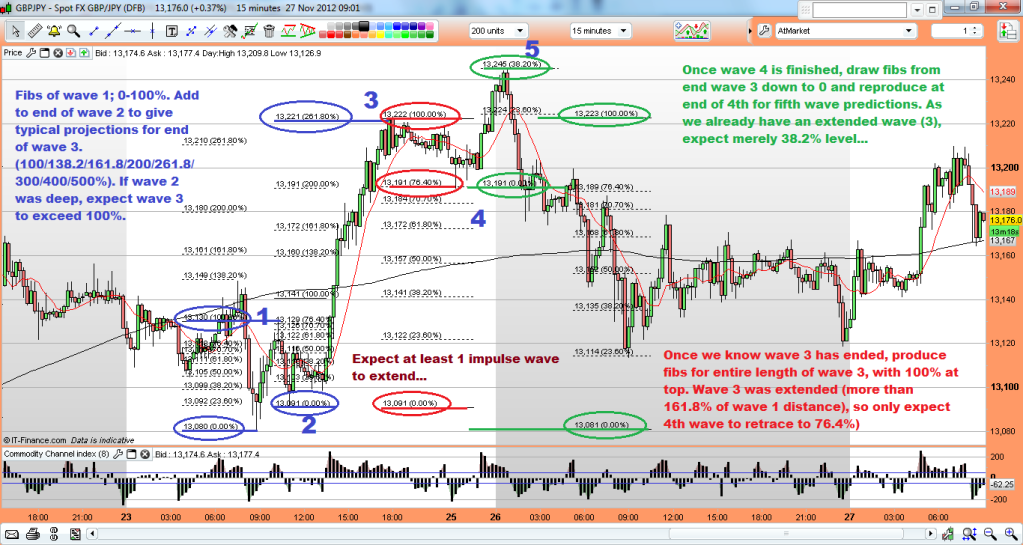
Further to post 94, for extra confirmation of the end of the 5th wave, (not that its needed in this instance), but... draw a line connecting bottom of waves 2&4, then drag a parallel line touching end of wave 3, wave 5 will usually slightly exceed the line;


Davai - 18 May 2012 13:22 - 98 of 423
My plan to work to for the summer;
(need to move the red 'B' across to incorporate the wedge, leaving red 'C' as a 5w down)

(need to move the red 'B' across to incorporate the wedge, leaving red 'C' as a 5w down)

Davai - 22 May 2012 14:47 - 99 of 423
A perfect trade;

After a recent short target was reached on the above chart, coinciding with my Cad target (above) and the Dow twin Fib targets, i was suspecting a bounce;
(Davai - 18 May 2012 08:37 - 94 of 98
'Respite for the markets. This is a perfect 5w count;'),
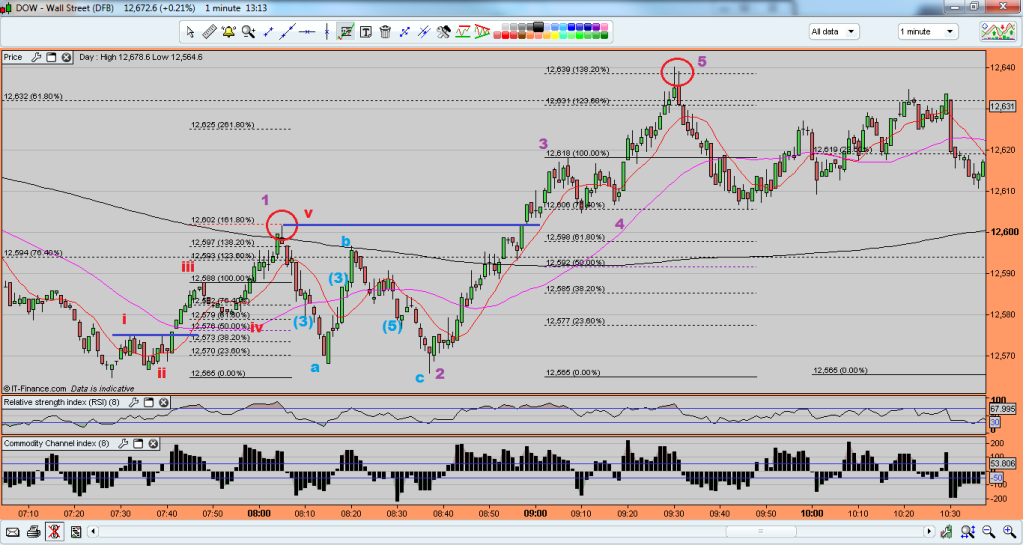
So we watch for an ABC. The important part is that 'A' breaches the last significant high, (as shown by the blue line in the above chart), now we wait for 'B' to retrace and then turn back upwards, to start wave 'C'. This will be in 5 waves. With that knowledge, we wait for wave 1 to end and draw our fib levels, wave 2 should retrace in 3 minor waves and bounce off of one of those fib levels. we can now draw a flagline starting from the top of 'A' and touching the top of wave 1. Using my system, i get a trigger upon breakout where i can determine a target price for the set-up. Stop is a pip below the lowest point of the pullback ('B'), target is equal distance away from entry, thus a risk:reward of 1:1, but very high probability. This rises still further when you look at the fib level of 261.8%. This is often a target off of wave 1 for either the end of the 3rd wave or even the whole 5 waves, look how it is identical to my system generated target...
It looks like this is ABC of A, followed by tonights drop being ABC of 'B', so a larger 5 wave C to come over next couple of days, this should also mean higher yet for index's before one more drop...

After a recent short target was reached on the above chart, coinciding with my Cad target (above) and the Dow twin Fib targets, i was suspecting a bounce;
(Davai - 18 May 2012 08:37 - 94 of 98
'Respite for the markets. This is a perfect 5w count;'),
So we watch for an ABC. The important part is that 'A' breaches the last significant high, (as shown by the blue line in the above chart), now we wait for 'B' to retrace and then turn back upwards, to start wave 'C'. This will be in 5 waves. With that knowledge, we wait for wave 1 to end and draw our fib levels, wave 2 should retrace in 3 minor waves and bounce off of one of those fib levels. we can now draw a flagline starting from the top of 'A' and touching the top of wave 1. Using my system, i get a trigger upon breakout where i can determine a target price for the set-up. Stop is a pip below the lowest point of the pullback ('B'), target is equal distance away from entry, thus a risk:reward of 1:1, but very high probability. This rises still further when you look at the fib level of 261.8%. This is often a target off of wave 1 for either the end of the 3rd wave or even the whole 5 waves, look how it is identical to my system generated target...
It looks like this is ABC of A, followed by tonights drop being ABC of 'B', so a larger 5 wave C to come over next couple of days, this should also mean higher yet for index's before one more drop...
Davai - 23 May 2012 08:06 - 100 of 423
Trending perfectly and reversing after each target is achieved;


Davai - 24 May 2012 20:00 - 101 of 423
Davai - 24 May 2012 10:11 - 8240 of 8247
My current thoughts are with my original chart of last night. We have just played out an abc 4th, which was far longer in timescale due to overnight futures. We head up for a 5th and then back down in an abc corrective (probably tonight), this would mean much higher early next week;

(with regards to above comments; i forgot that it is Thursday today! Tomorrow should be a big up day, prob Mon/Tues for reversal back down, but too early to tell just yet...
Davai - 25 May 2012 08:14 - 102 of 423
Update to above, (as of last night);

This morning has also seen a spritely start!

This morning has also seen a spritely start!
Davai - 25 May 2012 14:18 - 103 of 423
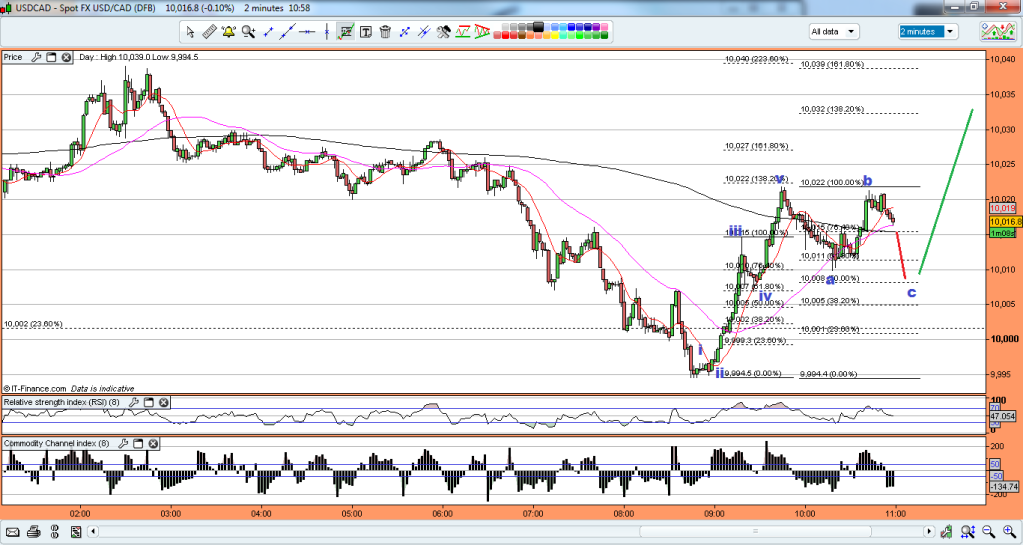
Ok, was expecting a normal 5w impulse move for C, but now looks more likely a diagonal;


Davai - 26 May 2012 10:21 - 104 of 423
(copied across from the other thread)
Davai - 26 May 2012 10:15 - 8257 of 8257
Look how easily the pattern changes hinged on the length of the (iv)th, its now likely to be an expanding diagonal;

I do have a system target of 1348, but watching with interest as we are in an ABC counter-trend move and thus i don't have enough evidence yet to call that with conviction... If it does reach that level, it will surely reverse thereabouts...
Davai - 26 May 2012 14:58 - 105 of 423
The Loonie also looks like down from the open on Sunday night, (dollar weakness = markets up);


Davai - 27 May 2012 21:48 - 106 of 423
NzdUsd leading the way tonight and similar to the above index chart predictions;


Davai - 28 May 2012 11:47 - 107 of 423
Update to above;


| About MoneyAM | Ts and Cs | Privacy Policy | Investment Warning | Content Standards | Corporate Solutions | Advertise With Us | Site Map | © 2026 MoneyAM |
Register now for FREE
Share Prices,
Stock Quotes,
Charts, Bulletin Boards, Indices, Watchlists, Portfolio, Market News, Research
or see our Premium Services including Level 2, Terminal and much more.