
| Home | Log In | Register | Our Services | My Account | Contact | Help |
You are NOT currently logged in
Technical Analysis (TA)
ptholden

 - 09 Jul 2007 23:14


I often find all manner of reference to Technical Analysis whilst reading threads, questioning certain elements, asking for advice on indicators and also requesting advice on a stock and whether it's a good time to buy, sell, hold or remain indifferent. I am the first to admit that my own TA is still in its infancy, but I do spend time on expanding my knowledge (hopefully in the right direction!).
Rather than having to ask a TA question on a particular thread, perhaps this thread could be used as a forum for TA queries and become a knowledge base. Just a thought, if there is little or no interest, the thread will sink without trace and that will be the end of that. I will personally add a few snippets to help those with less knowledge (if that's possible) to keep things rolling. There is a danger that the thread will receive countless requests for opinions on a variety of stocks and there is only so much I can do alone, therefore I would more than welcome input from other posters, no matter how rudimentary they believe their own knowledge to be, hopefully some real experts will take the time to contribute.
Rather than having to ask a TA question on a particular thread, perhaps this thread could be used as a forum for TA queries and become a knowledge base. Just a thought, if there is little or no interest, the thread will sink without trace and that will be the end of that. I will personally add a few snippets to help those with less knowledge (if that's possible) to keep things rolling. There is a danger that the thread will receive countless requests for opinions on a variety of stocks and there is only so much I can do alone, therefore I would more than welcome input from other posters, no matter how rudimentary they believe their own knowledge to be, hopefully some real experts will take the time to contribute.
ptholden
- 13 Jul 2007 12:49
- 93 of 504
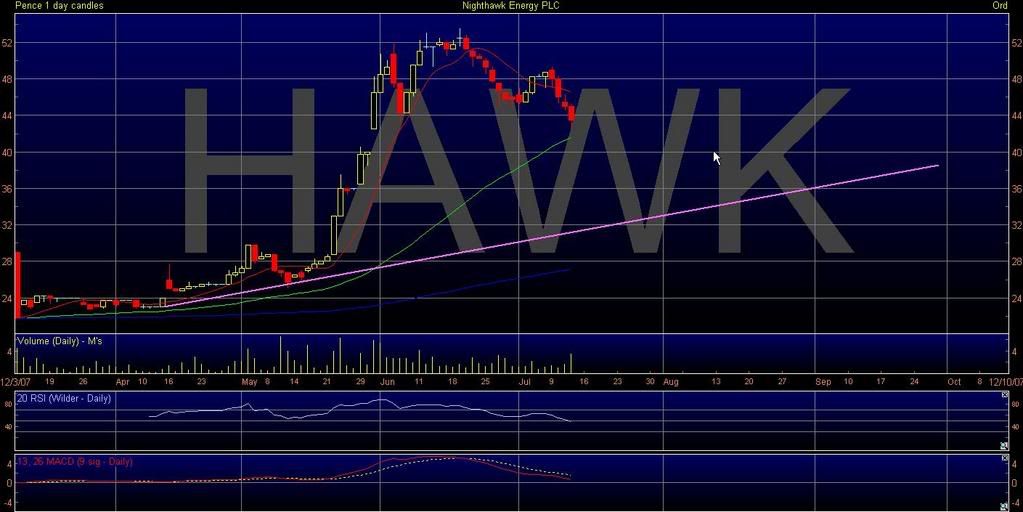
Not really a lot to go on in trendline world, I have drawn the main from admission (more or less) so worst case scenario is support at 32p, if it tanks, which I doubt it will. So, trying to judge the rate of fall, I would suggest a 35p support level.
In cases like this where a rapid move in the price action takes place, TA officionados often take one of two approaches or a combination of both. Clearly the SP will retrace at some point, but when it starts where will it stop? There is the popular 50% rule, ie, the SP will retrace 50% of the last move; in this case this is equal to 39p. The other approach is 33% and 67% retracement of the last move, the 67% level is absolutely critical, if it does more than 67% it is more or less assured that a full 100% retracement will take place. Well, the 33% has already gone (44p), so 39p (50%) is the next level to look for and then 67% which spookily enough is at 35p!!
Incidentally you may be aware that these percentage levels are derived from the Fibonacci numbers sequence (made famous by Dan Brown's Da Vinci Code) which forms the basis of Dow Theory and Elliot Wave Theory.
In summary then I don't see any reason to buy at the moment, look for support at 39p and then 35p.
pth
maggiebt4
- 13 Jul 2007 13:36
- 94 of 504
Would somebody please look at emg for me Has passed last high and is still below 70 on RSI so I think it has a bit more to go would appreciate your input
ptholden
- 13 Jul 2007 14:36
- 95 of 504
Here you go Maggie, EMG
![<a href=]()
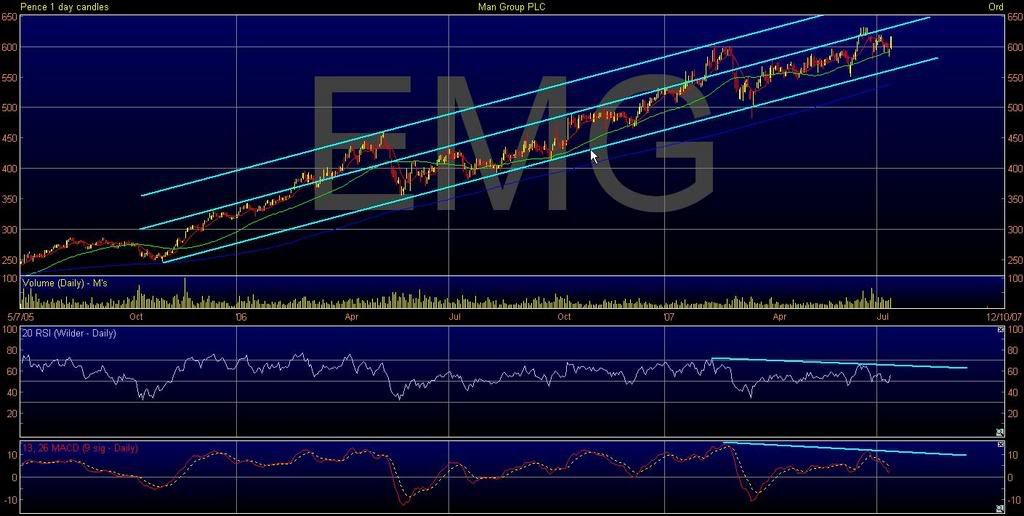
I don't know if you are trading EMG or simply investing, it may make a difference to your strategy.
Please note that today's price action is not included, but I will update later.
As you can see from the chart EMG is chugging along in a nice bullish channel, the mid line of which I have also drawn. It certainly seems to prefer the lower half of the channel, occasionally popping out to the upper half. Both the MACD and RSI are showing bearish divergence, which would seem to indicate that the latest move is coming to an end. Today's rise certainly means it is nudging the mid channel trendline (resistance) and the RSI must be close to its own resistance line also. I would certainly keep an eye out for any weakness now and perhaps take profits as any retracement could take the SP back to trendline support at 575p. Incidentally the 635p-640p level is also an all time high resistance level, coincidental with the rising trendline resistance, perhaps another reason to take profits at the moment. No-one ever went bust taking a profit :)
pth
maggiebt4
- 13 Jul 2007 15:37
- 96 of 504
Many thanks pth I trade and invest with this share missed last rise trading but am sitting on reasonable profit in shares so will probably set a stop loss. Only started reading this thread and think I'm beginning to understand TA a bit more. Keep up the good work both of you, very interesting.
ptholden
- 13 Jul 2007 18:34
- 97 of 504
Time for the evening updates:
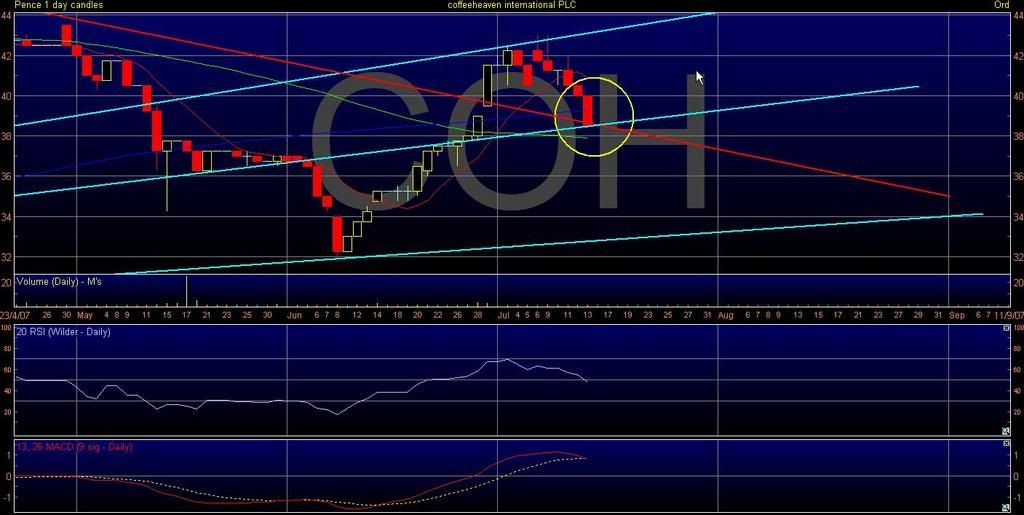
COH is now sitting on both uptrend and downtrend support, if it isn't going to 34p needs to make a recovery here. Not much to say it will, although the 50 MA is in the vicinty and that may help, but RSI still falling and MACD signal crossing down.
ptholden
- 13 Jul 2007 18:34
- 98 of 504
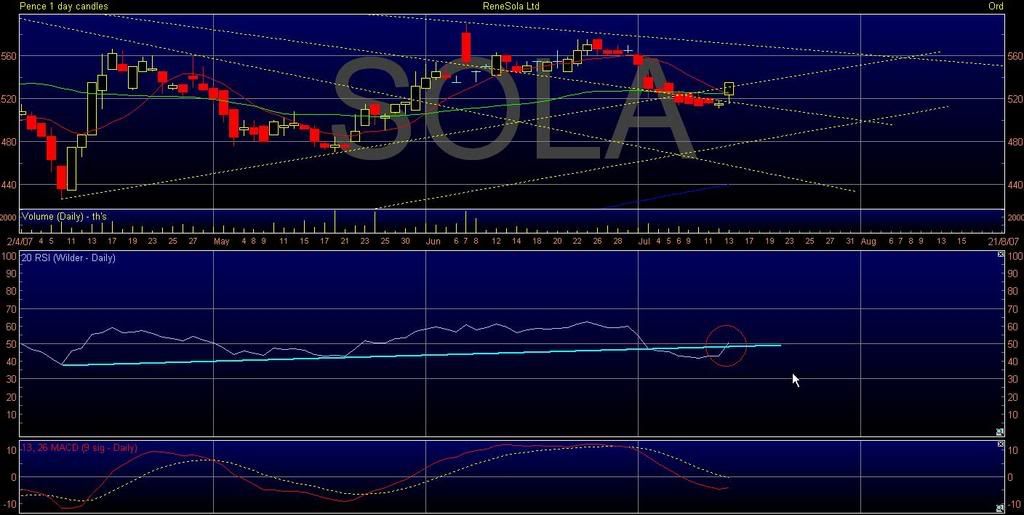
Anyone short on SOLA needs to exercise some caution now. Todays rise (albeit on slim volumes) has pushed through an important uptrend, just; the RSI has also broken through resistance, just. MACD is turning up, although a little way to go before entering positive territory. Certainly before going long, I would be looking for a signal line crossover on the MACD (red line over the yellow dotted line) and a centreline crossover into positive territory (above zero). As far as being short is concerned I would be looking to see if the uptrend line is going to provide support on Monday, if it does there's no reason not to believe that a return to 560p is on the cards. Sitting on the fence now with this one.
pth
ptholden
- 13 Jul 2007 18:35
- 99 of 504
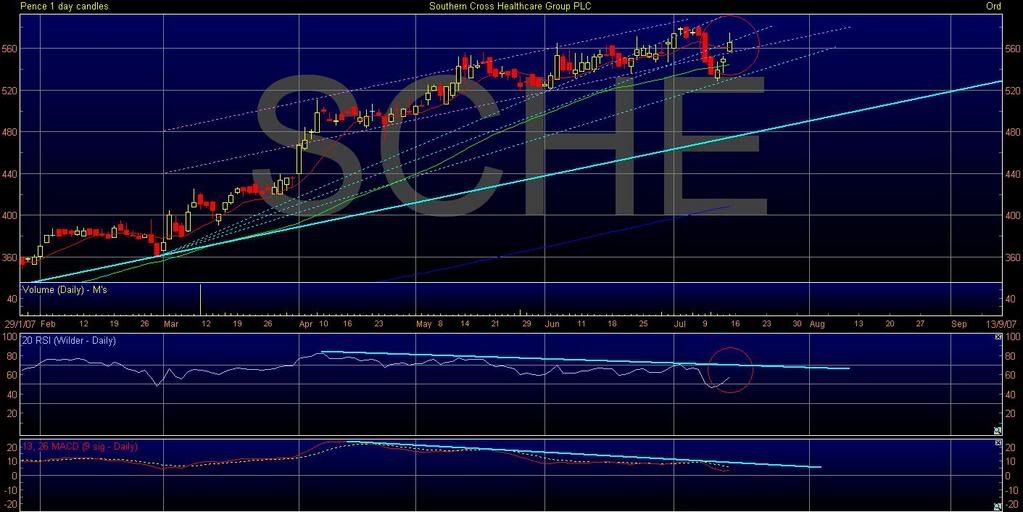
Pleased I didn't short SCHE at 560p! I have drawn a new uptrend line following the confirmed bounce from 530p ish. The rise today has pushed the SP back into the shallower bullish channel, although it did meet resistance from one of my uptrends and subsequently fell back. It looks like both the RSI and MACD still have room for a further rise before meeting resistance, so I'm going to have to eat humble pie and suggest that somewhere in the region of 580p, even 600p may be on the cards. Having said that, I remain convinced this is a shorting opportunity, the bearish divergence on the MACD hasn't changed, problem is finding the right shorting level.
pth
ptholden
- 13 Jul 2007 18:37
- 100 of 504
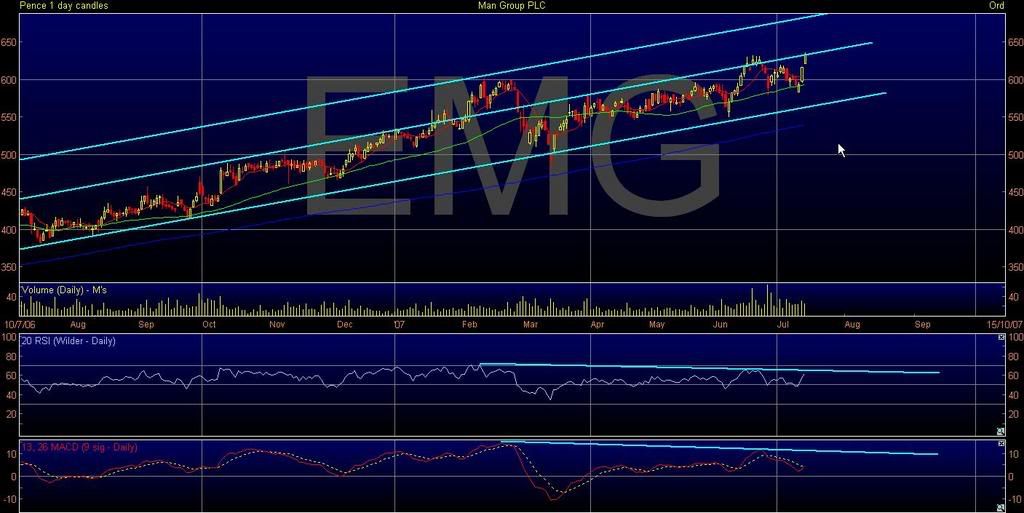
One for Maggie: EMG finished the day having a go at that uptrend resistance. Keep a careful eye on this level, it has three levels of resistance to fight through, all at the same place; trendline res, RSI res and the all time high factor. If it does continue its rise it will be a chart breakout and looking good, any weakness and a fallback as previously mentioned is the likely outcome.
pth
ptholden
- 13 Jul 2007 18:38
- 101 of 504
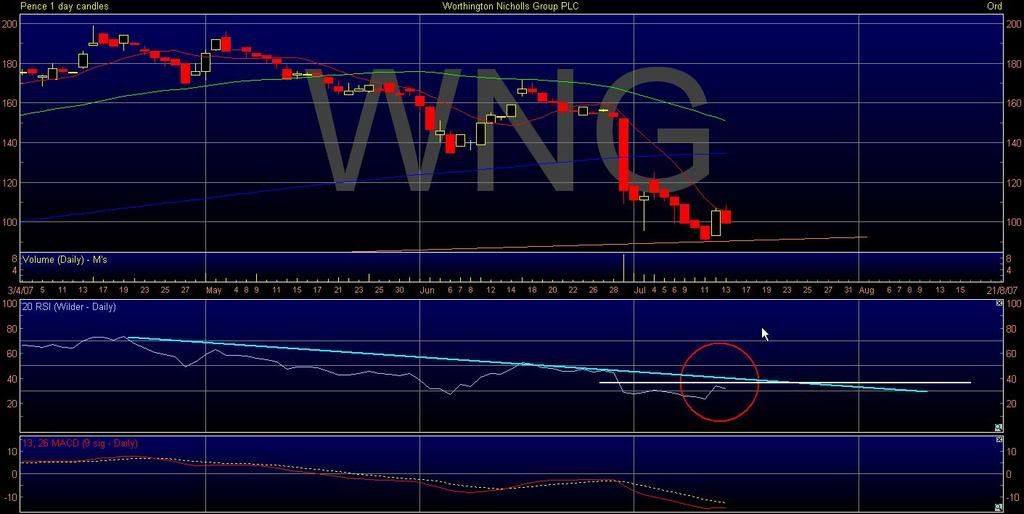
WNG fell back today pretty much as expected. Yesterday's rise posted a BUY indication on the RSI and I have drawn an additional line on this indicator (white horizontal) where should the SP recover to above this level next week a confirmed BUY signal will be given, a classic failure swing. Incidentally anyone buying yesterday as the RSI broke above 30 is probably sitting on a loss at the moment - moral of the story - wait for confirmation, not just an indication.
pth
ptholden
- 13 Jul 2007 18:38
- 102 of 504
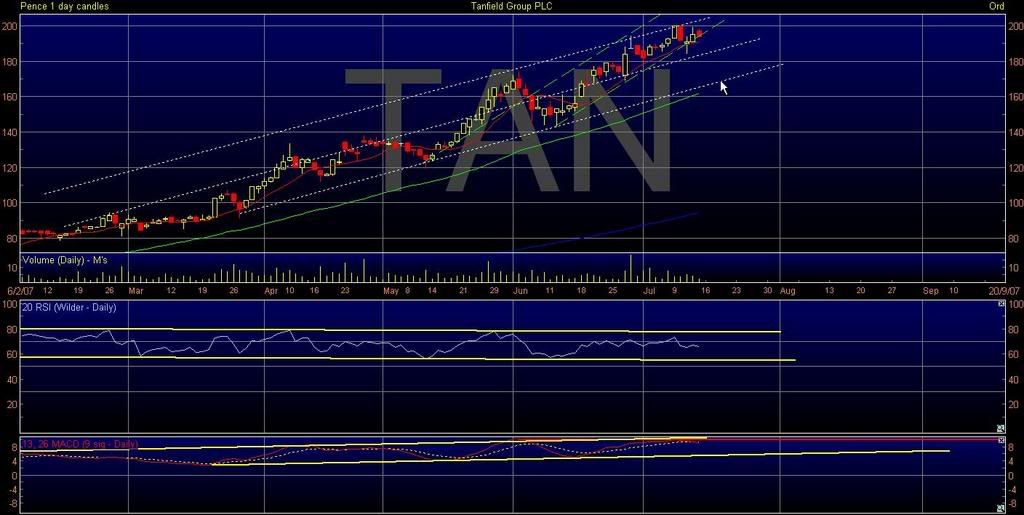
TAN tried again for 200p but once again fell back. Still hanging onto that steeper channel, but rather tenuous. Still think a smallish correction is due to the region of 180p-185p. RSI is rather inconclusive now, but MACD still capped by a resistance line and continuing to ease off.
pth
cynic
- 14 Jul 2007 10:14
- 103 of 504
i posted the following on the SOLA thread in response to a childish outburst from a certain memeber, but it has some relevance here ......
it is a common misconception, that investors who make use of charts (of which there are many varieties), are stupid enough to think they are the Holy Grail, which of course they are not, though they are very useful tool ....... nevertheless it takes a narrow-minded bigot (none spring immediately to mind!) to refuse to accept that charts and market/share movements are inextricably linked, not least because so many PI investment decisions and computer trading programmes are (effectively) based on or triggered by them ...... thus, whether illogical or not, charts are frequently self-fulfilling.
I'll just expand on charts just a little, though i confess no real knowledge or expertise whatsoever .......
i am a thicko, so i just use the very basic charts that are available on MAM from which i can easily read various daily moving averages and also the rsi ..... on occasion i will also insert a x-hair to highlight a certain price level .... these basic charts will also show up historical price movements and also give a simple straight line indication of where support/resistance could well lie.
PT is a much more sophisticated and intelligent chap, so he can work with and understand a much more sophisticated form of chart which allows the insertion of various lines and angles connecting salient price levels etc ...... for all that it is not entirely surprising that both PT and I often reach the same conclusion, but from slightly different angles, if you will excuse the pun.
finally, my very clever friend who works in the City, uses something called GANN theory, which is a rather more sophiticated version of PT's ...... this works not only on salient price levels, but also incorporates time angles and/or % rises/falls.
However, i would repeat for followers of this thread and even for the odd narrow-minded bigot who may read this, that charts can never be the Holy Grail or we would all have a huge stash of cash and/or private islands and very large yachts ...... a chart is a tool to help investment decisions ..... the amount one relies on them is personal, like any other investment decision.
Darradev - 14 Jul 2007 10:39 - 104 of 504
Morning Mr C and Mr P. Thanks for sharing your knowledge and experience in this, it makes for some better informed decisions all round.
Can I ask, is TA applicable for all market caps and industry sectors. I presume that it is more 'robust' for larger caps with greater uncertainty for minows or younger Co's.
Anyway, I am currently following a smaller oiler OEX (Oilex) and wondered if this type of analysis is appropriate for them. They are dual listed in UK and Australia. If you have an opportunity to examine it for me I would appreciate your comments.
Thank you.
cynic
- 14 Jul 2007 10:53
- 105 of 504
MR D ..... in answer to your Q, the simple answer is yes ..... however, minnows by cap rather than sp have such restricted liquidity, that their share movements can be easily and significantly distorted by relatively small purchases or sales; on e would hesitate to use the word manipulated!
David10B
- 14 Jul 2007 10:58
- 106 of 504
I would concur, and as I bottom fish in the small caps department, I find TA of limited use, although that said it would be better if I undertstood it better.
ptholden
- 14 Jul 2007 20:06
- 107 of 504
Darradev
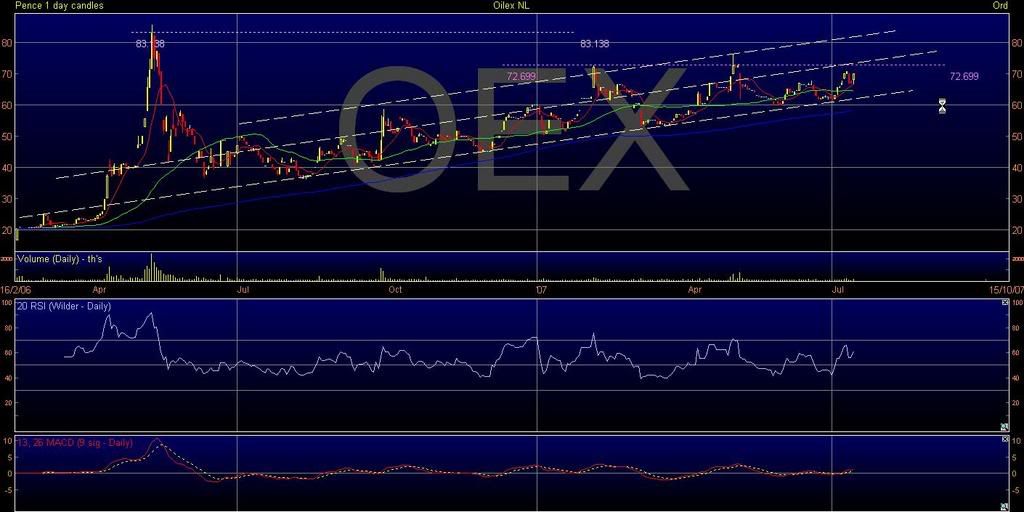
My answer to your question is an unreserved YES, but then you would probably expect me to say that. I also think you are absolutely right re your comment larger caps versus small caps and TA applicability. But I would say it's not the market cap that matters but the length of time in which a company has been established on which to build a picture, but I kinda think you meant that anyway. As far as OEX is concerned, oh yes indeedy.
I really like this chart. I know nothing about them, but it would appear they were admitted early 2006 and I would hazard a guess that they have income from production or at the least income from somewhere. This isn't the chart of a exploration company with the associated dips and highs dependant on drilling results
To the chart. The SP is in a great bullish channel and has found support on numerous occasion from the lower trendline, because of this, the trendline is very important to any future dips. The middle and upper trendlines of the channel are not quite so well pronounced but they serve a purpose. The current move is obviously up and the question is will it pop through the mid line or bounce off? Well, I can't answer that, but what I can say is that not only does it need to push through there it also needs to push through resistance at 73p, established from two previous highs (although not the all time high which is at 83p). There is certainly scope on both the RSI and MACD for such a move but it must be accompanied by volume. If it does push through this level, the stock may well enter a new phase as this resistance level should then become support. If it fails to push through keep a close eye on the lower trendline, any retracement MUST be supported by this line. Were I already invested in this stock I would at the very least set a stop loss at 60p and even consider taking profits if the price fails at 73p, with a view to buying back in at the support level.
Hope all that helps.
pth
.
![<a href=]()
My answer to your question is an unreserved YES, but then you would probably expect me to say that. I also think you are absolutely right re your comment larger caps versus small caps and TA applicability. But I would say it's not the market cap that matters but the length of time in which a company has been established on which to build a picture, but I kinda think you meant that anyway. As far as OEX is concerned, oh yes indeedy.
I really like this chart. I know nothing about them, but it would appear they were admitted early 2006 and I would hazard a guess that they have income from production or at the least income from somewhere. This isn't the chart of a exploration company with the associated dips and highs dependant on drilling results
To the chart. The SP is in a great bullish channel and has found support on numerous occasion from the lower trendline, because of this, the trendline is very important to any future dips. The middle and upper trendlines of the channel are not quite so well pronounced but they serve a purpose. The current move is obviously up and the question is will it pop through the mid line or bounce off? Well, I can't answer that, but what I can say is that not only does it need to push through there it also needs to push through resistance at 73p, established from two previous highs (although not the all time high which is at 83p). There is certainly scope on both the RSI and MACD for such a move but it must be accompanied by volume. If it does push through this level, the stock may well enter a new phase as this resistance level should then become support. If it fails to push through keep a close eye on the lower trendline, any retracement MUST be supported by this line. Were I already invested in this stock I would at the very least set a stop loss at 60p and even consider taking profits if the price fails at 73p, with a view to buying back in at the support level.
Hope all that helps.
pth
.
David10B
- 15 Jul 2007 12:34
- 108 of 504
Good morning chaps, do you know what we used to call you technical guys, when in the service, the boffins in the back room.
Anyhow enough trivia, would you kindly take a look at the GDP thread, and perhaps add your most welcomed input.
Thanks and have a really nice day.
Anyhow enough trivia, would you kindly take a look at the GDP thread, and perhaps add your most welcomed input.
Thanks and have a really nice day.
ptholden
- 15 Jul 2007 19:50
- 109 of 504
Dunno wot you are posting Thrush, cos you are in the squelch bin and there to stay. Do me a favour (and the rest of AM posters) stay off this thread, we don't need it cluttering up with your rubbish. A polite request.
David10B
- 15 Jul 2007 19:59
- 110 of 504
When you point out the specific rubbish that I post I will consider your request, meanwhile I dont know your background but try some manners, they work much better than your obvious preference for ignorance.
Are you the now self appointed spokes person for AM?--THAT WOULD BE A RATEHR LIMITED APPLICATION and one of little value to total enlightenment.
Prima donnas can be so very /hypertechey would you not agree.
Are you the now self appointed spokes person for AM?--THAT WOULD BE A RATEHR LIMITED APPLICATION and one of little value to total enlightenment.
Prima donnas can be so very /hypertechey would you not agree.
Darradev - 15 Jul 2007 20:39 - 111 of 504
Thanks pth, I liked the look of the chart as well, but this was based on 'gut feel' and the use of a simple plastic ruler on the screen, so your more comprehensive analysis is reinforcing what I was thinking. I am not into the 'jargon' of TA but for me it looks like a repeating wave pattern on a two monthly cycle with an positive uptrend.
I provided some background on the OEX thread as to why I have chosen this particular share if you are interested.
Once again, thank you for your analysis.
I provided some background on the OEX thread as to why I have chosen this particular share if you are interested.
Once again, thank you for your analysis.
ptholden
- 15 Jul 2007 20:58
- 112 of 504
Darradev, for someone who isn't into the 'jargon' of TA you are doing a good job - 'repeating wave patterns' no less. I will have a look at the thread, thank you.
pth
pth
| About MoneyAM | Ts and Cs | Privacy Policy | Investment Warning | Content Standards | Corporate Solutions | Advertise With Us | Site Map | © 2026 MoneyAM |
Register now for FREE
Share Prices,
Stock Quotes,
Charts, Bulletin Boards, Indices, Watchlists, Portfolio, Market News, Research
or see our Premium Services including Level 2, Terminal and much more.