
| Home | Log In | Register | Our Services | My Account | Contact | Help |
You are NOT currently logged in
Technical Analysis (TA)
ptholden

 - 09 Jul 2007 23:14


I often find all manner of reference to Technical Analysis whilst reading threads, questioning certain elements, asking for advice on indicators and also requesting advice on a stock and whether it's a good time to buy, sell, hold or remain indifferent. I am the first to admit that my own TA is still in its infancy, but I do spend time on expanding my knowledge (hopefully in the right direction!).
Rather than having to ask a TA question on a particular thread, perhaps this thread could be used as a forum for TA queries and become a knowledge base. Just a thought, if there is little or no interest, the thread will sink without trace and that will be the end of that. I will personally add a few snippets to help those with less knowledge (if that's possible) to keep things rolling. There is a danger that the thread will receive countless requests for opinions on a variety of stocks and there is only so much I can do alone, therefore I would more than welcome input from other posters, no matter how rudimentary they believe their own knowledge to be, hopefully some real experts will take the time to contribute.
Rather than having to ask a TA question on a particular thread, perhaps this thread could be used as a forum for TA queries and become a knowledge base. Just a thought, if there is little or no interest, the thread will sink without trace and that will be the end of that. I will personally add a few snippets to help those with less knowledge (if that's possible) to keep things rolling. There is a danger that the thread will receive countless requests for opinions on a variety of stocks and there is only so much I can do alone, therefore I would more than welcome input from other posters, no matter how rudimentary they believe their own knowledge to be, hopefully some real experts will take the time to contribute.
banjomick
- 18 Jul 2007 22:44
- 141 of 504
lol,I do dabble else where but i'm rather fond of those two companies and following them closely over the years has given me a very good insight into the AIM and the way things work in the markets generally. All good fun.
maggiebt4
- 18 Jul 2007 23:10
- 142 of 504
Fantastic call PTH but unfortunately I have no patience and went back in today in shares It was just too tempting! but will wait for direction to make a spread bet now that i understand what you mean. One question - as the upper & lower rsi trend lines are going to meet could one conclude that it has to break out either way, soon, to create new trendlines?
ptholden
- 18 Jul 2007 23:26
- 143 of 504
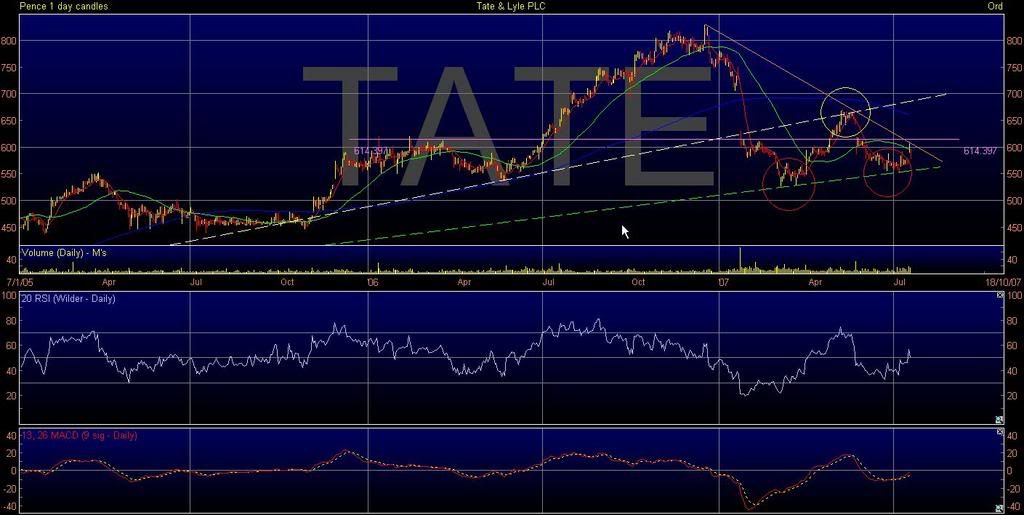
Garfee - tate & Lyle.
First a description of the trendlines; The whie dashed uptrend point of origin is July 2005 (as is the green). The SP used this as support until the sell off at the beginning of this year when the stock 'gapped' through. You can see why the recovery in May stalled as this previous support turned into resistance (circled in white). Once gapping through a new shallower uptrend was established (green dashed line) and this has been tested on a few occasions to good effect. You can also see that a downtrend is evident from the Dec high. There is also historical SP resistance at 615p converging in roughly the same vicinity.
Effectively to overcome both of these the SP needs a good push with good volume. Although not shown on this screenshot, the On Balance Volume (smooths out the daily 'Manhattan' volume indicator to a single line) has been falling since the last high. Not sure it's ready to have another thrash yet at breaking up, there may be a little more weakness first. If going long stick a stop in around 550p-555p.
pth
![<a href=]()
First a description of the trendlines; The whie dashed uptrend point of origin is July 2005 (as is the green). The SP used this as support until the sell off at the beginning of this year when the stock 'gapped' through. You can see why the recovery in May stalled as this previous support turned into resistance (circled in white). Once gapping through a new shallower uptrend was established (green dashed line) and this has been tested on a few occasions to good effect. You can also see that a downtrend is evident from the Dec high. There is also historical SP resistance at 615p converging in roughly the same vicinity.
Effectively to overcome both of these the SP needs a good push with good volume. Although not shown on this screenshot, the On Balance Volume (smooths out the daily 'Manhattan' volume indicator to a single line) has been falling since the last high. Not sure it's ready to have another thrash yet at breaking up, there may be a little more weakness first. If going long stick a stop in around 550p-555p.
pth
ptholden
- 18 Jul 2007 23:46
- 144 of 504
Maggie, well it will break out one way or another but not necessarily to establish a new trend, but to confirm a direction, although this may be short term. Don't get to wrapped up with the RSI, I think it has its uses when above 70 and below 30 and also to determine a possible trend in the SP, but it can whipsaw around, so be careful in its use.
pth
pth
Socrates
- 19 Jul 2007 10:10
- 145 of 504
PTH
I quite like the look of UNIQ chart, I've no idea what is driving it but as long as it trends up I'm happy. I'm no expert, but I agree with your post 144 about RSI, unless it is supported by other indicators it can be misleading. I believe UNIQ could be a case in point, where the RSI(14) of about 85 today is supported by momentum and divergence.
I quite like the look of UNIQ chart, I've no idea what is driving it but as long as it trends up I'm happy. I'm no expert, but I agree with your post 144 about RSI, unless it is supported by other indicators it can be misleading. I believe UNIQ could be a case in point, where the RSI(14) of about 85 today is supported by momentum and divergence.
ptholden
- 19 Jul 2007 23:33
- 146 of 504
No charts tonight, too knackered after yet more golf, but a few updates.
SOLA - Quietly tracking up its rising support on very subdured volume. Wouldn't go long or go short at the moment, but would continue to sit still if a holder.
WNG - Despite today's fall after a positive start, the RSI failure Swing remains intact. Rising support at 92p, falls through there time to think again.
EMG - Bounced off the middle of the 'new channel' to return to slightly suspect support at 600p. The bottom of the rising channel is now at 594p, so keep an eye on that support. If that does fail, maybe a return to the original shallower channel with rising support at 572p.
SCHE - Was under the opinion that 600p was the next target, although not quite so sure now. Room for further gains on the RSI, but starting to bounce off MACD resistance, which continues to display considerable bearish divergence. This just has to be a short soon (famous last words).
TAN - Still trying to get through that 200p level. Now this won't be make me very popular with TAN holders and I can't reaaly explain why I think this is going to happen, except that the SP growth has been exceptional and there should be corrections every now and again. I did think that the SP would fall back a touch to the 180s before breaking 200p. Rather than falling back we have witnessed a consolidation in a tight range. Sticking my neck out an awful long way, TAN will either fail totally at 200p and fall back to 175p-180p or break through, stall at 207p-210p and then fall back to the same level. Don't listen to me though, this scenario might be nuts!
See what happens tomorrow :)
pth
ptholden
- 19 Jul 2007 23:54
- 147 of 504
Socs, totally agree. Have had a look at the UNIQ chart and you are right to like the look of it. Nice breakout above res levels established over the last year and a bit. RSI looking toppy now though at 80(20), a level it hasn't got through over the same period. Wouldn't short it just because of that though, but wouldn't be surprised to see some retracement back to the breakout level of 239p. Actually wish I had been looking at this chart in May when it broke through that downtrend. Nice 15% profit or so to be had from that level, but aint hindsight a wonderful thing :)
pth
pth
ptholden
- 20 Jul 2007 00:03
- 148 of 504
Fliper
Regency Mines is a toughie, these tiddlers are quite difficult to predict, especially when one has just had a rocket up its arse! 1.5p to 8p is quite a rise and the trend is near vertical. Best I can do is suggest a retracement to somewhere in the region of 5p - 5.5p which eqautes to 50% of the last move, assuming of course that there is a retracement. Difficulty is wanting to be in, but not near the top, then the git carrys right on up. Personally, I've had enough of these real micro stocks and ending up locked in. I'm gonna stick with trending FTSE 100. 250, 350 type stufff, make 10% or so and move on. It will all add up!!
pth
ptholden
- 20 Jul 2007 00:05
- 149 of 504
Garfee
If you want to post charts, you need to find a site to host your files. I use 'photobucket.com'. Upload the file, copy the html code, click on the 'paste image' when adding a post here, paste, post mesage and hey presto!
pth
If you want to post charts, you need to find a site to host your files. I use 'photobucket.com'. Upload the file, copy the html code, click on the 'paste image' when adding a post here, paste, post mesage and hey presto!
pth
banjomick
- 20 Jul 2007 00:07
- 150 of 504
PTH,If you have any spare time I would be interested in your views on GON and MDW,chart wise.Feel free to post on thread or here,whether +/-,cheers in advance.
ptholden
- 20 Jul 2007 19:52
- 151 of 504
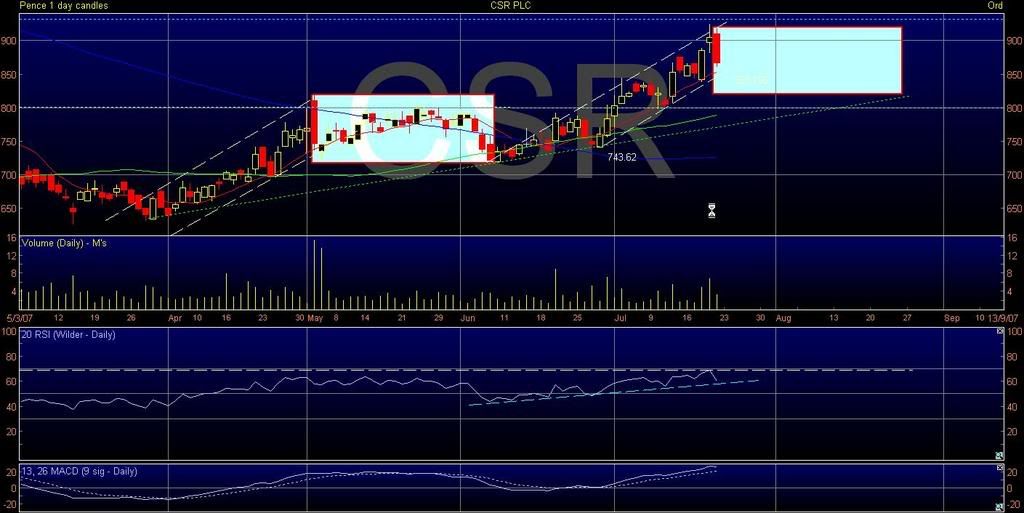
Also posted on the CSR thread (apologies for repitition, but the concept of identifying patterns that repeat themselves is an interesting one.
CSR - Will history repeat itself?
The basis of TA says it does, otherwise it wouldn't work.
CSR remains in its channel following the breakout from 800p but has run into stiff resistance at 910p - 920p, but where does it go next?
Fascinating stuff now; the rise in March and April has been exactly replicated by the latest rise, a move of 200p, the width of the channel and the gradient of the channel, even the time frame! What followed was a five week period of consolidation and an easing of the SP. I have replicated this period of consolidation (two rectangles) and superimposed on the chart. If history does repeat itself the SP will remain in this 'box' until late August where if finds support from the longer term trendline at 810p and then begins the next move up. We shall see.
In any event I'm now quite bearish on CSR in the short term; there is little room for any sizeable rise on the RSI; as can be seen, the uptrend support is converging on resistance and although it could happen, CSR just doesn't like to be above 70, so I would expect this RSI support to be broken in due course. MACD is also toppy and looks like it might be turning down. Confirmation of consolidation rather than a breakout through 900p will be confirmed if the uptrend channel support is broken, which is at 855p, so watch this level.
![<a href=]()
CSR - Will history repeat itself?
The basis of TA says it does, otherwise it wouldn't work.
CSR remains in its channel following the breakout from 800p but has run into stiff resistance at 910p - 920p, but where does it go next?
Fascinating stuff now; the rise in March and April has been exactly replicated by the latest rise, a move of 200p, the width of the channel and the gradient of the channel, even the time frame! What followed was a five week period of consolidation and an easing of the SP. I have replicated this period of consolidation (two rectangles) and superimposed on the chart. If history does repeat itself the SP will remain in this 'box' until late August where if finds support from the longer term trendline at 810p and then begins the next move up. We shall see.
In any event I'm now quite bearish on CSR in the short term; there is little room for any sizeable rise on the RSI; as can be seen, the uptrend support is converging on resistance and although it could happen, CSR just doesn't like to be above 70, so I would expect this RSI support to be broken in due course. MACD is also toppy and looks like it might be turning down. Confirmation of consolidation rather than a breakout through 900p will be confirmed if the uptrend channel support is broken, which is at 855p, so watch this level.
ptholden
- 20 Jul 2007 20:18
- 152 of 504
Wondering if EMG is going to fall back into the shallower channel at 571p or even fall as far as the 200MA at 540p, think my guess would be the shallower channel.
pth
![<a href=]()

pth
cynic
- 21 Jul 2007 08:48
- 153 of 504
monday morning is likely to be pretty bloody so the likes of DOO could tumble sharply ........ i know PT reckons 240/245 to be the bottom target, but if the market does not bounce quickly, then lower still could be the order of the day.
for myself, i am very glad indeed i took some hefty profits last week while i was away and i confess the turbulence of the current markets does give me cause for concern as, from memory, this sort of nonsense is often the prelude to rather more prolonged nastiness.
for myself, i am very glad indeed i took some hefty profits last week while i was away and i confess the turbulence of the current markets does give me cause for concern as, from memory, this sort of nonsense is often the prelude to rather more prolonged nastiness.
maggiebt4
- 22 Jul 2007 14:34
- 154 of 504
Hope you're right PTH about EMG as have just got in again. I don't know why but I think it's going to bounce robably just wishful thinking. Do see what you mean about the shallower channel
maggiebt4
- 22 Jul 2007 14:36
- 155 of 504
That's Probably not robably
ptholden
- 22 Jul 2007 21:49
- 156 of 504
Maggie I hope for your sake (=profits) it stays in this upper channel, but when taking the DOW fall on Friday into consideration (although there was a recovery) the FTSE and other Indices by association may well take a whack tomorrow. Like many I'm waiting for the 'correction' to take place and I am hesitant to be bullish on most stocks at the moment.
pth
PS And what's wrong with robably? :))
pth
PS And what's wrong with robably? :))
SEADOG
- 23 Jul 2007 10:19
- 157 of 504
pth
May I take you back to your original posts and ask your views on this.
A few years ago now I attended a few lectures given by the American guru Chris Manning. His use of RSI and EMA's was quite simple, using a 21 day RSI and 10 and 20 day EMA's he advised that when the RSI moved upward through 50 it was basically a buy, but in conjunction with the 10 day EMA moving above the 20 day EMA and staying above it, and when moving down through 50 not a buy but a sell. The moving averages tend to lag on the sell side, I found the best time to sell was when the RSI had peaked and was staring to retreat I found the first part of the strategy to be quite accurate. His MACD settings for this strategy were 5,35,5.
Look forward to your reply SD
cynic
- 23 Jul 2007 16:48
- 158 of 504
i took even more money off the table today (sold CSR at a good profit - 3rd time since start of year from memory).... "Why?" you may ask ....... because (1) the markets are churning wildly and (2) DOW is very close to a very strong resistance at 14400 ...... all this indicates to me that the markets may well run into a very sharp sell-off ...... i shall be delighted to be proved wrong and find that DOW rockets to 15000 and onwards and that FTSE ignores the imminent rate rise and the prospect of GB being elected with inevitable tax hikes following ..... any contrary views to mine?
ptholden
- 23 Jul 2007 17:50
- 159 of 504
Nope :)
ptholden
- 23 Jul 2007 19:38
- 160 of 504
SD (haven't seen you posting for a while, hope all is well).
I will be totally honest and say that I haven't (as yet) paid a huge amount of attention to MAa whether they be simple or expotential. I know many do and it is perhaps something I should study to a greater degree. As you have probably noticed I tend to rely on trends and the support or resistance they provide. In order to judge whether these lines of support or res will hold I am currently drawn towards both the RSI and MACD to help make a decision. I am acutely conscious that I need to expand my armoury, but as always it takes time to back test a variety of methods to see if they actually work. My first reaction to using 10 and 20EMAs is that there could be an awful lot of whipsaws generating false signals. Incorporating the RSI level of 50 as a determinging factor is an interesting one and I think merits further study. I would also suggest that this method would work well with trending stocks, but not with stocks trading sideways, again becuase of false signals. As always some indicators work well with trending stiocks and others do not.
Not sure if any of that helps SD, I have just scrolled through a few charts with 10 and 20 MAs and pretty much as I thought, false signals are much more prevalent with non trending stocks even when using the RSI as further confirmation of buy or sell, especially if there is a spike.
pth
| About MoneyAM | Ts and Cs | Privacy Policy | Investment Warning | Content Standards | Corporate Solutions | Advertise With Us | Site Map | © 2026 MoneyAM |
Register now for FREE
Share Prices,
Stock Quotes,
Charts, Bulletin Boards, Indices, Watchlists, Portfolio, Market News, Research
or see our Premium Services including Level 2, Terminal and much more.