
| Home | Log In | Register | Our Services | My Account | Contact | Help |
Bullshare

 - 16 Sep 2003 12:40


THE WITCHING HOUR ( Macbeth Act IV Scene I)
Double, double toil and trouble:
Fire, burn; and, cauldron, bubble
This Friday ( 19th September 2003) is Double Witching day here in the UK and it is the anniversary of one of the sharpest intraday moves ever recorded. On Friday 20th September 2002 the market moved an incredible 8% (309 points) in just 20 minutes. Many traders and private investors were spell bound and glued to their screens watching the market swing so violently in such a short period.
What is so surprising is that many people were not even aware that this particular volatility regularly occurs on Double and Triple witching days - the actual trading period within each Witching Day is known as the Witching hour but many wonder if it is not some dark and satanic ancient ritual. It actually refers to the period when equity index futures, equity index options and equity options are settled/expire. These are at prearranged times and dates throughout the year.
Triple witching days occur in the US only and refer to the market machinations brought on by the simultaneous expiration of all three derivatives at the same time. This happens four times a year, on the third Fridays of March, June, September, and December. To be precise, the phrase is Triple Witching Hour, and refers to the last hour of trading on these Fridays.
In the UK, Equity options expire on a Wednesday, so instead of Triple Witching we have Double Witching day which again is on the third Fridays of March, June, September, and December. On these days the FTSE 100 Future and the FTSE 100 Option both expire simultaneously. The FTSE 100 Future is a three month contract whereas the FTSE 100 Option is a monthly contract so it will expire every month of the year. On the quarter days when they both expire, the expiration of these vehicles can cause high volatility in the underlying equity market as arbitrageurs, hedge strategists and traders play madly with the expiring vehicle and the underlying securities.
The basis behind settlement of Futures contract is that the contract will be priced, at expiry, at a price equal to the cash or spot price in the Market (intrinsic price). For instance a FTSE September 2002 futures contract might be trading at a premium to the FTSE cash market on the day before expiry, but at the time of expiry they will be at the same price. Normally the Futures price will move to match the FTSE cash. So all those with long positions in a futures or options contract want the FTSE future to expire at a higher price and those with a short position want it expire lower lower. So let battle commence. The winner is the one who can drive the closing price in their favour.
To make things even more complicated it is not simply the end of day closing price that is used to calculate the final Futures and Options prices. In the UK it was realised some years ago that this would lead to manipulation in the market place so instead a sampling period of 20 minutes is created between 10.10am and 10.30am. Within this period, a sample is made of the FTSE 100 Index once every 15 seconds. Of the 81 measured values, the highest 12 and lowest 12 are discarded and the remaining 57 are averaged to calculate the settlement price.
On the basis, that on expiry the cash price of the FTSE 100 will be the same as the futures price, the players in this game, buy and sell stock in the cash market to make the FTSE 100 Index move in the direction of their trade. Knowing that the sampling period only lasts 20mins does make this particular time of day volatile. Its like a race, at 10.10am all the bulls start buying stocks and all the bears start selling. Normally this battle is slightly one-sided but not always a huge imbalance. The figures in Table1 show the average price movement (range)on each doublewitching day since 1999 and have also shown all the single witching days in 2002 just for info.
| Date | High | Low | Range | % Range |
| 20/06/2003 | 4169 | 4119 | 50 | 0.12 |
| 21/03/2003 | 3881 | 3782 | 99 | 2.61 |
| 20/12/2002 | 3893 | 3841 | 52 | 1.35 |
| 20/09/2002 | 4064 | 3755 | 309 | 8.23 |
| 16/08/2002 | 4382 | 4285 | 97 | 2.26 |
| 19/07/2002 | 4297 | 4098 | 199 | 4.86 |
| 21/06/2002 | 4641 | 4506 | 135 | 3.00 |
| 17/05/2002 | 5282 | 5211 | 71 | 1.36 |
| 19/04/2002 | 5248 | 5210 | 38 | 0.73 |
| 15/03/2002 | 5297 | 5243 | 54 | 1.03 |
| 15/02/2002 | 5235 | 5174 | 61 | 1.18 |
| 18/01/2002 | 5150 | 5103 | 47 | 0.92 |
| 21/12/2001 | 5182 | 5044 | 138 | 2.74 |
| 21/09/2001 | 4556 | 4219 | 337 | 7.99 |
| 15/06/2001 | 5756 | 5657 | 99 | 1.75 |
| 16/03/2001 | 5729 | 5556 | 173 | 3.11 |
| 15/12/2000 | 6269 | 6175 | 94 | 1.52 |
| 15/09/2000 | 6559 | 6417 | 142 | 2.21 |
| 16/06/2000 | 6566 | 6474 | 92 | 1.42 |
| 17/03/2000 | 6712 | 6505 | 207 | 3.18 |
| 17/12/1999 | 6757 | 6645 | 112 | 1.69 |
| 17/09/1999 | 6063 | 6011 | 52 | 0.87 |
| 18/06/1999 | 6596 | 6493 | 103 | 1.59 |
| 19/03/1999 | 6162 | 6111 | 51 | 0.83 |
Notice how volatile September is. This is for a number of reasons; historically it was the month when farmers had no money to spend as it had been spent after harvest in August and also manufacturers tended to have low order books. Nowadays what influences the markets is the quarterly reporting season in the US. In the US, September is called Black September for a reason, it is the start of the Fall in the US and history shows us that it is the signal for a fall in the markets
In the UK all the FTSE 100 companies are traded through an electronic order book (SETS), which normally has trading curbs in place if any stock moves 5% or more in any direction. If a curb should be triggered, trading is suspended while an auction is called. However on double witching days the exchanges may suspend this curb if it feels or is informed that there will be greater than normal volatility.
A few days before 20th September 2002 it became clear to the Stock Exchange that there was a large volume of stock to be put through in this period. It is understood that a US bank based in the City had taken out a large short position in the cash equity market (sold shares short). To hedge (re-insure) their short position they had placed an opposite long Futures trade on the FTSE 100 Future. It is understood that the counterparty to this trade was a European bank who hedged their own position by buying stock long in the cash equity market.
Normally the US bank would have continued it position in the cash market and simply rolled over its futures position onto the next contract month. Unusually it decided that it wanted to close out its short position in the cash market. It did not now need its hedge on the FTSE future, and wanted to close it out at an advantageous price. The net effect of this was that the US bank had to buy back its stocks in the cash equity market and then close its long futures position with the counterparty. On closing the futures long position, the European bank that was counterparty would then have to sell the stock it had bought as its hedge.
So lets now look at the 20th September 2002 in detail
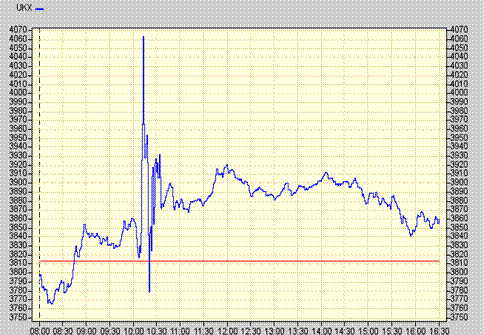
FTSE 100
Open 3813
High 4064< p> Low 3755
Close 3860
High-low range 8%
The Dow closed the previous night down 35 points, although at one time it had been trading 156 points lower. On opening, the FTSE futures were calling the market lower in the UK, so the FTSE 100 Index cash did actually fall on opening. At about 8.15am in kicked some program (electronic) buy orders and the market from here started to rise to the start of sampling (10.10am). The FTSE 100 cash at this time was now sitting just above the previous nights close.
Sampling period begins in earnest and it is apparent that the US bank has not been able to get its buy orders filled before the sampling period, so wades heavily into the market to buy stock. The effect of this was that the order book (SETS limit orders) thinned as the bank acquired stocks but also as savvy traders (werewolves) removed their buy and sell orders. The werewolves knowing that trading curbs had been removed knew that the brakes were off both on the upside and downside on all FTSE 100 constituents. Many traders now moved their limit orders to a price over 5% away from the normal price in the hope that the buyers in the market would be forced to buy through the SETS system and would program buy anything to get their trades filled before sampling finished. And of course this is just what happened. Millions made and millions lost.
The effect of all this activity was a period of pandemonium, with the Stock Exchange recording its highest ever volume of shares (1billion traded in this short period) and caused its computers to wobble. Looking at Chart 2 you can see the meteoric rise as huge buy programs are triggered and then the massive fall as these were overtaken by what is assumed to be the counterparties sell orders.
Looking at the individual share charts and tables for some of the most volatile stocks on the day (Shell, 3i, Johnson Matthey and GlaxoSmithKline ) you can see the extreme movements kick in as the sampling period starts. All the punters watching their screens at home, looked on in shock as this huge wave of buying followed by the wave of selling hit their screens. Many who had large open short positions panicked and tried to buy into the market, but a combination of slow prices and brokers systems/phone lines being swamped meant that the great majority just had to sit back and watch.
Intraday Movement - 20 Sept 2002 Kingfisher - 13.4% 3i - 97.2% Daily Mail - 32.0% Invensys - 47.1% Amersham - 9.3% Alliance and Leicester - 13.7% BHP - 9.4% Old Mutual - 54.0% Hays - 58.8% Cable & Wireless - 12.6% Sage - 72.1% Barclays - 41.8% Anglo American - 26.4% Shell - 34.5% Rentokil Initial - 33.9% Sainsbury's - 20.2% GKN - 49.7% BOC - 24.8% Assoc British Foods - 10.4% Safeway - 16.7%
The werewolves in the meanwhile were licking their lips as their limit orders were already placed in the SETS book and more importantly were being filled.
Assuming history repeats itself, the above table actually is a good guide for the stocks to watch. Obviously there are many more stocks outside the FTSE 100 that moved in a much larger range but this is a good starting point and is one that correlates well with the movement of the most liquid stocks on 20/09/02 as well.
So what next?
To really benefit you will need to have access to a broker that will allow you to place limit orders in the market. If you have an account with either an on-line or off-line limit order broking facility you will then be able to place orders outside the current 'near' buy/sell orders on that day.
You will need to check with you broker on the morning of 19th September to see if the trading curbs are in place or if they have been lifted - if your broker says dont know, query it further. As a trader, it is vital you have a relationship with a broker who does know these things!!! If trading curbs are in place then any movement up to 5% could potentially be filled if the day becomes volatile.
If you find trading kerbs are removed, question why. Has the market been informed of large positions that need to be closed by individual parties or for some other reason? Again your broker or perhaps a trader you know will be in the know as to how or what is likely to be the buying and selling pattern during the morning.
Lets take Shell as an example: on the 20/09/02 it moved in a range of 34.5%. Lets say on Friday 19th Sepetember opening Shell is trading at 399/402 with an order book as low as 325 and as high as 690. If the market generally is trending down over previous sessions you might want to put a sell order (short) in at 422 conversely if the market is in an up trend you might want to put a buy order in down at 378. As these are on the extremes of the curbs, should you get filled it will be because of large market orders that need to be executed. If the curbs are removed you might consider putting orders further out to catch any extreme movements. If you get filled within the curb extreme or on the outside of the curb if the market allows, you have every chance of closing the position out.
If the market does swing violently be careful of stops left with brokers, spread betters and CFD providers being taken out during this 20 minute period.
On the day who knows what will happen, it could be a damp squid, but it is better to be forewarned.
**********************************************************************************************************************
Mike Boydell is Managing Director of MoneyAM and also a director of Global Markets Training Ltd and Traderpc Ltd. He has been an active private trader in the UK for 13 years .
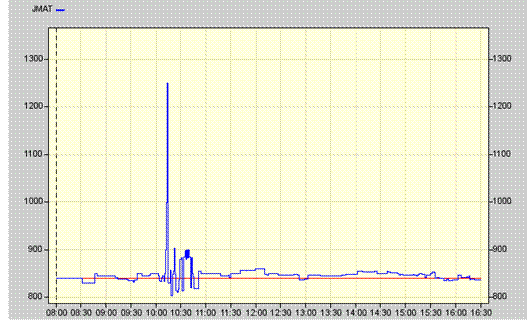
Johnson Matthey
Open 830
High 1350
Low 804
Close 836
High-low range 67%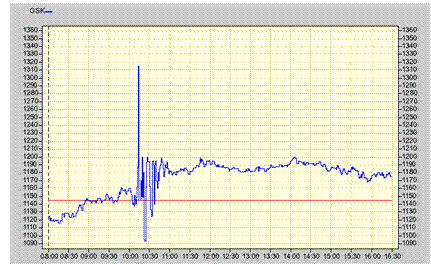
GlaxoSmithKline
Open 1125
High 1358
Low 1092
Close 1173
High-low range 24%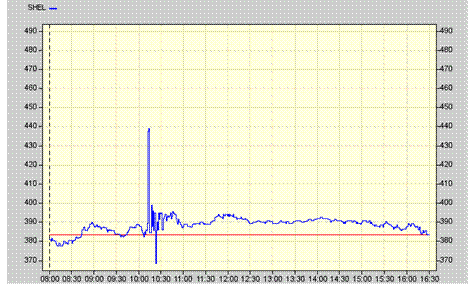
Shell
Open 381
High 490
Low 368.5
Close 382.5
High-low range 33%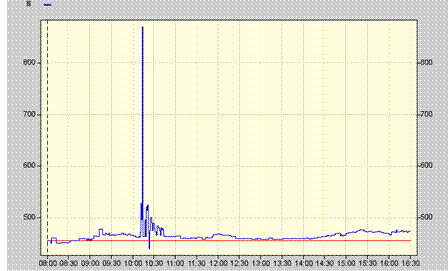
3i Open 451 High 871 Low 440.5 Close 474.5 High-low range 97%
BrianTrayda
- 16 Sep 2003 12:45
- 2 of 193
Good read for the end of day though.
Bullshare
- 16 Sep 2003 12:50
- 3 of 193
M
Iain
 - 16 Sep 2003 13:01
- 4 of 193
- 16 Sep 2003 13:01
- 4 of 193

BrianTrayda
- 16 Sep 2003 13:07
- 5 of 193
Bullshare
- 16 Sep 2003 13:19
- 6 of 193
ThePlayboy
- 16 Sep 2003 13:21
- 7 of 193
hilary
- 16 Sep 2003 14:06
- 8 of 193
;-)
Big Al
- 16 Sep 2003 14:18
- 9 of 193
;-)))
BrianTrayda
- 16 Sep 2003 14:29
- 10 of 193
Bet some magic is going to happen around here. ;)
BrianTrayda
- 16 Sep 2003 14:30
- 11 of 193
Piptrader
- 16 Sep 2003 14:41
- 12 of 193
I measure volatility (with FTSE futures) by a 20-day ema of true range, and this measure is high on the days before the 3 highest-range days in Mike's chart above. Conversely, the lowest-range days generally coincide with low volatility, eg first 5 months of 2002.
On that basis, this coming expiry should be a damp squib, because, by my measure of volatility, the market is the quietest it has been since May 1997. No guarantees, of course :-)
Mr Euro
- 16 Sep 2003 20:52
- 13 of 193
dominic - 17 Sep 2003 11:38 - 14 of 193
Kayak
- 17 Sep 2003 12:12
- 15 of 193
Piptrader
- 17 Sep 2003 12:51
- 16 of 193
Edit: sorry, I think you do too!
DocProc
- 17 Sep 2003 20:59
- 17 of 193
It sick squid'm Adam.
Is it damp?
Gnome Adam.
DocProc
- 17 Sep 2003 21:07
- 18 of 193
I guess we'll soon see. Nerves seem quite steady to me so I'm for the damp squib thing.
DocProc
- 17 Sep 2003 21:13
- 19 of 193
She was Category 5 but it seems she's only Category 2 now.
Paulismyname
- 17 Sep 2003 21:59
- 20 of 193
I never have participated in witching before and have observed only, however am I correct in the assumption that if you think a share is going to be pulled down you would set up a fill long, down from the price, or if pushed up a short up from the price.
Also if this is correct what would be your preference in setting potential fills, long or short?
Time Traveller
- 18 Sep 2003 17:55
- 21 of 193

| About MoneyAM | Ts and Cs | Privacy Policy | Investment Warning | Content Standards | Corporate Solutions | Advertise With Us | Site Map | © 2026 MoneyAM |