|
NEW RESEARCH TOOLS FROM MONEYAM
MoneyAM are pleased to announce the launch of completely new and comprehensive stock research tools on its site.
 Stock Screeners - a new set of tools, to help you cut through the chaff of the market and help you to come up with a list of stocks that meet individual criteria. If you have definite parameters that you use for share selection, the Stock Screener can quickly analyse the underlying fundamentals of all the companies in the market and produce a shortlist of stocks for further research. This helps speed up the process no end.
As with many things financial, what sounds complicated can be illustrated more easily by an example. Let's assume we want to limit our research to finding companies in the electronics equipment sector, because our opinion may be that the worst is behind this industry and it is set to recover. We can choose to restrict our search to just this sector using simple drop-down menus (multiple sectors or the whole market could be searched if desired). Stock Screeners - a new set of tools, to help you cut through the chaff of the market and help you to come up with a list of stocks that meet individual criteria. If you have definite parameters that you use for share selection, the Stock Screener can quickly analyse the underlying fundamentals of all the companies in the market and produce a shortlist of stocks for further research. This helps speed up the process no end.
As with many things financial, what sounds complicated can be illustrated more easily by an example. Let's assume we want to limit our research to finding companies in the electronics equipment sector, because our opinion may be that the worst is behind this industry and it is set to recover. We can choose to restrict our search to just this sector using simple drop-down menus (multiple sectors or the whole market could be searched if desired).
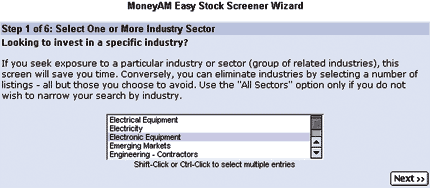 The website now takes you through a number of screens where other criteria can be specified. For this example, we have chosen a market capitalisation of up to 50 million and a maximum price/earnings ratio of 40. The website analyses this data and filters out any companies that do not meet the criteria, to come up with the following list of four shares.
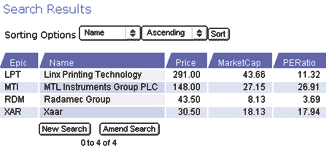 The example shown is a very simple one, the data can be analysed in much more detail using the advanced stock screener. This allows users to refine searches based on a host of other parameters: net asset value, return on equity, turnover, retained profit, etc. This is an effective way of zeroing in on your real interests in the market, allowing further in-depth research to be carried out to come to an investment decision.
 Top Performing Fund Managers- This is available in one and three-year formats and tracks the performance of the individual managers not just the funds they look after. Individual managers are listed according to their average percentile rankings the lower the better. Where they are in charge of a number of different funds, all of these are shown. Because the success or failure of funds can depend to a great extent on the methodology of the man or woman at the top, it is a very effective way of keeping an eye on who are the current star names and tracking them if they move on to new investment companies. Top Performing Fund Managers- This is available in one and three-year formats and tracks the performance of the individual managers not just the funds they look after. Individual managers are listed according to their average percentile rankings the lower the better. Where they are in charge of a number of different funds, all of these are shown. Because the success or failure of funds can depend to a great extent on the methodology of the man or woman at the top, it is a very effective way of keeping an eye on who are the current star names and tracking them if they move on to new investment companies.
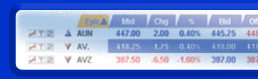
 Historic Quotes - If you keep your own price data or just have a query on what was the open, high, low or closing price for a particular share on a specific date or even over a range of dates, this tool will do all the work for you. By simply entering in the epic code for the share and the date range or specific date required, the website will provide you with all of the price and volume data needed. Historic Quotes - If you keep your own price data or just have a query on what was the open, high, low or closing price for a particular share on a specific date or even over a range of dates, this tool will do all the work for you. By simply entering in the epic code for the share and the date range or specific date required, the website will provide you with all of the price and volume data needed.
 Customisable Market Scan -The MoneyAM website already has biggest risers and fallers for the day; new highs and lows for the year and constant gainers and losers, but now there is a customisable market scan. This lets you set up your own lists to represent only the information that is important to your style of trading. For example, percentage gainers and losers can be restricted to specific sectors of the market. You may not be too bothered that an AIM-quoted tiddler has shot up 50% from 1p to 1.5p, so the big movers can be restricted to just FTSE 100 shares, FTSE 250, a particular sector, or indeed any combination of these. Once again, this saves time in having to wade through a lot of information that may not be relevant to an individual traders approach. Customisable Market Scan -The MoneyAM website already has biggest risers and fallers for the day; new highs and lows for the year and constant gainers and losers, but now there is a customisable market scan. This lets you set up your own lists to represent only the information that is important to your style of trading. For example, percentage gainers and losers can be restricted to specific sectors of the market. You may not be too bothered that an AIM-quoted tiddler has shot up 50% from 1p to 1.5p, so the big movers can be restricted to just FTSE 100 shares, FTSE 250, a particular sector, or indeed any combination of these. Once again, this saves time in having to wade through a lot of information that may not be relevant to an individual traders approach.
Intra-day searches can now be applied to volume - The MoneyAM website lets you track any unusual trading activity, again on a sector or index basis, by analysing noticeable changes in volume compared to the norm. Once more this can be customised in a variety of ways for example by flagging particularly high volume for the day compared with a normal day or the weekly average. Using this data and the biggest movers list together can instantly help alert traders to where the action currently is in the market.
 Heatmaps - A new tool known as Heatmaps lets traders and investors look at market data in a unique format. Taking the FTSE 100 list as an example, the shares are sorted by percentage price move on the day and then colour-coded depending on how extreme that movement has been. Dark blue is a large positive movement relative to the rest of the list and dark red logically shows a big move down. At a glance, you can gauge the sentiment of the market for the day so far and immediately identify the fast-moving stocks in either direction. Heatmaps - A new tool known as Heatmaps lets traders and investors look at market data in a unique format. Taking the FTSE 100 list as an example, the shares are sorted by percentage price move on the day and then colour-coded depending on how extreme that movement has been. Dark blue is a large positive movement relative to the rest of the list and dark red logically shows a big move down. At a glance, you can gauge the sentiment of the market for the day so far and immediately identify the fast-moving stocks in either direction. 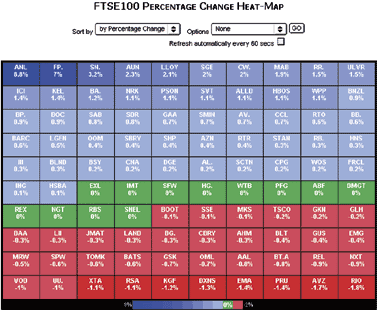 Once again, all this information can be sorted depending on your specific requirements. For example, if you are not too bothered about the percentage change, but wanted to see which industry groups are making up the FTSE 100 index, you can get the heatmap to re-order the list by sector. Taking the sector approach one step further, you could choose to view a heatmap of the whole market, showing which sectors are the biggest gainers and losers for the day. Once more, all these different views can be customised by the individual user to reflect the relevant data and the heatmap will also automatically update if required, allowing an ongoing view of how the market is developing throughout the day. It only takes a matter of minutes to become familiar with using these tools and they really do help to make the day-to-day spadework of investing and trading easier. Try them out by selecting the research tab on the MoneyAM website.
TAKE A FREE TEST DRIVE OF OUR NEW RESEARCH TOOLS
The new MoneyAm research tools are unmatched by any other UK website. They are only available on our Active and Level2 subscription levels (from just 10 per month).
Our easily mastered research tools will save you time and make you money. To try them out for free for the next seven days, log on now to www.moneyam.com/promo and type in the code newresearch. After a week of using our heatmaps, screeners and league tables, you'll wonder how you ever managed without them.
Please note that this is a genuine no-obligation Free Trial offer. You will not be asked to give credit card information when you register.
Regards,
Mike Boydell
Managing Director
PS If you are already on a MoneyAM promo you will automatically gain access to the new tools.
|


 - 05 Aug 2003 15:33