
| Home | Log In | Register | Our Services | My Account | Contact | Help |
You are NOT currently logged in
Technical Analysis (TA)
ptholden

 - 09 Jul 2007 23:14


I often find all manner of reference to Technical Analysis whilst reading threads, questioning certain elements, asking for advice on indicators and also requesting advice on a stock and whether it's a good time to buy, sell, hold or remain indifferent. I am the first to admit that my own TA is still in its infancy, but I do spend time on expanding my knowledge (hopefully in the right direction!).
Rather than having to ask a TA question on a particular thread, perhaps this thread could be used as a forum for TA queries and become a knowledge base. Just a thought, if there is little or no interest, the thread will sink without trace and that will be the end of that. I will personally add a few snippets to help those with less knowledge (if that's possible) to keep things rolling. There is a danger that the thread will receive countless requests for opinions on a variety of stocks and there is only so much I can do alone, therefore I would more than welcome input from other posters, no matter how rudimentary they believe their own knowledge to be, hopefully some real experts will take the time to contribute.
Rather than having to ask a TA question on a particular thread, perhaps this thread could be used as a forum for TA queries and become a knowledge base. Just a thought, if there is little or no interest, the thread will sink without trace and that will be the end of that. I will personally add a few snippets to help those with less knowledge (if that's possible) to keep things rolling. There is a danger that the thread will receive countless requests for opinions on a variety of stocks and there is only so much I can do alone, therefore I would more than welcome input from other posters, no matter how rudimentary they believe their own knowledge to be, hopefully some real experts will take the time to contribute.
Socrates
- 16 Jul 2007 11:05
- 116 of 504
Personally, I'm quite partial to a Bollinger Band or two.
ptholden
- 16 Jul 2007 20:50
- 117 of 504
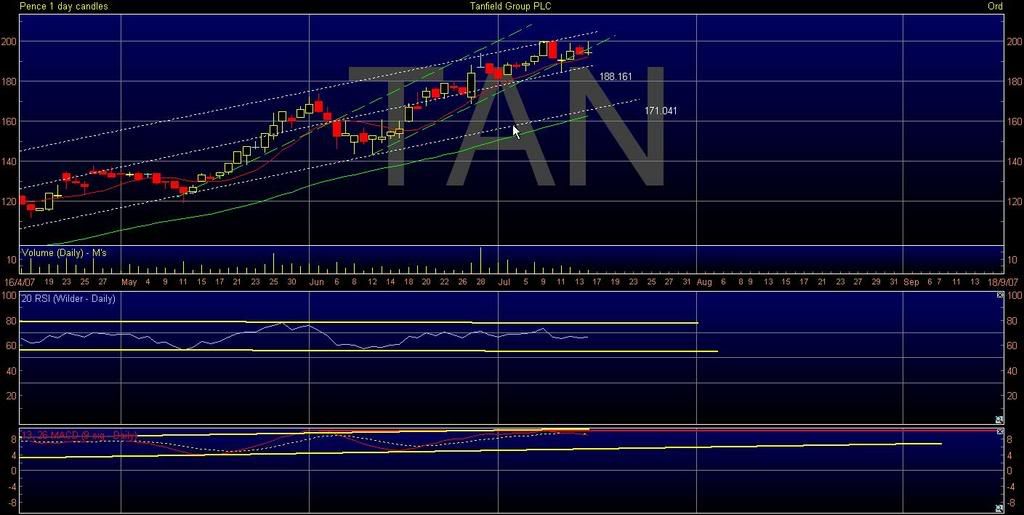
Time for some evening updates, starting with TAN.
Once again had a go at the elusive 200p and once again fell back. The SP has nearly fallen out of the bottom of the steeper channel, but perhaps a bit close to call. If there is a further dip rising support is now at 188p, so not much to be gained from trading in and out unless that particular level fails in which case I would keep a close eye on 180p and then 170p. RSI remains in its channel, the only indication of downward pressure would seem to be the MACD continuing its slow trundle downwards.
pth
![<a href=]()
Once again had a go at the elusive 200p and once again fell back. The SP has nearly fallen out of the bottom of the steeper channel, but perhaps a bit close to call. If there is a further dip rising support is now at 188p, so not much to be gained from trading in and out unless that particular level fails in which case I would keep a close eye on 180p and then 170p. RSI remains in its channel, the only indication of downward pressure would seem to be the MACD continuing its slow trundle downwards.
pth
ptholden
- 16 Jul 2007 21:07
- 118 of 504
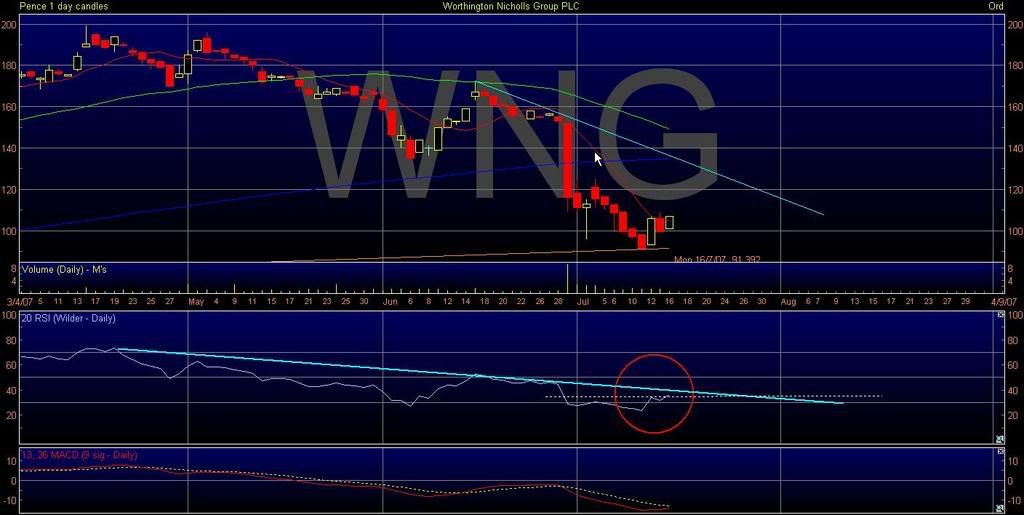
I mentioned on the WNG thread earlier that the RSI had posted a confirmed buy signal due to a failure swing (if you wnt an explanation go back to the beginning of the thread. Essentially the RSI made a higher low today. Certainly anyone wanting to get in should do so with a certain amount of caution and I would set a stop loss in the region of 90p. Personally I would also like to see the RSI break through the downtrend resistance. Keep an eye on the chart, the downtrend may cause a few stutters if it does continue to recover and there are more downtrend lines to break through after that.
pth
![<a href=]()
pth
ptholden
- 16 Jul 2007 21:24
- 119 of 504
My original analysis of SOLA predicted the SP sliding along the middle downtrend line and intitally this is what happened. Friday gave me pause for thought as it appeared to have broken through rising resistance. However, today has seen the SP dip below this line once more, although not in a conclusive fashion. I was curious as to why the SP bounced at 510p and looking back it's pretty obvious, I should have drawn this SP support line from the outset (der). MACD conitunes to turn up ansd the RSI is now sitting on what was a res line but now may become support. For what it's worth the SP is now sitting on the 50MA which may provide additional support. I wouldn't go long or short on this chart today, but as a holder I would wait for further direction before making a decision. Not much help I know, but it's not always clearcut :S
pth
![<a href=]()

pth
ptholden
- 16 Jul 2007 21:38
- 120 of 504
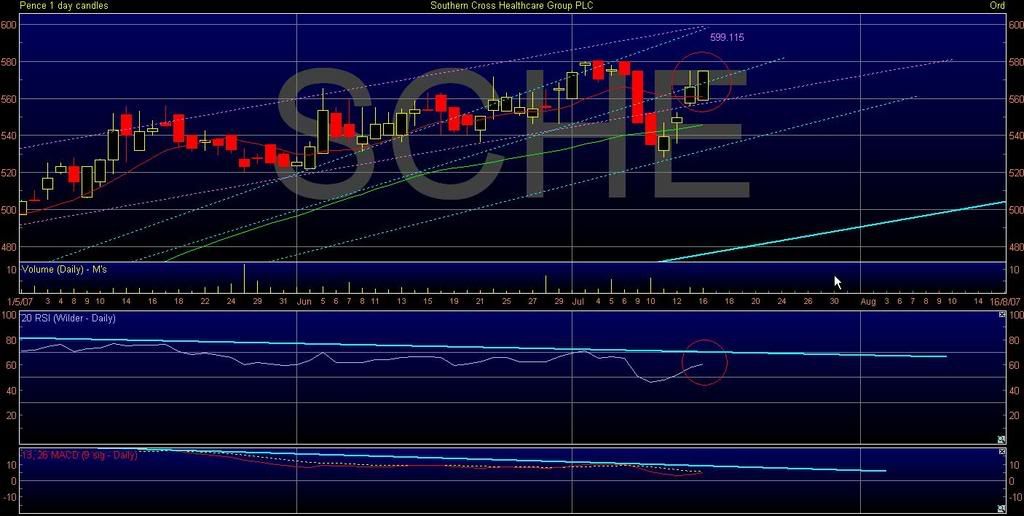
I posted last ime around that I had changed my view on SCHE; I still believe it's a short waiting to happen, but from what level? Still room on the MACD and RSI for a further rise and now it seems to have found a footing above a resistance line (now support) and back in its channel (just above the lower trend line) it may well have a go at 600p. This might be the level from which to short where it meets the upper resistance of the channel, a seperate rising resistance line and the physcological 600p barrier.
pth
![<a href=]()
pth
ptholden
- 16 Jul 2007 21:44
- 121 of 504
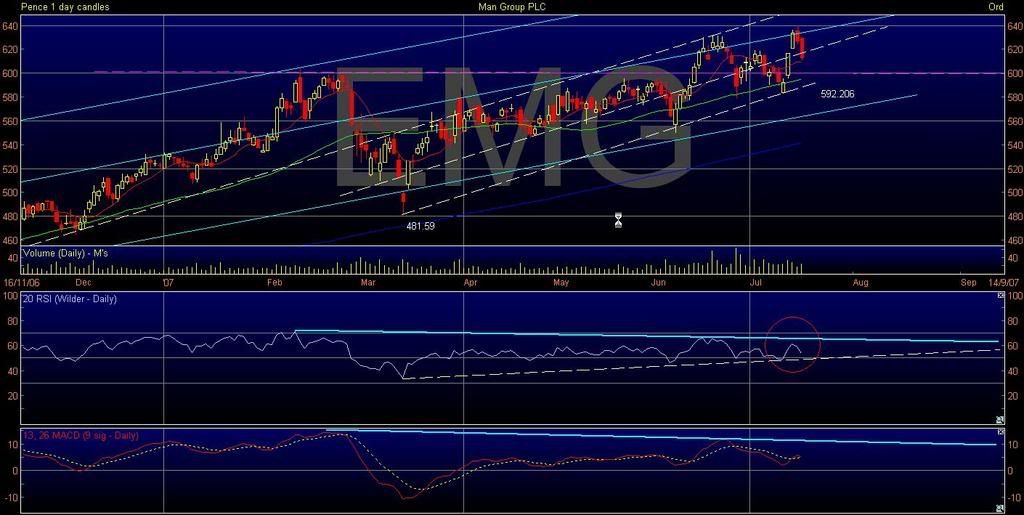
Maggie's I believe - EMG
640p proved too much of an obstacle today, coinciding with a bounce off RSI res, so not unexpected. I think I have spotted a different channel (white dashed lines)to the one previously drawn. This would appear to suggest that any downside is limited to that previously thought, so if there is a continued fall, 600p may well offer some support, rather than 575p.
pth
![<a href=]()

640p proved too much of an obstacle today, coinciding with a bounce off RSI res, so not unexpected. I think I have spotted a different channel (white dashed lines)to the one previously drawn. This would appear to suggest that any downside is limited to that previously thought, so if there is a continued fall, 600p may well offer some support, rather than 575p.
pth
ptholden
- 16 Jul 2007 21:52
- 122 of 504
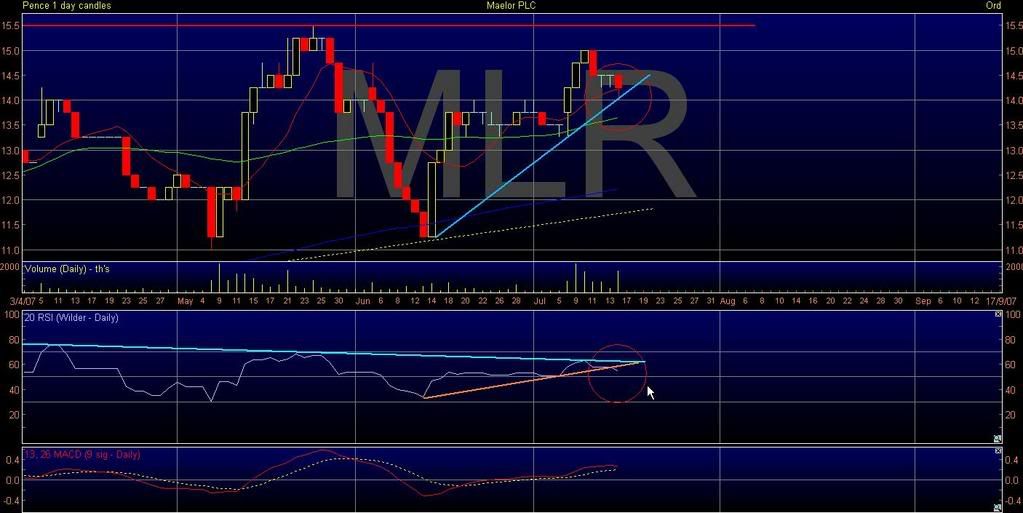
MLR bounced off its rather steep trendline intraday, but there is certainly weakness as demonstrated by a break to the downside through the RSI support. Still expecting a fall to 12p during the weeks ahead.
![<a href=]()
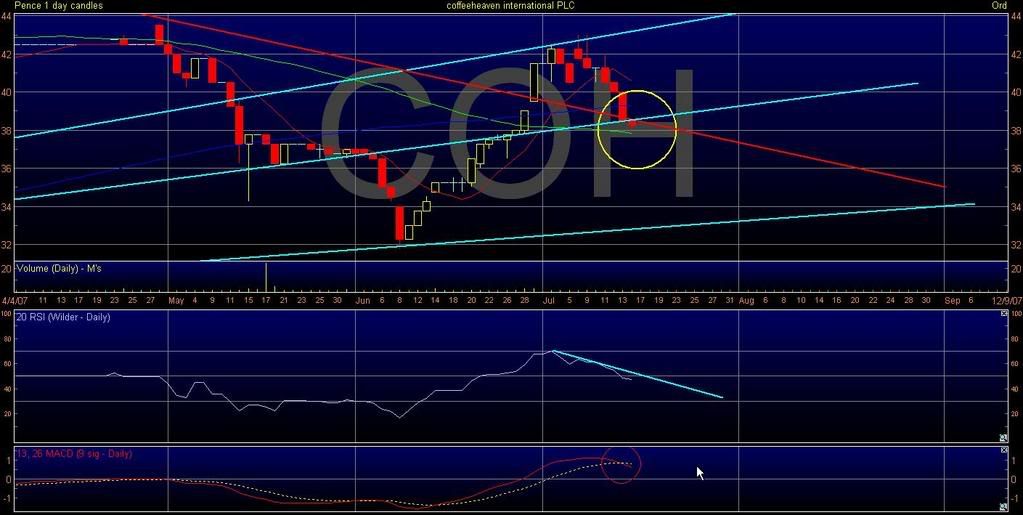
COH chart is not pretty, fell through two support levels today, MACD has crossed down and I'm afraid somewhere in the region of 34p looks on the cards, unless something happens rather quickly to give the SP a much needed lift.
![<a href=]()
COH chart is not pretty, fell through two support levels today, MACD has crossed down and I'm afraid somewhere in the region of 34p looks on the cards, unless something happens rather quickly to give the SP a much needed lift.
David10B
- 16 Jul 2007 21:58
- 123 of 504
Thank you, exactly what I said here earlier today on both.
maggiebt4
- 16 Jul 2007 23:54
- 124 of 504
Thanks PTH I continue to watch and learn.
fliper
- 17 Jul 2007 08:34
- 125 of 504
Thanks PTH , can you show rgm and let me know how this looks .
maddoctor - 17 Jul 2007 11:54 - 126 of 504
one of you swing failures on the ftse100 but would not read too much into it cos we,re chained to the DOW at the mo
ptholden
- 17 Jul 2007 11:58
- 127 of 504
md
Haven't looked but works best when below 30 above 70. I wouldn't rely on it at all anywhere between.
pth
Haven't looked but works best when below 30 above 70. I wouldn't rely on it at all anywhere between.
pth
maddoctor - 17 Jul 2007 12:08 - 128 of 504
you are right but you can draw a nice straight line acroos the tops of the rsi , if it was not a big results week in the US might have taken a short on the ftse
maggiebt4
- 17 Jul 2007 17:33
- 129 of 504
Does it indicate anything if the RSI is trending down but the sp is trending up? Please! Think I have read something about that on the thread but can't find now so forgive me if you have to repeat will read carefully this time. EMG down another 14 today am watching for support to kick in so far you (and me too )'ve got it right :o))))
ptholden
- 17 Jul 2007 18:15
- 130 of 504
Maggie, any indicator that is trending in one direction whilst the SP is heading in the other is termed divergence. You can have Bullish and Bearish; for instance if you can draw a downtrend across the top of the RSI (like EMG) whilst the SP is heading North you have bearish divergence, a possible sign of weakness and that at some point there may be a correction to any previous rise. In EMG's case it wouldn't be that pronounced were it not for the fact it did seem to get ahead of itself in February. Actually, you can also draw an uptrend on the RSI for EMG (I'll do that later), which would suggest that the SP is in consolidation mode of a sorts.
I take it you took profits further up, so well done you :))
Must say this looks like a cracking trading share :))
pth
Edit: I have edited this post in view of the following updated chart.
I take it you took profits further up, so well done you :))
Must say this looks like a cracking trading share :))
pth
Edit: I have edited this post in view of the following updated chart.
ptholden
- 17 Jul 2007 18:44
- 131 of 504
Hi Maggie, just updated the chart; I have drawn in the SP support level at 600p, which you can see acted as pretty robust res in Feb, May & Jun before the breakthrough. Now this res should have become pretty good support but has failed on two occasions since. Theoretically it should have, but didn't so I would treat this level with some suspicion. If the SP is in this new channel (white dashed lines) then immediate support in trend world is at 592p ish. It may be that there won't be too much movement tomorrow or the day after in which case this support line, the 50MA and 600p will merge offering a much better platform for the next leg up. I have also added a RSI uptend support line, keep an eye on this as any fall through here will indicate further weakness and a possible return to the shallower channel with associated lower rising support. If everything holds think I would be looking to go long Thursday or Friday from 595p - 600p, could all have changed by then though :)
pth
![<a href=]()
pth
maggiebt4
- 17 Jul 2007 23:46
- 132 of 504
Thanks again PTH am really getting hooked on this but have a lot to learn. I did take profits with EMG which are helping to cushion my losses - too long to list - The divergence question referred to UKC which I have been watching but not trading I think it could be a good trading share
maggiebt4
- 18 Jul 2007 00:05
- 133 of 504
Sorry question didn't refer to UKC at all and I can't remember now which share it was maybe I should just crawl into my box either that or give up atching sooooooooooo many shares!
garfeebloke - 18 Jul 2007 10:04 - 134 of 504
PT I hope you are trading some of these now.....as we discussed before.........you don't seem to be far wrong. All the best
Garfee
Garfee
garfeebloke - 18 Jul 2007 10:54 - 135 of 504
PT, I've now saved a TIFF a GIF and a BMP file to my desktop and I can't get either one to reproduce here. What I'm trying to do is demonstrate the Tate & Lyle chart and ask your opinion. I think I've identified two significant trend lines, one with four confirming touches in 2004 and the more recent, significant?? one with a whole bunch of touches in March this year and confirming touches in Feb/Mar 2003. Looks to me like we've strong support at 560 ish with an upside target of 800ish once the 660 resistance is out of the way.............wish I could do charts. What do you think Oh Mighty one??
| About MoneyAM | Ts and Cs | Privacy Policy | Investment Warning | Content Standards | Corporate Solutions | Advertise With Us | Site Map | © 2026 MoneyAM |
Register now for FREE
Share Prices,
Stock Quotes,
Charts, Bulletin Boards, Indices, Watchlists, Portfolio, Market News, Research
or see our Premium Services including Level 2, Terminal and much more.