
| Home | Log In | Register | Our Services | My Account | Contact | Help |
You are NOT currently logged in
Davai - 18 Apr 2012 11:13


Thread designed to record set-ups and targets on index and FX pairs.
'A market is only your enemy until you understand it, then it becomes your best friend.'
Any questions, please feel free to ask.
From time to time i may openly state an opinion regarding direction of a set-up and wish to add that in no way am i recommending a trade. I am sometimes only in trades for a matter of minutes and can't always update as to entry/exits taken.
As always, markets are dangerous places to be and must be respected as such. Always use stop losses and never over-leverage; 3% of your pot as a maximum per trade. As always, YOU are responsible for your own trades! Happy pip hunting!
Click HERE to visit me at FXtechnicals.net
Davai - 06 Oct 2012 11:36 - 116 of 423
Ok, lets try to show workings behind a great trade yesterday...
Firstly, here is a chart of the hourly Audi;

I could have shown a 4hr which would identify this as a complex corrective phase and the likelihood of us being in a 5 wave move ('C' wave).
We are nearing the end of this move (as per the chart). Here we can clearly label the move as the market is being very kind right now and literally signposting each move.
Once we have finished the powerful 3rd wave, we can look for an ABC 4th. In this instance wave 2 was short and simple, thus we can expect alternation and a longer more complex wave 4. I have attempted to label that in the chart below, but first lets observe a couple of things. Draw a line connecting the end of waves 2&4, then drag a parellel line across to the end of wave 1, (blue lines), this will give a likely target for the end of the whole 5 waves... In this instance i believe we may get a second touch as its unlikely that we have finished the move and have just encountered our 4th (subwave) of the 5th just before the close...
Now to look in more detail at the 4th wave and the break out into the powerful 3rd (subwave) of the 5th wave;

Here we can follow the structure of the 4th wave in a 5-3-5 ABC formation. Its even possible to clearly label the subwaves within the 5th wave of 'C'. This set us up for downside early on yesterday, (subwave 1 of the 5th), but after a&b (of subwave 2) and with the need for a corrective 'c' to come around the time of 'Non Farms', (I also had the Euro pegged to go up at the same time), so i wasn't expecting bad news. Surprise surprise, up we go. The Audi made a steep retrace, but couldn't breach the start of point 1 of course (stop placement). Once completed it was time to start subwave 'iii' (of the 5th). At this stage we don't know what shape it will take as 5th's can develop in many fashions, but once it started dropping sharply it was obvious it was impulsive, we would get a clean break of the flagline and likely drop in a strong move. Shorting the rise of the 'C' wave (of subwave 2) with stop above start of point 1 is a great trade. Equally shorting the break of the flagline, (bigger points risk, but more evidence)
chuckles - 06 Oct 2012 23:59 - 117 of 423
Going back to June Davai it seems like all of your predictions were, err, wrong? No nasty sell off, entirely the opposite in fact.
Davai - 08 Oct 2012 13:04 - 118 of 423
True.... that's the purpose of the thread though to be fair... put it out there to be able to look back and learn from. To be fair, i generally only ever trade on small timescales and thus am only really interested in short term movements...
Apologies, I will try to get it right next time! )
Apologies, I will try to get it right next time! )
chuckles - 08 Oct 2012 20:17 - 119 of 423
All fair comments Davai, my post was more aimed at the inaccuracies of Elliot Wave Theory, give 10 practitioners the same chart and all 10 would have different outcomes :-)
Davai - 11 Oct 2012 11:48 - 120 of 423
Not going to disagree with any of that. Now... just recording some thoughts here;
They are that we have just completed a 5wave down and are now in an ABC retrace. Of that we are printing abc (of 'A'). System target is 12904, but obvious target would be 12920 (the 38.2% fib retracement level), before we start an abc 'B' back down...
I am labeling this as an expanding wedge. I brought my stop up to BE too soon (after system entry) and got stopped out to the exact pip on the downleg of 'D', this was exactly entry point, the market knows this and thus why it did a second retest of this point. Observation is to bring stop up to a pip below point 'B', thus reducing risk by two thirds, but staying clear of the probability of a stop out. If stopped then the entire set-up and thinking is invalid anyway, with risk at just one third of original entry, i should have been able to live with that.... I recognised the pattern merely 30 seconds after stop out, but PA had already risen and gone away from that level.... the trade had gone... I swear i will recognise it earlier next time!
Result; market went to target quite quickly without me onboard... pissed off? yes, but another feather in the cap as it were... carry on...

*Edit* In trying to determine the correct labeling, i am preferring some kind of double or possibly even a triple zigzag. Info says expanding triangles shouldn't occur in a 'C' wave and a diagonal would be contracting. PA also didn't conform within the lines, so a triple zigzag in an 'X' wave it shall be... same conclusion as to stop placement and same result with system target having now been met.
Davai - 12 Oct 2012 09:19 - 121 of 423
Hmmmmm, EW working well recently. Again, draw your lines from point 2&4 and run a parallel off of 1 to find likely target for 5. In this instance no valid trigger occured out of the flagline of 4. It is highly unlikely that this current hourly candle will print higher than the previous candle as it would trigger a far higher target.
We can expect an abc 'B' wave back down later, but probably a HH to come yet;

*Edit* there has been absolutely no further evidence of a turn so far and it looks like the last HH could be breached thus a 3rd wave to the longside...
We can expect an abc 'B' wave back down later, but probably a HH to come yet;

*Edit* there has been absolutely no further evidence of a turn so far and it looks like the last HH could be breached thus a 3rd wave to the longside...
Davai - 16 Oct 2012 09:29 - 122 of 423
Continuing from last post and also recording a couple of thoughts;
As above; we came back down in an ABC corrective (B) wave and have since printed what i suspect is another 5w up, (of which we may have just seen the top (speculative for now);

So, my overall thoughts are that we have possibly completed waves 1&2 of a large 'C' wave with the rest to follow shortly. If correct, this can take many forms, so again the next couple of charts are highly speculative. I'm posting them just to be able to compare to the actual event in a couple of weeks time...
It does however mean that i have something to work to and will now look for more evidence, starting with a LL/LH combo's.

or perhaps something like this;

I'm using this thread purely as a diary. This is not to try to claim guru points! Been there and made myself look silly on far too many occasions. EW has a way of presenting a case for both directions, however as i see it, what we have now looks very much like a 5-3-5 complete or nearing completion, so i am certainly looking for a trend change and some pippage to the short side soon with the possibility of the above scenario playing out... If it doesn't then at least i can look back and study to see what was different and how i can apply it to future analysis. There is STILL a case for 'B' being a fresh wave 1 and thus reality could be the exact opposite! with it being time to get long and strong, but i don't think so; it looks too much like its in a 3 wave move (corrective)...
As i have previously pointed out, i actually only play the smaller timescales and thus look for the HH/HL or LL/LH combo's and try to suss 5w/abc moves intraday, so its a case of building a picture and trading accordingly. Regardless, its nice to have a general plan to work too...
Just to include a further chart, here i can see we have reached a Fib retracement level of the larger 5w move down, coinciding with a trend line of an expanding diagonal, ending at the point 'E'.

*Edit* A fresh HH invalidates the above.
Clearly, the labeling in the last chart was wrong; '3' would be '5' (top of wave 1) and '4' was wave '2'. This makes me think the recent down move was a 4th and we are now playing out the 5th...
One possibility;

But i now prefer this : Daily;

Davai - 18 Oct 2012 10:11 - 123 of 423
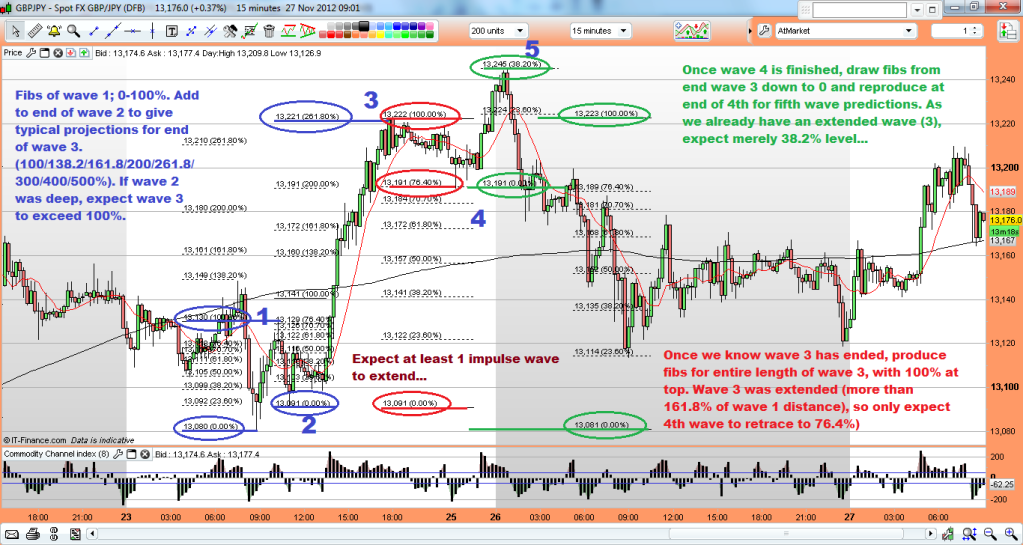
Using Fib retracement levels to determine likely end of corrective moves, in this case with the UsdJpy, the main phases (2&4) retrace 50% of the previous impulse wave (1&3) and the subwave 'iv's of 3&5 retracing 38.2% respectively...
Next step is to look for some likely targets for the 5th;

Next step is to look for some likely targets for the 5th;

Davai - 18 Oct 2012 10:20 - 124 of 423
25/10/12
Possibility of an expanding diagonal 'C' wave;

bigger picture;

If so, be wary that 'E' might be somewhat truncated, it might only just make a fresh low. The 61.8% fib of wave 'A' is common for length of the 'C' wave (red circle) or 76.4 could meet the trendline etc... of course 100% and more is poss too... but if it reverses off the top TL, expect a big down day tomorrow.
Davai - 31 Oct 2012 15:37 - 125 of 423
Update;


Davai - 24 Nov 2012 17:46 - 126 of 423
Post 122, i was looking for a 5 move 'C' wave;
In actual fact the 'B' wave was slightly longer, made a clear 5-3-5 and thus made a HH (looks far more obvious now!), before starting the drop for the 'C' wave. I was a little optimistic with the length perhaps, although the chart was meant purely to show the idea of the 5w 'C' (and not necessarily to scale);

and as this was from a few days ago, i can now see that we had a 'truncated' 5th wave to end with...

Davai - 01 Dec 2012 14:42 - 127 of 423

Update, ending diagonal 'C' wave, finished a little short of expectation, but the 5w followed as suspected;

The bigger picture suggests there is a mountain of downside coming;

*Edit 03/12/12* The above chart shows what was the 5th subwave of the third, thus the pullback seen was the fourth, another high followed also adhering to the rules;

Davai - 01 Dec 2012 15:08 - 128 of 423

Update, bit more difficult to follow, with 'irregular' corrections for both waves 2&4, but 5w up as suggested;

Davai - 01 Dec 2012 15:23 - 129 of 423

Davai - 01 Dec 2012 21:12 - 130 of 423
I dont normally trade index's, but catching up on Cinners thread earlier i thought i would run my eye over the FTSE. My belief is that the down move has been corrective and we have now completed a 5w advance, which means we will now correct in another ABC. The caveat right now is that we don't know what form this will take;

The fifth looks to have reached its target and zooming in on the final 5th wave, the evidence is stronger again;


The fifth looks to have reached its target and zooming in on the final 5th wave, the evidence is stronger again;

Davai - 04 Dec 2012 09:58 - 131 of 423
GbpJpy Update;

EurNzd; Difficult to determine right now, looks like a 5-3-5, which would mean an 'X' wave and thus a triple zigzag, with the 'Z' to come... more upside yet?
Second set just completed;

Will update NzdUsd later, looks like a bigger ABC than expected, still with 'C' to come?

EurNzd; Difficult to determine right now, looks like a 5-3-5, which would mean an 'X' wave and thus a triple zigzag, with the 'Z' to come... more upside yet?
Second set just completed;

Will update NzdUsd later, looks like a bigger ABC than expected, still with 'C' to come?
Davai - 05 Dec 2012 10:06 - 132 of 423
Post 129; NzdUsd;

Update; as suspected, it looks like we're well into the 'iii' of the 3rd now...

Update; as suspected, it looks like we're well into the 'iii' of the 3rd now...

Davai - 06 Dec 2012 13:25 - 133 of 423
Post 127, Ref EurNzd;
'The bigger picture suggests there is a mountain of downside coming;'

followed by, post 131;
'EurNzd; Difficult to determine right now, looks like a 5-3-5, which would mean an 'X' wave and thus a triple zigzag, with the 'Z' to come... more upside yet?'
We have since had some decent downside and a new low a moment ago, (breach of the low to the left of the chart), i would think negates the possibility of it being an 'X' wave.
As always a picture (chart) says a thousand words;
The drop;

Glad i got this one right, cos i completely f*cked up the FTSE predictions. The drop is coming, but no LL/LH combo's yet, in any case, i have since realised what i did wrong and learnt a little more from it, so its not all bad...
'The bigger picture suggests there is a mountain of downside coming;'
followed by, post 131;
'EurNzd; Difficult to determine right now, looks like a 5-3-5, which would mean an 'X' wave and thus a triple zigzag, with the 'Z' to come... more upside yet?'
We have since had some decent downside and a new low a moment ago, (breach of the low to the left of the chart), i would think negates the possibility of it being an 'X' wave.
As always a picture (chart) says a thousand words;
The drop;

Glad i got this one right, cos i completely f*cked up the FTSE predictions. The drop is coming, but no LL/LH combo's yet, in any case, i have since realised what i did wrong and learnt a little more from it, so its not all bad...
Seymour Clearly

 - 06 Dec 2012 19:34
- 134 of 423
- 06 Dec 2012 19:34
- 134 of 423


Thanks for these Davai. I tend to trade cable, fiber and chunnel only. Any particular reason for trading the currencies that you do?
Toya
- 06 Dec 2012 19:46
- 135 of 423
Very impressive Davai! So: short FTSE then...?
I daren't trade forex, though if I did I would probably expect the Euro to go down vs the US$ - in the light of today's comments by Draghi
I daren't trade forex, though if I did I would probably expect the Euro to go down vs the US$ - in the light of today's comments by Draghi
| About MoneyAM | Ts and Cs | Privacy Policy | Investment Warning | Content Standards | Corporate Solutions | Advertise With Us | Site Map | © 2026 MoneyAM |
Register now for FREE
Share Prices,
Stock Quotes,
Charts, Bulletin Boards, Indices, Watchlists, Portfolio, Market News, Research
or see our Premium Services including Level 2, Terminal and much more.