
| Home | Log In | Register | Our Services | My Account | Contact | Help |
You are NOT currently logged in
Technical Analysis (TA)
ptholden

 - 09 Jul 2007 23:14


I often find all manner of reference to Technical Analysis whilst reading threads, questioning certain elements, asking for advice on indicators and also requesting advice on a stock and whether it's a good time to buy, sell, hold or remain indifferent. I am the first to admit that my own TA is still in its infancy, but I do spend time on expanding my knowledge (hopefully in the right direction!).
Rather than having to ask a TA question on a particular thread, perhaps this thread could be used as a forum for TA queries and become a knowledge base. Just a thought, if there is little or no interest, the thread will sink without trace and that will be the end of that. I will personally add a few snippets to help those with less knowledge (if that's possible) to keep things rolling. There is a danger that the thread will receive countless requests for opinions on a variety of stocks and there is only so much I can do alone, therefore I would more than welcome input from other posters, no matter how rudimentary they believe their own knowledge to be, hopefully some real experts will take the time to contribute.
Rather than having to ask a TA question on a particular thread, perhaps this thread could be used as a forum for TA queries and become a knowledge base. Just a thought, if there is little or no interest, the thread will sink without trace and that will be the end of that. I will personally add a few snippets to help those with less knowledge (if that's possible) to keep things rolling. There is a danger that the thread will receive countless requests for opinions on a variety of stocks and there is only so much I can do alone, therefore I would more than welcome input from other posters, no matter how rudimentary they believe their own knowledge to be, hopefully some real experts will take the time to contribute.
maddoctor - 17 Jul 2007 12:08 - 128 of 504
you are right but you can draw a nice straight line acroos the tops of the rsi , if it was not a big results week in the US might have taken a short on the ftse
maggiebt4
- 17 Jul 2007 17:33
- 129 of 504
Does it indicate anything if the RSI is trending down but the sp is trending up? Please! Think I have read something about that on the thread but can't find now so forgive me if you have to repeat will read carefully this time. EMG down another 14 today am watching for support to kick in so far you (and me too )'ve got it right :o))))
ptholden
- 17 Jul 2007 18:15
- 130 of 504
Maggie, any indicator that is trending in one direction whilst the SP is heading in the other is termed divergence. You can have Bullish and Bearish; for instance if you can draw a downtrend across the top of the RSI (like EMG) whilst the SP is heading North you have bearish divergence, a possible sign of weakness and that at some point there may be a correction to any previous rise. In EMG's case it wouldn't be that pronounced were it not for the fact it did seem to get ahead of itself in February. Actually, you can also draw an uptrend on the RSI for EMG (I'll do that later), which would suggest that the SP is in consolidation mode of a sorts.
I take it you took profits further up, so well done you :))
Must say this looks like a cracking trading share :))
pth
Edit: I have edited this post in view of the following updated chart.
I take it you took profits further up, so well done you :))
Must say this looks like a cracking trading share :))
pth
Edit: I have edited this post in view of the following updated chart.
ptholden
- 17 Jul 2007 18:44
- 131 of 504
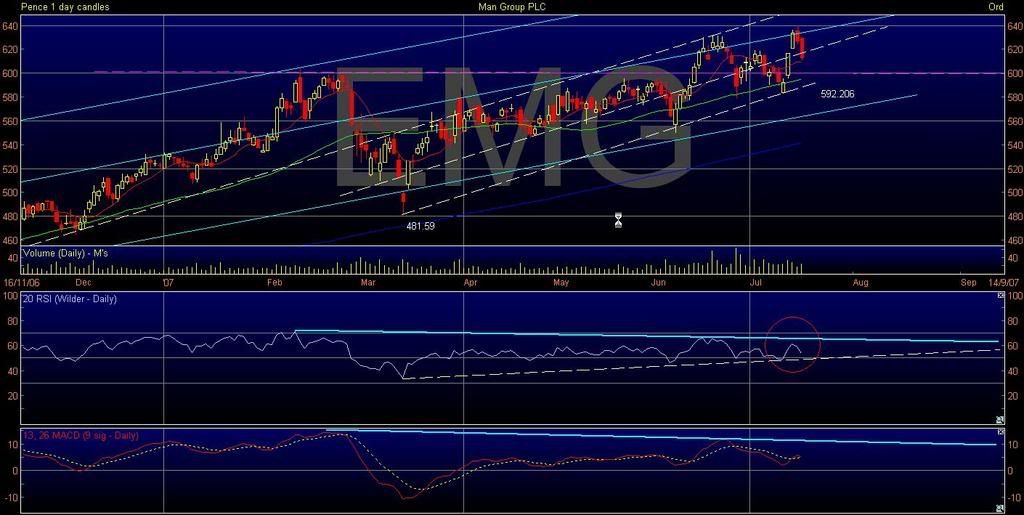
Hi Maggie, just updated the chart; I have drawn in the SP support level at 600p, which you can see acted as pretty robust res in Feb, May & Jun before the breakthrough. Now this res should have become pretty good support but has failed on two occasions since. Theoretically it should have, but didn't so I would treat this level with some suspicion. If the SP is in this new channel (white dashed lines) then immediate support in trend world is at 592p ish. It may be that there won't be too much movement tomorrow or the day after in which case this support line, the 50MA and 600p will merge offering a much better platform for the next leg up. I have also added a RSI uptend support line, keep an eye on this as any fall through here will indicate further weakness and a possible return to the shallower channel with associated lower rising support. If everything holds think I would be looking to go long Thursday or Friday from 595p - 600p, could all have changed by then though :)
pth
![<a href=]()
pth
maggiebt4
- 17 Jul 2007 23:46
- 132 of 504
Thanks again PTH am really getting hooked on this but have a lot to learn. I did take profits with EMG which are helping to cushion my losses - too long to list - The divergence question referred to UKC which I have been watching but not trading I think it could be a good trading share
maggiebt4
- 18 Jul 2007 00:05
- 133 of 504
Sorry question didn't refer to UKC at all and I can't remember now which share it was maybe I should just crawl into my box either that or give up atching sooooooooooo many shares!
garfeebloke - 18 Jul 2007 10:04 - 134 of 504
PT I hope you are trading some of these now.....as we discussed before.........you don't seem to be far wrong. All the best
Garfee
Garfee
garfeebloke - 18 Jul 2007 10:54 - 135 of 504
PT, I've now saved a TIFF a GIF and a BMP file to my desktop and I can't get either one to reproduce here. What I'm trying to do is demonstrate the Tate & Lyle chart and ask your opinion. I think I've identified two significant trend lines, one with four confirming touches in 2004 and the more recent, significant?? one with a whole bunch of touches in March this year and confirming touches in Feb/Mar 2003. Looks to me like we've strong support at 560 ish with an upside target of 800ish once the 660 resistance is out of the way.............wish I could do charts. What do you think Oh Mighty one??
ptholden
- 18 Jul 2007 21:53
- 136 of 504
garfee
Been out all day hacking around a rather good golf course, but spoiled by my rather feeble attempts. Will take a look at T&L and I think Fliper asked for one as well.
Maggie
Read EMG spot on, didn't think 600 would hold and a bounce from 588p as opposed to my predicted 592p (bugger 4p out). Wasn't expecting the volatility today though, but the markets are like that at the moment.
Unfortunately WNG fell back which came as a surprise, need to look at the RSI on that one and see where we are now.
Charts in a bit.
pth
ptholden
- 18 Jul 2007 22:24
- 137 of 504
EMG.
Depending on what happens tomorrow the steeper uptrend looks like it could be the 'right' trend for timing trades. 588p was the low of the day, which was a bit more movement than I expected, but it bounced right off the trendline and even recovered to sit on the 600p level. RSI is now sitting on rising support and not a lot to be gleaned from the MACD. The only other aspect I can draw attention to is the candle today which is more or less a 'long legged doji' a candle with a negligible body and equal upper and lower shadows. But all you have to know is that it reflects considerable indecision on the part of the market.
Difficult call tomorrow, personally I would be looking to go long, it was a good bounce today, but would wait for direction from the market to confirm a bounce off the RSI and also just in case there is a re-test of this channel.
pth
![<a href=]()

Depending on what happens tomorrow the steeper uptrend looks like it could be the 'right' trend for timing trades. 588p was the low of the day, which was a bit more movement than I expected, but it bounced right off the trendline and even recovered to sit on the 600p level. RSI is now sitting on rising support and not a lot to be gleaned from the MACD. The only other aspect I can draw attention to is the candle today which is more or less a 'long legged doji' a candle with a negligible body and equal upper and lower shadows. But all you have to know is that it reflects considerable indecision on the part of the market.
Difficult call tomorrow, personally I would be looking to go long, it was a good bounce today, but would wait for direction from the market to confirm a bounce off the RSI and also just in case there is a re-test of this channel.
pth
banjomick
- 18 Jul 2007 22:30
- 138 of 504
Evening pth,
Good thread and read,cheers.
Good thread and read,cheers.
ptholden
- 18 Jul 2007 22:33
- 139 of 504
Hi Mick, many thanks, good to see you still flying the flag for GON and MDW, you have the patience of a saint!! LoL.
ptholden
- 18 Jul 2007 22:40
- 140 of 504
WNG
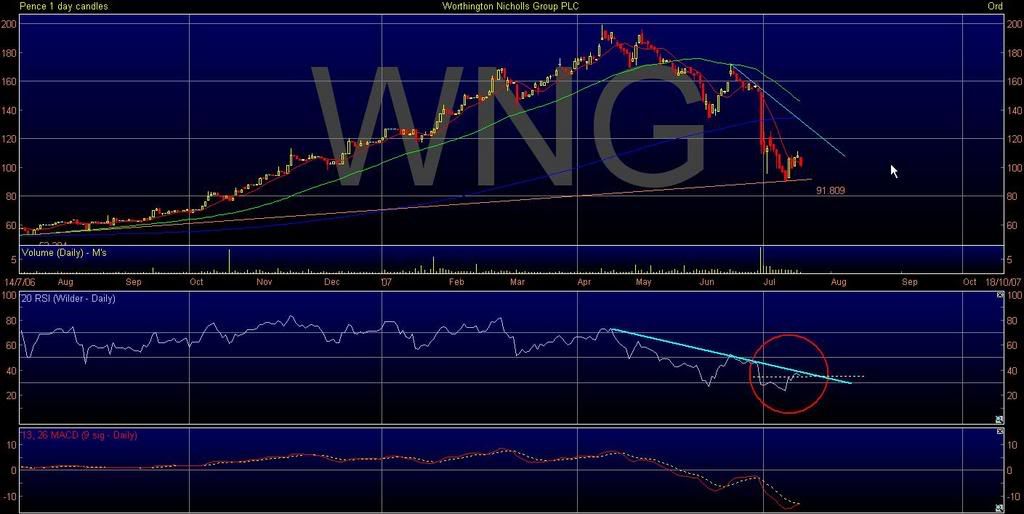
Slightly disappointing dip for WNG, although not surprising considering the FTSE fall and the general volatility of this share. However, not all is yet lost; buy signal generated by the RSI has not failed just yet, today's retracement is now testing the signal which is not unusual. Often having broken through a res level, SPs then fall back and use the same res as support. Still waiting for the downtrend res on the RSI to be broken, which would add credibilty to any recovery. MACD signal is trying to cross up. This may be a good place to open a trade or perhaps add with a tight stop at 90p. Again look for direction in the morning before taking the plunge.
pth
![<a href=]()
Slightly disappointing dip for WNG, although not surprising considering the FTSE fall and the general volatility of this share. However, not all is yet lost; buy signal generated by the RSI has not failed just yet, today's retracement is now testing the signal which is not unusual. Often having broken through a res level, SPs then fall back and use the same res as support. Still waiting for the downtrend res on the RSI to be broken, which would add credibilty to any recovery. MACD signal is trying to cross up. This may be a good place to open a trade or perhaps add with a tight stop at 90p. Again look for direction in the morning before taking the plunge.
pth
banjomick
- 18 Jul 2007 22:44
- 141 of 504
lol,I do dabble else where but i'm rather fond of those two companies and following them closely over the years has given me a very good insight into the AIM and the way things work in the markets generally. All good fun.
maggiebt4
- 18 Jul 2007 23:10
- 142 of 504
Fantastic call PTH but unfortunately I have no patience and went back in today in shares It was just too tempting! but will wait for direction to make a spread bet now that i understand what you mean. One question - as the upper & lower rsi trend lines are going to meet could one conclude that it has to break out either way, soon, to create new trendlines?
ptholden
- 18 Jul 2007 23:26
- 143 of 504
Garfee - tate & Lyle.
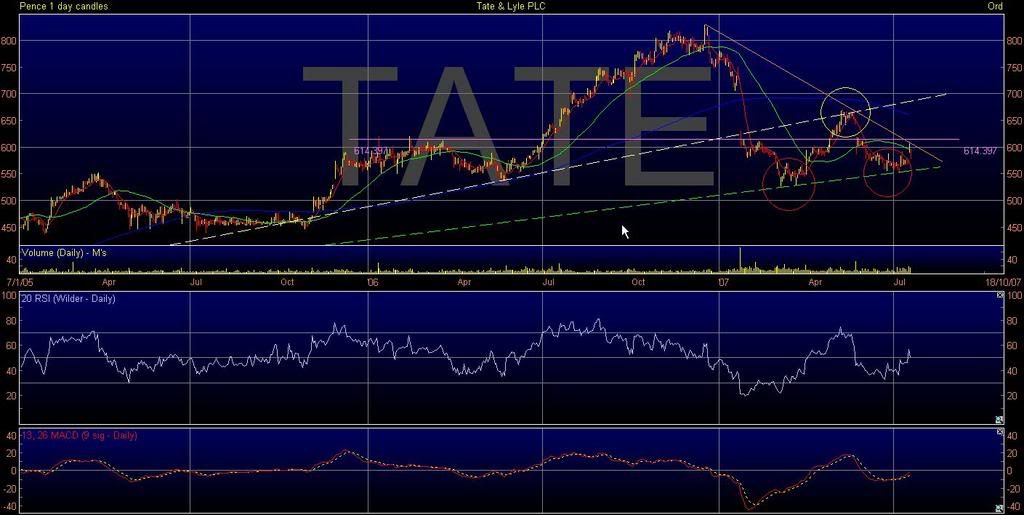
First a description of the trendlines; The whie dashed uptrend point of origin is July 2005 (as is the green). The SP used this as support until the sell off at the beginning of this year when the stock 'gapped' through. You can see why the recovery in May stalled as this previous support turned into resistance (circled in white). Once gapping through a new shallower uptrend was established (green dashed line) and this has been tested on a few occasions to good effect. You can also see that a downtrend is evident from the Dec high. There is also historical SP resistance at 615p converging in roughly the same vicinity.
Effectively to overcome both of these the SP needs a good push with good volume. Although not shown on this screenshot, the On Balance Volume (smooths out the daily 'Manhattan' volume indicator to a single line) has been falling since the last high. Not sure it's ready to have another thrash yet at breaking up, there may be a little more weakness first. If going long stick a stop in around 550p-555p.
pth
![<a href=]()
First a description of the trendlines; The whie dashed uptrend point of origin is July 2005 (as is the green). The SP used this as support until the sell off at the beginning of this year when the stock 'gapped' through. You can see why the recovery in May stalled as this previous support turned into resistance (circled in white). Once gapping through a new shallower uptrend was established (green dashed line) and this has been tested on a few occasions to good effect. You can also see that a downtrend is evident from the Dec high. There is also historical SP resistance at 615p converging in roughly the same vicinity.
Effectively to overcome both of these the SP needs a good push with good volume. Although not shown on this screenshot, the On Balance Volume (smooths out the daily 'Manhattan' volume indicator to a single line) has been falling since the last high. Not sure it's ready to have another thrash yet at breaking up, there may be a little more weakness first. If going long stick a stop in around 550p-555p.
pth
ptholden
- 18 Jul 2007 23:46
- 144 of 504
Maggie, well it will break out one way or another but not necessarily to establish a new trend, but to confirm a direction, although this may be short term. Don't get to wrapped up with the RSI, I think it has its uses when above 70 and below 30 and also to determine a possible trend in the SP, but it can whipsaw around, so be careful in its use.
pth
pth
Socrates
- 19 Jul 2007 10:10
- 145 of 504
PTH
I quite like the look of UNIQ chart, I've no idea what is driving it but as long as it trends up I'm happy. I'm no expert, but I agree with your post 144 about RSI, unless it is supported by other indicators it can be misleading. I believe UNIQ could be a case in point, where the RSI(14) of about 85 today is supported by momentum and divergence.
I quite like the look of UNIQ chart, I've no idea what is driving it but as long as it trends up I'm happy. I'm no expert, but I agree with your post 144 about RSI, unless it is supported by other indicators it can be misleading. I believe UNIQ could be a case in point, where the RSI(14) of about 85 today is supported by momentum and divergence.
ptholden
- 19 Jul 2007 23:33
- 146 of 504
No charts tonight, too knackered after yet more golf, but a few updates.
SOLA - Quietly tracking up its rising support on very subdured volume. Wouldn't go long or go short at the moment, but would continue to sit still if a holder.
WNG - Despite today's fall after a positive start, the RSI failure Swing remains intact. Rising support at 92p, falls through there time to think again.
EMG - Bounced off the middle of the 'new channel' to return to slightly suspect support at 600p. The bottom of the rising channel is now at 594p, so keep an eye on that support. If that does fail, maybe a return to the original shallower channel with rising support at 572p.
SCHE - Was under the opinion that 600p was the next target, although not quite so sure now. Room for further gains on the RSI, but starting to bounce off MACD resistance, which continues to display considerable bearish divergence. This just has to be a short soon (famous last words).
TAN - Still trying to get through that 200p level. Now this won't be make me very popular with TAN holders and I can't reaaly explain why I think this is going to happen, except that the SP growth has been exceptional and there should be corrections every now and again. I did think that the SP would fall back a touch to the 180s before breaking 200p. Rather than falling back we have witnessed a consolidation in a tight range. Sticking my neck out an awful long way, TAN will either fail totally at 200p and fall back to 175p-180p or break through, stall at 207p-210p and then fall back to the same level. Don't listen to me though, this scenario might be nuts!
See what happens tomorrow :)
pth
ptholden
- 19 Jul 2007 23:54
- 147 of 504
Socs, totally agree. Have had a look at the UNIQ chart and you are right to like the look of it. Nice breakout above res levels established over the last year and a bit. RSI looking toppy now though at 80(20), a level it hasn't got through over the same period. Wouldn't short it just because of that though, but wouldn't be surprised to see some retracement back to the breakout level of 239p. Actually wish I had been looking at this chart in May when it broke through that downtrend. Nice 15% profit or so to be had from that level, but aint hindsight a wonderful thing :)
pth
pth
| About MoneyAM | Ts and Cs | Privacy Policy | Investment Warning | Content Standards | Corporate Solutions | Advertise With Us | Site Map | © 2026 MoneyAM |
Register now for FREE
Share Prices,
Stock Quotes,
Charts, Bulletin Boards, Indices, Watchlists, Portfolio, Market News, Research
or see our Premium Services including Level 2, Terminal and much more.