
| Home | Log In | Register | Our Services | My Account | Contact | Help |
You are NOT currently logged in
Davai - 18 Apr 2012 11:13


Thread designed to record set-ups and targets on index and FX pairs.
'A market is only your enemy until you understand it, then it becomes your best friend.'
Any questions, please feel free to ask.
From time to time i may openly state an opinion regarding direction of a set-up and wish to add that in no way am i recommending a trade. I am sometimes only in trades for a matter of minutes and can't always update as to entry/exits taken.
As always, markets are dangerous places to be and must be respected as such. Always use stop losses and never over-leverage; 3% of your pot as a maximum per trade. As always, YOU are responsible for your own trades! Happy pip hunting!
Click HERE to visit me at FXtechnicals.net
Davai - 20 Apr 2012 14:48 - 29 of 423
Given up on the Euro some time ago. Not trending nicely at all and has an algo in play that gives me an entry right into a corrective move, so straight into a loss almost to stop out before turning. here is a perfect example of this, (despite it looking like a valid set-up, i can do without the stress!) The algo comes and goes, but it hasn't been flavour of the month for a while now;


Davai - 20 Apr 2012 14:49 - 30 of 423
Didn't think this was likely when i thought about it earlier, but now seems it is a possibility;


Davai - 20 Apr 2012 21:34 - 31 of 423
Poss daily count, Euro;


Davai - 20 Apr 2012 21:45 - 32 of 423
Alternative Dow;


Davai - 21 Apr 2012 13:20 - 33 of 423
Looking for a bullish day on Monday to give a nice set-up. here i'm looking for an hourly candle to finish at 6775 area and give a target of low 6900's, within the next two sessions...


Davai - 21 Apr 2012 13:22 - 34 of 423
Obviously complete contrast between the last two charts, so i need the market to show its hand. Will post an exact set-up as it happens. No trigger, no trade. Discipline and patience are equally as important as reading charts in a traders world.
Davai - 23 Apr 2012 10:21 - 35 of 423
Fridays action on the Dax (in particular) was puzzling if it was indeed to be as i had labeled it (a 'i'&'ii' leading to (sub)wave 'iii'), (bigger red circle);

Although powering up in the morning, there was simply no continuance. I was expecting something like i have shown, but instead we got the action within the blue circle, which was at least a red flag so to speak.

I closed the long and although i was tempted to re-enter as it drifted down in the evening, i thought it better to wait for more evidence.
Well, from the off this morning it looked like the alternative count was indeed the way forward, (this on the Dow, but they all make the main moves roughly in conjunction with one another);
Sure enough i got a short trigger on the FTSE at 08:01 and would consider we have quite a way to drop over the coming week. Perhaps a little too early to make that assumption, so the first requirement is a LL on the Dax (6529 req'd)
Davai - 23 Apr 2012 12:48 - 36 of 423
Updated FTSE probability;
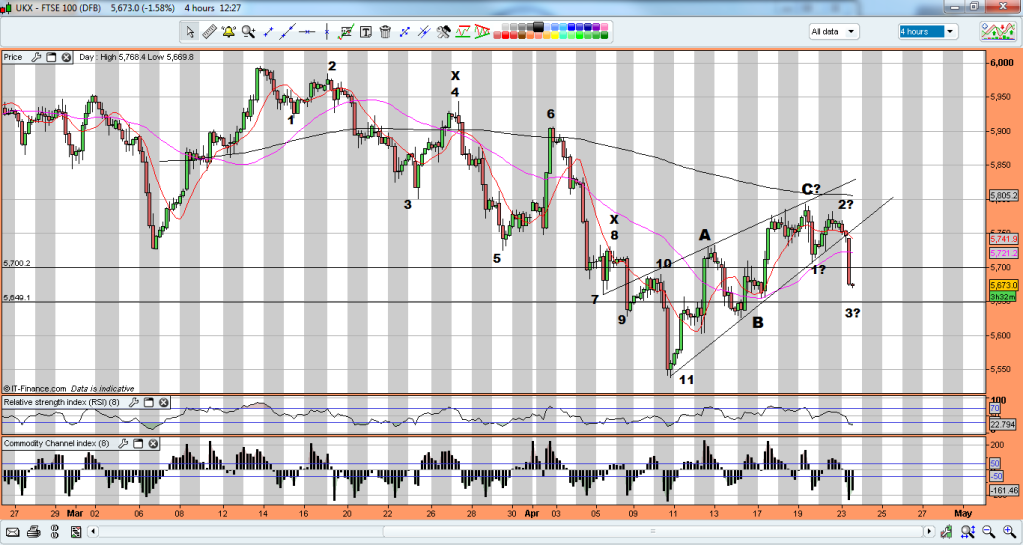
The only thing i don't like is that, again, its not very easy to make an obvious 5wave counter with 'A' and subsequent abc 3wave for 'B', (should be a 5-3-5). Certainly tricky right now and thus it best to keep taking small profits as and when the market gives the next clue. Trying to second guess the longer move right now, is simply not possible, with far too many connotations.

The only thing i don't like is that, again, its not very easy to make an obvious 5wave counter with 'A' and subsequent abc 3wave for 'B', (should be a 5-3-5). Certainly tricky right now and thus it best to keep taking small profits as and when the market gives the next clue. Trying to second guess the longer move right now, is simply not possible, with far too many connotations.
Davai - 23 Apr 2012 13:08 - 37 of 423
Now have a system generated Dow target, but trusting these whilst in complex corrective waves is dangerous, so small short position for now and would look out for a possible retest of the underneath of the lower TL;


Davai - 23 Apr 2012 16:15 - 38 of 423
Just trialling a small tweak and want to see how price reacts at targets (if at all)...


Davai - 23 Apr 2012 18:16 - 39 of 423
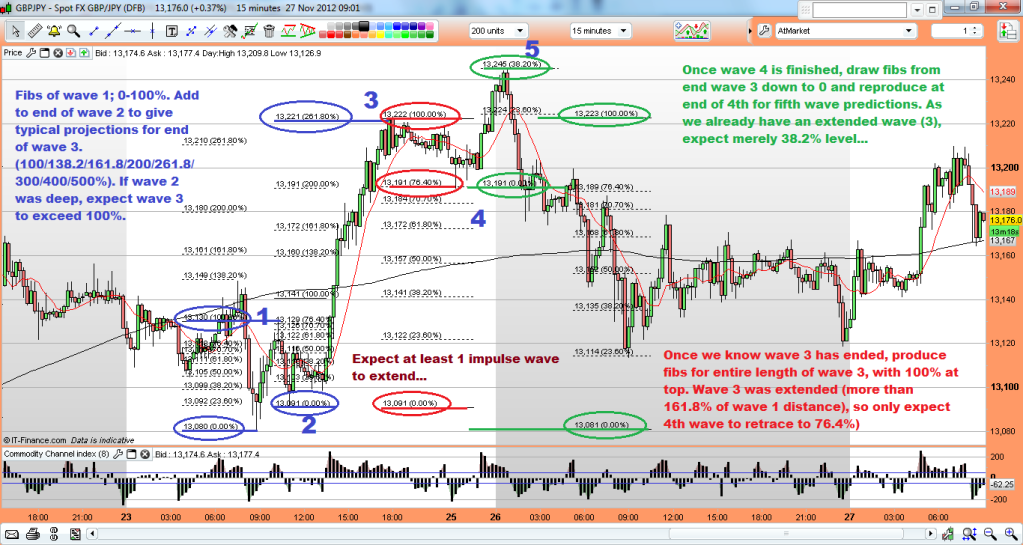
Ok, so using this as a diary to log my thought process. I have a system that works perfectly during trends, being able to dictate a TP (target price) with a very high success rate and thus, have never bothered trading the corrective moves as the chop makes it somewhat unreliable, however, i have deemed it necessary to continue to trade such times as they can indeed last for months. This has seen me have to concentrate more on studying Elliott Wave. It is obvious that you can't try to predict too far ahead during complex correctives, due to the endless connotations available to the market, however, it is very useful indeed to have a plan beforehand and then to reduce the timescales and look for shorter term set-ups. Here's a chart of the £/Yen that i have labelled... My thoughts with regard to the recent gain is that it is still corrective and we will see lower to come after completing a 'B' wave, however, i'm struggling to label last weeks rise as a full 5 waves. I thought the pullback today might be a 'iv', however it just doesn't fit and rather think this is as per the chart. Lets see how it plays out and at least i can compare afterwards to see where i went wrong...
(or curse that i never traded it, if it plays out correctly!)

(or curse that i never traded it, if it plays out correctly!)

Davai - 24 Apr 2012 10:29 - 40 of 423
Lets revisit this one;
Davai - 19 Apr 2012 18:44 - 18 of 39 edit this post
Just a spectator to this one as i missed the entry, target of 19,875;

Update; (target achieved);

Davai - 19 Apr 2012 18:44 - 18 of 39 edit this post
Just a spectator to this one as i missed the entry, target of 19,875;

Update; (target achieved);

Davai - 24 Apr 2012 12:34 - 41 of 423
Going back to my chart of the £/Yen in post 39;
To zoom in now on my 'suspected' 3 legged (abc) 'B'wave (of the 5-3-5), in particular what i expect to be the 'c', we can label it in 5;

Not so sure about allowing my subwaves 'i'&'iv' to overlap, but its not important. the interesting thing i have noticed on many occasion is that the subwave 'iv' of 3, is very often a smaller version of the pattern to expect in the 4th, (as shown in the red circles), in this case a flat abc correction...
Davai - 24 Apr 2012 22:26 - 42 of 423
With ref to above, slightly confusing, but i think it can be labelled differently, but with the same HH outcome (as was the case). Knackered right now, so will do it in the morning.
Davai - 25 Apr 2012 10:07 - 43 of 423
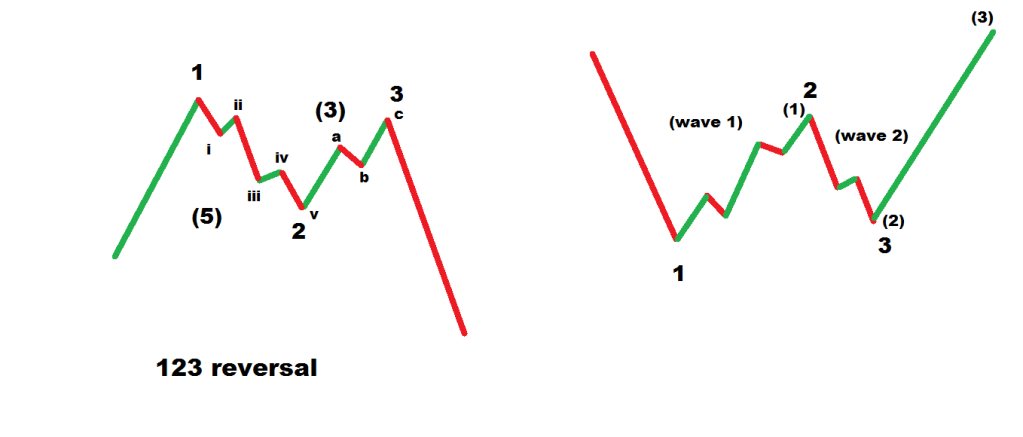
Ok, so without trying to label every last minuette subwave, this is how it looks. It's obvious to me that extended 5th waves occur frequently during corrective cycles, so point learnt. I have shown this in the following chart. I was right to expect a HH as per post 41, but didn't realise we were printing a larger (and somewhat out of proportion, it has to be said) 4th, (red circle)... Whilst looking for an end to the 5th, i look out for what is essentially a 123 reversal. As explained before, it is basically waves 1&2 of the next move, (blue circle)... the 123 is numbered 5,1&2 in that order, within the blue circle. Entry is upon break of point 2 and stop a pip above point 3... I went short earlier @ 13,120 using this popular reversal pattern, the poor GDP data sped things up a tad!


Davai - 25 Apr 2012 10:22 - 44 of 423
So back to post 39 when i posted this;
and now you can see how i first have a plan to work to and then scale down to follow PA in more detail. The updated chart (overall plan);

so far, so good...
and now you can see how i first have a plan to work to and then scale down to follow PA in more detail. The updated chart (overall plan);

so far, so good...
Davai - 25 Apr 2012 14:47 - 45 of 423
Update to trade and i think the markets done me a beauty. Originally banked a whack from the sharp drop this morning, but a bit of ill-discipline later and i find myself shorting free-style within what i presumed was a 4th wave, feeling safe in the knowledge a 5th wave and LL (lower low) was to come. Except, it took me far too long to accept or realise that the move wasn't flat enough. Pullback of '2' was quite sharp as per last chart, so '4' should be flat. Looking at the following chart, we have what i believe was a short 4th, (now shown as 'iv') with the 5th ('v') ending exactly to the tenth of a pip level with '3' ('iii'). This means back in 3 waves corrective for an ABC to form a much larger 1&2... I decided to close out giving back a large chunk of what i had gained earlier!... follow me so far?!
The chart;

I could have raised my stops, but would rather let it play out and look for more confirmation instead. I'm watching two fib retracement levels (orange and red) for a bounce, (the orange 61.8% being favourable as it should be a resistance turned support level). We then go back to looking for another 123 reversal pattern to form subwaves 1&2 of the 3rd. If correct a much larger drop should ensue. lets see...
Davai - 25 Apr 2012 15:13 - 46 of 423
The bigger picture of above;


Davai - 25 Apr 2012 16:06 - 47 of 423
Right now, its a case of waiting to see how it pans out. Next requirement is a clear 123 which will be subwaves 'i' & 'ii' of the 3rd, if my reading is still correct. I want to see a fairly clear 5 & 3 structure within it and then the trigger will be a break of wave 'i', (or point 2 as a 123);

Davai - 25 Apr 2012 18:05 - 48 of 423
Wouldn't surprise me at all if it reverses between the blue lines;


| About MoneyAM | Ts and Cs | Privacy Policy | Investment Warning | Content Standards | Corporate Solutions | Advertise With Us | Site Map | © 2026 MoneyAM |
Register now for FREE
Share Prices,
Stock Quotes,
Charts, Bulletin Boards, Indices, Watchlists, Portfolio, Market News, Research
or see our Premium Services including Level 2, Terminal and much more.