
| Home | Log In | Register | Our Services | My Account | Contact | Help |
You are NOT currently logged in
Register now or login to post to this thread.
Braemore Resources Uses Cutting Edge Technology (BRR)
niceonecyril - 25 May 2007 03:48
http://clients.westminster-digital.co.uk/minesite/microsite/events/50/video/index.aspx?companyId=50_1
=">http://www.proactiveinvestors.co.uk/pdf/brr.pdf
http://www.mineweb.com/mineweb/view/mineweb/en/page35?oid=39359&sn=Detail
www.braemoreresources.com
http://www.investegate.co.uk/Article.aspx?id=200711010702217873G
Powered by IST's
http://www.fsponline-recommends.co.uk/page.aspx?u=rhpsl1007&tc=ERHPCB02&PresentationsID=21147065172&
http://www.proactiveinvestors.co.uk/audio/img src="http://charts.moneyam.com/Chart.aspx?Provider=EODIntra&Code=BRR&Size=460&Skin=BlackBlue&Type=2&Scale=0&Span=YEAR1&MA=&EMA=25;50;200;&OVER=&IND=&XCycle=&XFormat=&Layout=2Line;Default;Price;HisDate&SV=0">
http://www.resourceinvestor.com/pebble.asp?relid=38513
http://www.proactiveinvestors.co.uk/articles/art.php?BRR2
cyril
mitzy - 30 Nov 2007 14:11 - 311 of 810
thanks teddybear I will wait a while longer before I decide.
canada1 - 30 Nov 2007 14:43 - 312 of 810
Profit ??, is that when the little blue numbers are higher than the number I bort at ?
teddybear5
 - 30 Nov 2007 15:13
- 313 of 810
- 30 Nov 2007 15:13
- 313 of 810

yes.
Toya
 - 30 Nov 2007 15:31
- 314 of 810
- 30 Nov 2007 15:31
- 314 of 810

Mitzy: my approach is to take a profit when I can, especially if I reckon I can pick up stock again at a lower price than I sold at. Hence: sold yesterday, kept the profit, back for more earlier today - I felt that the price may not drop far below the 20p mark this time, having had news of that MOU that you pointed out couple of days ago.
Good luck, whatever you decide!
Good luck, whatever you decide!
mitzy - 30 Nov 2007 15:42 - 315 of 810
thanks Toya 20p seems to be the support for now.
Toya
- 30 Nov 2007 15:53
- 316 of 810
I agree Mitzy, it does. That's why I bought back in today, below 20.50p, thinking I wouldn't get it much cheaper than that.
mitzy - 01 Dec 2007 09:12 - 317 of 810
Toya whats the latest from rhps..?
Toya
- 01 Dec 2007 09:41
- 318 of 810
I've no idea Mitzy - don't subscribe to it.
ptholden
- 01 Dec 2007 21:46
- 319 of 810
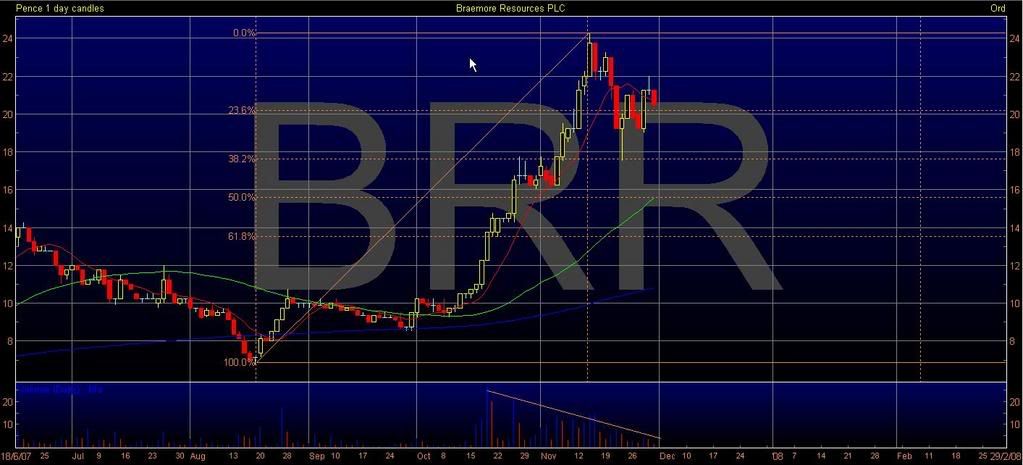
BRR attracted my attention from a TA perspective, simply because I wonder when a stock displays accelerated growth how far it will retrace. Accelerated SP growth is unsustainable, it has to take a breather some time. There are a variety of charting methods, speed resistance lines, Gann angles (plus a few more) most of which are a variation or interpretation of Fibonacci Retracements Levels. Basically Fibs act as support levels and are relatively easy to use.
On this screenshot I have 'drawn' Fibs and support was hit at 38.2%, a popular retracement level. Having recovered a little the SP is falling back once more, the question now of course is how far? Certainly the value of Fibs is as a stop loss position or a signal to initiate a trade; however do not take a long position just because a Fib level has been hit (catching falling knives) look to other indicators, especially volume to assess if a bottom has been reached.
On this particular chart the first retrace hit 18p (38%) and the recovery found support at 20p (23.6%) having made a lower high, volume has fallen off and if this level doesn't hold 16p is definitely on the cards (50%). Actually, this makes a lot of sense, chartists always say 50% is a good retracement level for an over-heated stock and with good reason, it normally represents a trendline drawn at 45 degrees, an accepted 'rate of growth'.
Make of it what you will :)
pth
cynic
- 02 Dec 2007 07:41
- 320 of 810
not a lot - lol! ...... i think GANN uses different %, and when i get round to it, i'll look at the info i have.
mitzy - 02 Dec 2007 10:23 - 321 of 810
Thanks pt its always useful to have a fibonacci viewpoint.
ptholden
- 02 Dec 2007 12:50
- 322 of 810
I think you will find Richard that although constructed differently Gann angles have a close corellation to Fib retracements (and extensions).
Toya
- 02 Dec 2007 17:44
- 323 of 810
PT - thanks for the pretty chart and notes! Please excuse my ignorance (yet again!) but what is a "TA perspective"? Territorial Army? dont think so! Total Annihilation? - hope not! [Timing Algorithm, Think Attack, something Analysis??]
TA - Thanks Again
TA - ToyA
TA - Thanks Again
TA - ToyA
ptholden
- 02 Dec 2007 18:01
- 324 of 810
Your last suggestion ToyA was pretty close:
Technecial Analysis :) In t'other words 'charting'
Some where on this board is a TA thread I started some months ago, it's fallen into the doldrums cos I haven't been around to keep it alive. Some interesting comments on there from other posters, you may benefit from a quick shufti, then again you may find it a load of old tosh!!
Toya
- 02 Dec 2007 18:16
- 325 of 810
Thanks A lot pt! :)
I did find some interesting websites that give endless explanations about chart analysis - fascinating, but looks like a lifetime's work to understand it all. I will try and get a bit of a handle on it though.
I did find some interesting websites that give endless explanations about chart analysis - fascinating, but looks like a lifetime's work to understand it all. I will try and get a bit of a handle on it though.
cynic
- 02 Dec 2007 18:34
- 326 of 810
Toya ..... but never get misled into believing that charts are more than a very useful tool even though, because many follow, are suprisingly often self-fulfilling
Toya
- 02 Dec 2007 18:39
- 327 of 810
Thanks for that proviso Cynic. Difficult enough to make the right decisions, without or without charts in any case!
I've been having a lovely relaxing day today, not having to think about what my shares are doing. How about you?
I've been having a lovely relaxing day today, not having to think about what my shares are doing. How about you?
cynic
- 02 Dec 2007 19:19
- 328 of 810
lot of fun golfing in the wind ..... now plotting the route for our (3/4 of us) cycling trip to Perigod next year
HARRYCAT
- 02 Dec 2007 19:42
- 329 of 810
Perigord!!! I don't suppose you would reconsider & re-route via the foothills of the Andes? You could have a quick shufti at GOO's progress as well as getting fit! :o)
ptholden
- 02 Dec 2007 19:43
- 330 of 810
ToyA, Cynic and I have been round this particular buoy previously, he believes TA is no more than a useful tool, personally I believe TA has much greater value and utility. Yes it is self-fulfilling purely because so many peeps use TA. Actually if ye olde Cynic were to analyse his own investment decisions he would discover that most are based on TA. How often does he post comment re 25MAs, 50MAs and any other time frame MA? Quite a lot, hoist by your own petard Richard :)
MAs form part of TA, in fact when all said and done MAs are trendlines, the basic premise of charting.
You don't need to spend hours learning this stuff, just basic trends, support and resistance lines will serve you well when making decisions.
MAs form part of TA, in fact when all said and done MAs are trendlines, the basic premise of charting.
You don't need to spend hours learning this stuff, just basic trends, support and resistance lines will serve you well when making decisions.
| About MoneyAM | Ts and Cs | Privacy Policy | Investment Warning | Content Standards | Corporate Solutions | Advertise With Us | Site Map | © 2026 MoneyAM |
Register now for FREE
Share Prices,
Stock Quotes,
Charts, Bulletin Boards, Indices, Watchlists, Portfolio, Market News, Research
or see our Premium Services including Level 2, Terminal and much more.