
| Home | Log In | Register | Our Services | My Account | Contact | Help |
You are NOT currently logged in
Register now or login to post to this thread.
Braemore Resources Uses Cutting Edge Technology (BRR)
niceonecyril - 25 May 2007 03:48
http://clients.westminster-digital.co.uk/minesite/microsite/events/50/video/index.aspx?companyId=50_1
=">http://www.proactiveinvestors.co.uk/pdf/brr.pdf
http://www.mineweb.com/mineweb/view/mineweb/en/page35?oid=39359&sn=Detail
www.braemoreresources.com
http://www.investegate.co.uk/Article.aspx?id=200711010702217873G
Powered by IST's
http://www.fsponline-recommends.co.uk/page.aspx?u=rhpsl1007&tc=ERHPCB02&PresentationsID=21147065172&
http://www.proactiveinvestors.co.uk/audio/img src="http://charts.moneyam.com/Chart.aspx?Provider=EODIntra&Code=BRR&Size=460&Skin=BlackBlue&Type=2&Scale=0&Span=YEAR1&MA=&EMA=25;50;200;&OVER=&IND=&XCycle=&XFormat=&Layout=2Line;Default;Price;HisDate&SV=0">
http://www.resourceinvestor.com/pebble.asp?relid=38513
http://www.proactiveinvestors.co.uk/articles/art.php?BRR2
cyril
canada1 - 29 Nov 2007 08:10 - 301 of 810
You might be too cynical on this one cynic, remember Thermalite blocks ?, made from the waste product from power stations, the company that developed thermalite blocks were paid to take the waste away.
niceonecyril - 29 Nov 2007 08:16 - 302 of 810
Theirs a lot of companies who made fortunes from coal slag heaps.
cyril
cyril
Toya

 - 29 Nov 2007 08:19
- 303 of 810
- 29 Nov 2007 08:19
- 303 of 810


Morning Cynic: Tom Bulford also tipped TAN back in its early days.
Level2 looking nicely blue this morning: 21.25-22.00p
Level2 looking nicely blue this morning: 21.25-22.00p
canada1 - 29 Nov 2007 08:19 - 304 of 810
How did you know my wife was called coal?
Toya
- 29 Nov 2007 08:21
- 305 of 810
Wow - glad to see someone's wide awake here!!
canada1 - 29 Nov 2007 08:55 - 306 of 810
Nice, 176,000 long at 22p
mitzy - 29 Nov 2007 09:05 - 307 of 810
Any mention inpapers..>
Toya
- 29 Nov 2007 09:10
- 308 of 810
Not to my knowledge Mitzy.
mitzy - 30 Nov 2007 13:50 - 309 of 810
Bit of a dilemma for me whether to hold or sell..
teddybear5
- 30 Nov 2007 14:03
- 310 of 810
if your in profit take some mitzy nothing wrong with taking a bit of profit imo this wont start to take off untill 2008+
mitzy - 30 Nov 2007 14:11 - 311 of 810
thanks teddybear I will wait a while longer before I decide.
canada1 - 30 Nov 2007 14:43 - 312 of 810
Profit ??, is that when the little blue numbers are higher than the number I bort at ?
teddybear5
- 30 Nov 2007 15:13
- 313 of 810
yes.
Toya
- 30 Nov 2007 15:31
- 314 of 810
Mitzy: my approach is to take a profit when I can, especially if I reckon I can pick up stock again at a lower price than I sold at. Hence: sold yesterday, kept the profit, back for more earlier today - I felt that the price may not drop far below the 20p mark this time, having had news of that MOU that you pointed out couple of days ago.
Good luck, whatever you decide!
Good luck, whatever you decide!
mitzy - 30 Nov 2007 15:42 - 315 of 810
thanks Toya 20p seems to be the support for now.
Toya
- 30 Nov 2007 15:53
- 316 of 810
I agree Mitzy, it does. That's why I bought back in today, below 20.50p, thinking I wouldn't get it much cheaper than that.
mitzy - 01 Dec 2007 09:12 - 317 of 810
Toya whats the latest from rhps..?
Toya
- 01 Dec 2007 09:41
- 318 of 810
I've no idea Mitzy - don't subscribe to it.
ptholden
- 01 Dec 2007 21:46
- 319 of 810
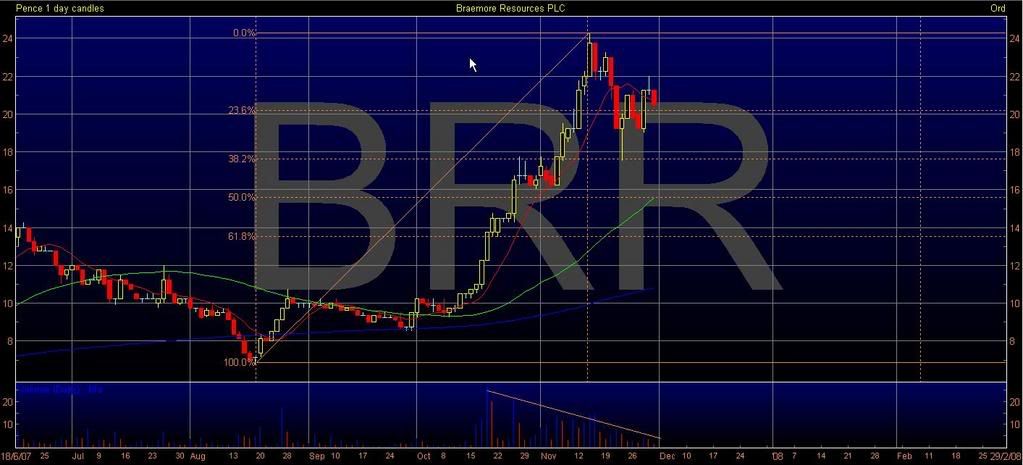
BRR attracted my attention from a TA perspective, simply because I wonder when a stock displays accelerated growth how far it will retrace. Accelerated SP growth is unsustainable, it has to take a breather some time. There are a variety of charting methods, speed resistance lines, Gann angles (plus a few more) most of which are a variation or interpretation of Fibonacci Retracements Levels. Basically Fibs act as support levels and are relatively easy to use.
On this screenshot I have 'drawn' Fibs and support was hit at 38.2%, a popular retracement level. Having recovered a little the SP is falling back once more, the question now of course is how far? Certainly the value of Fibs is as a stop loss position or a signal to initiate a trade; however do not take a long position just because a Fib level has been hit (catching falling knives) look to other indicators, especially volume to assess if a bottom has been reached.
On this particular chart the first retrace hit 18p (38%) and the recovery found support at 20p (23.6%) having made a lower high, volume has fallen off and if this level doesn't hold 16p is definitely on the cards (50%). Actually, this makes a lot of sense, chartists always say 50% is a good retracement level for an over-heated stock and with good reason, it normally represents a trendline drawn at 45 degrees, an accepted 'rate of growth'.
Make of it what you will :)
pth
cynic
- 02 Dec 2007 07:41
- 320 of 810
not a lot - lol! ...... i think GANN uses different %, and when i get round to it, i'll look at the info i have.
| About MoneyAM | Ts and Cs | Privacy Policy | Investment Warning | Content Standards | Corporate Solutions | Advertise With Us | Site Map | © 2026 MoneyAM |
Register now for FREE
Share Prices,
Stock Quotes,
Charts, Bulletin Boards, Indices, Watchlists, Portfolio, Market News, Research
or see our Premium Services including Level 2, Terminal and much more.