
| Home | Log In | Register | Our Services | My Account | Contact | Help |
You are NOT currently logged in
Register now or login to post to this thread.
CHART ATTACK - Longs and Shorts. (epic char) (CHAR)
goldfinger

 - 12 Jan 2010 20:42


A thread created for the TA of charts on the LSE markets. (aim and plus included)
Beginners and advanced wellcome. Long or short, just post your views and lets have some positive discussion. FIRE AWAY.
NB, UK indicies and sector charts can also to be included in posters analysis
Money am instructions for posting a chart..http://www.moneyam.com/help/?page=charts
My Twitter Platform, please feel free to visit me and post..http://twitter.com/#!/MickKipper
Kipper System 1 http://t.co/heOgs9b
nb, you may have to log in to get access to some of the links here. Every one is free.
RESOURCES
http://blog.tradersdaytrading.com/ http://stockcharts.com/school/doku.php?id=chart_school http://www.cantos.com/charts/masterclass http://www.onlinetradingconcepts.com/TechnicalAnalysis/ZigZag.html http://bigcharts.marketwatch.com/ http://www.stockmarket-coach.com/index.html http://www.trade2win.com/knowledge/equities/ http://www.financial-spread-betting.com/
CHART SCREENERS
http://www.iii.co.uk/spreadbetting/?type=technical http://www.barchart.com/lookup.php?field=name&search=contains&string=YELL&e=nf&type[]=2&type[]=1&type[]=5&type[]=9&type[]=10&type[]=4&type[]=CAN&type[]=LON&type[]=IND#results http://www.autochartist.com/ Nb, only free to IG Index Members. http://www.britishbulls.com/
BULLISH TRENDING CHARTS. Timeframe 3 Daily. Updates And Renewals Will Take Place On a regular basis.
MOMENTUM http://www.onlinetradingconcepts.com/TechnicalAnalysis/Momentum.html ADX http://stockcharts.com/school/doku.php?st=adx&id=chart_school:technical_indicators:average_directional_
;EMA(26);EMA(50);EMA(200)&IND=VOLMA(60);MTM(6,6);ADX(14)&Layout=2Line;Default;Price;HisDate&XCycle=&XFormat=)
;EMA(50);EMA(200)&IND=VOLMA(60);MTM(6,6);ADX(14)&Layout=2Line;Default;Price;HisDate&XCycle=&XFormat=)
;EMA(50);EMA(200)&IND=VOLMA(60);MTM(6,6);ADX(14)&Layout=2Line;Default;Price;HisDate&XCycle=&XFormat=)
;EMA(50);EMA(200)&IND=VOLMA(60);MTM(6,6);ADX(14)&Layout=2Line;Default;Price;HisDate&XCycle=&XFormat=)
;EMA(50);EMA(200)&IND=VOLMA(60);MTM(6,6);ADX(14)&Layout=2Line;Default;Price;HisDate&XCycle=&XFormat=)
;EMA(50);EMA(200)&IND=VOLMA(60);MTM(6,6);ADX(14)&Layout=2Line;Default;Price;HisDate&XCycle=&XFormat=)
;EMA(50);EMA(200)&IND=VOLMA(60);MTM(6,6);ADX(14)&Layout=2Line;Default;Price;HisDate&XCycle=&XFormat=)
;EMA(12);EMA(200)&IND=VOLMA(60);MTM(6,6);ADX(14)&Layout=2Line;Default;Price;HisDate&XCycle=&XFormat=)
;EMA(12);EMA(200)&IND=VOLMA(60);MTM(6,6);ADX(14)&Layout=2Line;Default;Price;HisDate&XCycle=&XFormat=)
;EMA(50);EMA(200)&IND=VOLMA(60);MTM(6,6);ADX(14)&Layout=2Line;Default;Price;HisDate&XCycle=&XFormat=)
;EMA(50);EMA(200)&IND=VOLMA(60);MTM(6,6);ADX(14)&Layout=2Line;Default;Price;HisDate&XCycle=&XFormat=)
;EMA(50);EMA(200)&IND=VOLMA(60);MTM(6,6);ADX(14)&Layout=2Line;Default;Price;HisDate&XCycle=&XFormat=)
;EMA(25);EMA(50);EMA(200)&IND=VOLMA(60);MTM(6,6);ADX(14)&Layout=2Line;Default;Price;HisDate&XCycle=&XFormat=)
;EMA(25);EMA(50);EMA(200)&IND=VOLMA(60);MTM(6,6);ADX(14)&Layout=2Line;Default;Price;HisDate&XCycle=&XFormat=)
;EMA(25);EMA(50);EMA(200)&IND=VOLMA(60);MTM(6,6);ADX(14)&Layout=2Line;Default;Price;HisDate&XCycle=&XFormat=)
;EMA(25);EMA(50);EMA(200)&IND=VOLMA(60);MTM(6,6);ADX(14)&Layout=2Line;Default;Price;HisDate&XCycle=&XFormat=)
;EMA(25);EMA(50);EMA(200)&IND=VOLMA(60);MTM(6,6);ADX(14)&Layout=2Line;Default;Price;HisDate&XCycle=&XFormat=)
;EMA(25);EMA(50);EMA(200)&IND=VOLMA(60);MTM(6,6);ADX(14)&Layout=2Line;Default;Price;HisDate&XCycle=&XFormat=)
;EMA(25);EMA(50);EMA(200)&IND=VOLMA(60);MTM(6,6);ADX(14)&Layout=2Line;Default;Price;HisDate&XCycle=&XFormat=)
;EMA(25);EMA(50);EMA(200)&IND=VOLMA(60);MTM(6,6);ADX(14)&Layout=2Line;Default;Price;HisDate&XCycle=&XFormat=)
;EMA(25);EMA(50);EMA(200)&IND=VOLMA(60);MTM(6,6);ADX(14)&Layout=2Line;Default;Price;HisDate&XCycle=&XFormat=)
;EMA(25);EMA(50);EMA(200)&IND=VOLMA(60);MTM(6,6);ADX(14)&Layout=2Line;Default;Price;HisDate&XCycle=&XFormat=)
;EMA(25);EMA(50);EMA(200)&IND=VOLMA(60);MTM(6,6);ADX(14)&Layout=2Line;Default;Price;HisDate&XCycle=&XFormat=)
;EMA(25);EMA(50);EMA(200)&IND=VOLMA(60);MTM(6,6);ADX(14)&Layout=2Line;Default;Price;HisDate&XCycle=&XFormat=)
;EMA(25);EMA(50);EMA(200)&IND=VOLMA(60);MTM(6,6);ADX(14)&Layout=2Line;Default;Price;HisDate&XCycle=&XFormat=)
;EMA(25);EMA(50);EMA(200)&IND=VOLMA(60);MTM(6,6);ADX(14)&Layout=2Line;Default;Price;HisDate&XCycle=&XFormat=)
;EMA(25);EMA(50);EMA(200)&IND=VOLMA(60);MTM(6,6);ADX(14)&Layout=2Line;Default;Price;HisDate&XCycle=&XFormat=)
 BEARISH TRENDING CHARTS Timeframe 3 Daily. Updates And Renewals Will Take Place On A Regular Basis.
BEARISH TRENDING CHARTS Timeframe 3 Daily. Updates And Renewals Will Take Place On A Regular Basis.
;EMA(50);EMA(200)&IND=VOLMA(60);MTM(6,6);ADX(14)&Layout=2Line;Default;Price;HisDate&XCycle=&XFormat=)
;EMA(50);EMA(200)&IND=VOLMA(60);MTM(6,6);ADX(14)&Layout=2Line;Default;Price;HisDate&XCycle=&XFormat=)
;EMA(25);EMA(50);EMA(200)&IND=VOLMA(60);MTM(6,6);ADX(14)&Layout=2Line;Default;Price;HisDate&XCycle=&XFormat=)
;EMA(50);EMA(200)&IND=VOLMA(60);MTM(6,6);ADX(14)&Layout=2Line;Default;Price;HisDate&XCycle=&XFormat=)
;EMA(25);EMA(50);EMA(200)&IND=VOLMA(60);MTM(6,6);ADX(14)&Layout=2Line;Default;Price;HisDate&XCycle=&XFormat=)
 12 WEEK HIGHS Timeframe 3 Daily. Updates And Renewals Will Take Place On A Regular Basis.
12 WEEK HIGHS Timeframe 3 Daily. Updates And Renewals Will Take Place On A Regular Basis.
;EMA(50);EMA(200)&IND=VOLMA(60);MTM(6,6);ADX(14)&Layout=2Line;Default;Price;HisDate&XCycle=&XFormat=)
;EMA(50);EMA(200)&IND=VOLMA(60);MTM(6,6);ADX(14)&Layout=2Line;Default;Price;HisDate&XCycle=&XFormat=)
;EMA(50);EMA(200)&IND=VOLMA(60);MTM(6,6);ADX(14)&Layout=2Line;Default;Price;HisDate&XCycle=&XFormat=)
;EMA(50);EMA(200)&IND=VOLMA(60);MTM(6,6);ADX(14)&Layout=2Line;Default;Price;HisDate&XCycle=&XFormat=)
;EMA(50);EMA(200)&IND=VOLMA(60);MTM(6,6);ADX(14)&Layout=2Line;Default;Price;HisDate&XCycle=&XFormat=)
;EMA(50);EMA(200)&IND=VOLMA(60);MTM(6,6);ADX(14)&Layout=2Line;Default;Price;HisDate&XCycle=&XFormat=)
;EMA(50);EMA(200)&IND=VOLMA(60);MTM(6,6);ADX(14)&Layout=2Line;Default;Price;HisDate&XCycle=&XFormat=)
;EMA(50);EMA(200)&IND=VOLMA(60);MTM(6,6);ADX(14)&Layout=2Line;Default;Price;HisDate&XCycle=&XFormat=)
;EMA(50);EMA(200)&IND=VOLMA(60);MTM(6,6);ADX(14)&Layout=2Line;Default;Price;HisDate&XCycle=&XFormat=)
;EMA(50);EMA(200)&IND=VOLMA(60);MTM(6,6);ADX(14)&Layout=2Line;Default;Price;HisDate&XCycle=&XFormat=)
;EMA(25);EMA(50);EMA(200)&IND=VOLMA(60);MTM(6,6);ADX(14)&Layout=2Line;Default;Price;HisDate&XCycle=&XFormat=)
;EMA(25);EMA(50);EMA(200)&IND=VOLMA(60);MTM(6,6);ADX(14)&Layout=2Line;Default;Price;HisDate&XCycle=&XFormat=)
;EMA(25);EMA(50);EMA(200)&IND=VOLMA(60);MTM(6,6);ADX(14)&Layout=2Line;Default;Price;HisDate&XCycle=&XFormat=)
;EMA(25);EMA(50);EMA(200)&IND=VOLMA(60);MTM(6,6);ADX(14)&Layout=2Line;Default;Price;HisDate&XCycle=&XFormat=)
 <
< ;EMA(25);EMA(50);EMA(200)&IND=VOLMA(60);MTM(6,6);ADX(14)&Layout=2Line;Default;Price;HisDate&XCycle=&XFormat=)
;EMA(25);EMA(50);EMA(200)&IND=VOLMA(60);MTM(6,6);ADX(14)&Layout=2Line;Default;Price;HisDate&XCycle=&XFormat=)
;EMA(25);EMA(50);EMA(200)&IND=VOLMA(60);MTM(6,6);ADX(14)&Layout=2Line;Default;Price;HisDate&XCycle=&XFormat=)
;EMA(25);EMA(50);EMA(200)&IND=VOLMA(60);MTM(6,6);ADX(14)&Layout=2Line;Default;Price;HisDate&XCycle=&XFormat=)
;EMA(25);EMA(50);EMA(200)&IND=VOLMA(60);MTM(6,6);ADX(14)&Layout=2Line;Default;Price;HisDate&XCycle=&XFormat=)
;EMA(25);EMA(50);EMA(200)&IND=VOLMA(60);MTM(6,6);ADX(14)&Layout=2Line;Default;Price;HisDate&XCycle=&XFormat=)
;EMA(25);EMA(50);EMA(200)&IND=VOLMA(60);MTM(6,6);ADX(14)&Layout=2Line;Default;Price;HisDate&XCycle=&XFormat=)
;EMA(25);EMA(50);EMA(200)&IND=VOLMA(60);MTM(6,6);ADX(14)&Layout=2Line;Default;Price;HisDate&XCycle=&XFormat=)
;EMA(25);EMA(50);EMA(200)&IND=VOLMA(60);MTM(6,6);ADX(14)&Layout=2Line;Default;Price;HisDate&XCycle=&XFormat=)
;EMA(25);EMA(50);EMA(200)&IND=VOLMA(60);MTM(6,6);ADX(14)&Layout=2Line;Default;Price;HisDate&XCycle=&XFormat=)
Beginners and advanced wellcome. Long or short, just post your views and lets have some positive discussion. FIRE AWAY.
NB, UK indicies and sector charts can also to be included in posters analysis
Money am instructions for posting a chart..http://www.moneyam.com/help/?page=charts
My Twitter Platform, please feel free to visit me and post..http://twitter.com/#!/MickKipper
Kipper System 1 http://t.co/heOgs9b
nb, you may have to log in to get access to some of the links here. Every one is free.
RESOURCES
http://blog.tradersdaytrading.com/ http://stockcharts.com/school/doku.php?id=chart_school http://www.cantos.com/charts/masterclass http://www.onlinetradingconcepts.com/TechnicalAnalysis/ZigZag.html http://bigcharts.marketwatch.com/ http://www.stockmarket-coach.com/index.html http://www.trade2win.com/knowledge/equities/ http://www.financial-spread-betting.com/
CHART SCREENERS
http://www.iii.co.uk/spreadbetting/?type=technical http://www.barchart.com/lookup.php?field=name&search=contains&string=YELL&e=nf&type[]=2&type[]=1&type[]=5&type[]=9&type[]=10&type[]=4&type[]=CAN&type[]=LON&type[]=IND#results http://www.autochartist.com/ Nb, only free to IG Index Members. http://www.britishbulls.com/
BULLISH TRENDING CHARTS. Timeframe 3 Daily. Updates And Renewals Will Take Place On a regular basis.
MOMENTUM http://www.onlinetradingconcepts.com/TechnicalAnalysis/Momentum.html ADX http://stockcharts.com/school/doku.php?st=adx&id=chart_school:technical_indicators:average_directional_
goldfinger
- 27 Apr 2012 14:53
- 2480 of 3532
SIA SC looks rather horny. Checking.
goldfinger
- 27 Apr 2012 15:21
- 2481 of 3532
AVN Avanti Screen Media
Technicals point of view now.
It has broken out above prior resistance.

Technicals point of view now.
It has broken out above prior resistance.
KullyB - 27 Apr 2012 15:54 - 2482 of 3532
Hi All
Interesting one here which IS going against the trend (cardinal sin I know!). They're reporting next week on 3rd (expecting good results) and thinking of a short. I know Mick has it on the bullish trending charts above. Reason's being:
*Divergence being created between the price and stochs/RSI/MACD/MACD Histo
*Volume's drying up
*ATR exhausted suggesting bull's have run out of steam
*MACDs

I'm suggesting if on the 3rd May results are good and something of a shooting star is confirmed I will take a short. Not a high conviction trade as against the trade (look's mad I know!).
Kind Regards All and Have a Fab Weekend
KullyB
Interesting one here which IS going against the trend (cardinal sin I know!). They're reporting next week on 3rd (expecting good results) and thinking of a short. I know Mick has it on the bullish trending charts above. Reason's being:
*Divergence being created between the price and stochs/RSI/MACD/MACD Histo
*Volume's drying up
*ATR exhausted suggesting bull's have run out of steam
*MACDs
I'm suggesting if on the 3rd May results are good and something of a shooting star is confirmed I will take a short. Not a high conviction trade as against the trade (look's mad I know!).
Kind Regards All and Have a Fab Weekend
KullyB
goldfinger
- 27 Apr 2012 16:56
- 2483 of 3532
Your probably spot on kully, the above charts at top of thread are not my recos dont forget they are just stocks that have hit normally 9 month or 12 months highs or other way round for bearish stocks.
They are picked so that they are as liquid as possible.
I have done no research on them at all, these are just IDEAS dont forget. Its up to posters to DYOR on them and take it further.
Having said that I have had a few nice earners on them jumping on the trend on pull backs etc.
Good luck have a nice weekend.
Im off up to Wetherfield Manchester tonight to Terry Duckworths new bar ie, Spearmint Porno. Ive heard its a lap dancing joint.
goldfinger
- 28 Apr 2012 08:28
- 2484 of 3532
Bearish Trending Charts in the header.
Out goes EMG and UKC downward trend come to an halt.
In comes WIN and IMM downtrend firmly established.
Out goes EMG and UKC downward trend come to an halt.
In comes WIN and IMM downtrend firmly established.
goldfinger
- 28 Apr 2012 08:54
- 2485 of 3532
Bullish Trending Charts in the header.
Out goes CML.....uptrend stalled.
In comes GFRD and DPLM both charts trending upwards.
Out goes CML.....uptrend stalled.
In comes GFRD and DPLM both charts trending upwards.
goldfinger
- 28 Apr 2012 08:57
- 2486 of 3532
Thinking of adding a third category of chart to the header ie, CHARTS IN A RANGE, if you have any examples please post them down here. Got a few ideas at moment but would like more.
Cheers All have a good weekend.
Cheers All have a good weekend.
goldfinger
- 28 Apr 2012 09:01
- 2487 of 3532
Just had another quick look at the uptrending charts and Senior and Diploma look absolute peaches. TCY looks a real corker. Just my own observations. I do not hold them.
goldfinger
- 30 Apr 2012 16:30
- 2488 of 3532
Doing some research on SNR.
Seymour Clearly
- 01 May 2012 09:11
- 2489 of 3532
Bought some AV. yesterday for the SIPP. Lovely yield.

goldfinger
- 01 May 2012 15:27
- 2490 of 3532
Gone long on DPLM results in about 10 days hoping for run up. Trading ahead on last statement. P/E of just 13 to 2013 and that looks like its going to fall.
Chart in Bullish stocks header above.
Chart in Bullish stocks header above.
goldfinger
- 02 May 2012 09:48
- 2491 of 3532
This market has got that bank holiday feeling. Volumes well down.
jonuk76
- 02 May 2012 10:30
- 2493 of 3532
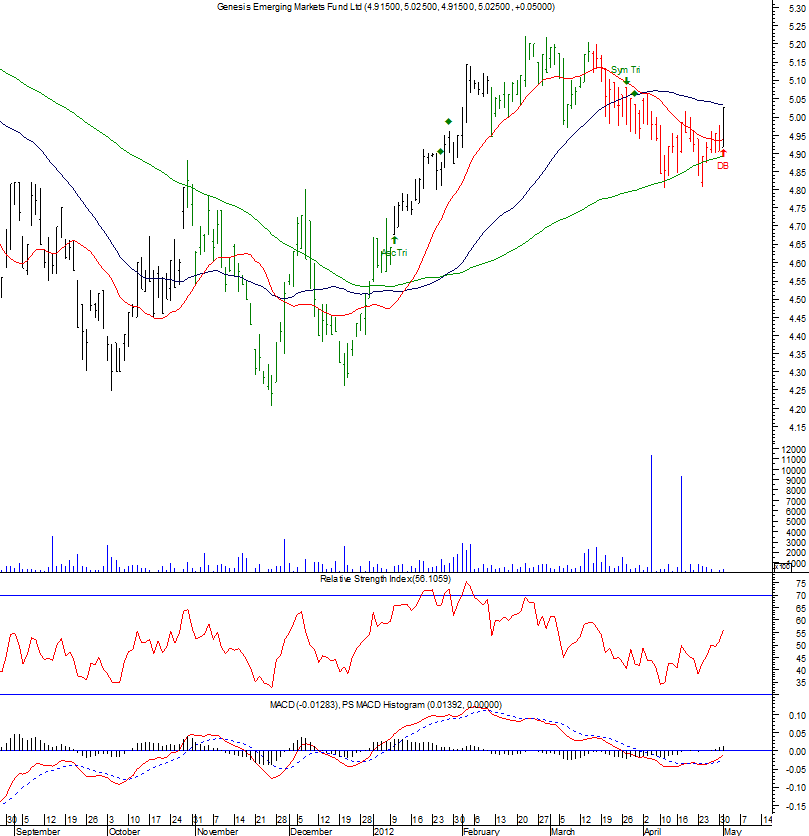
Here's a couple of investment trusts showing bullish chart formations.
A head and shoulders bottom on Blackrock World Mining Trust (BRWM)..
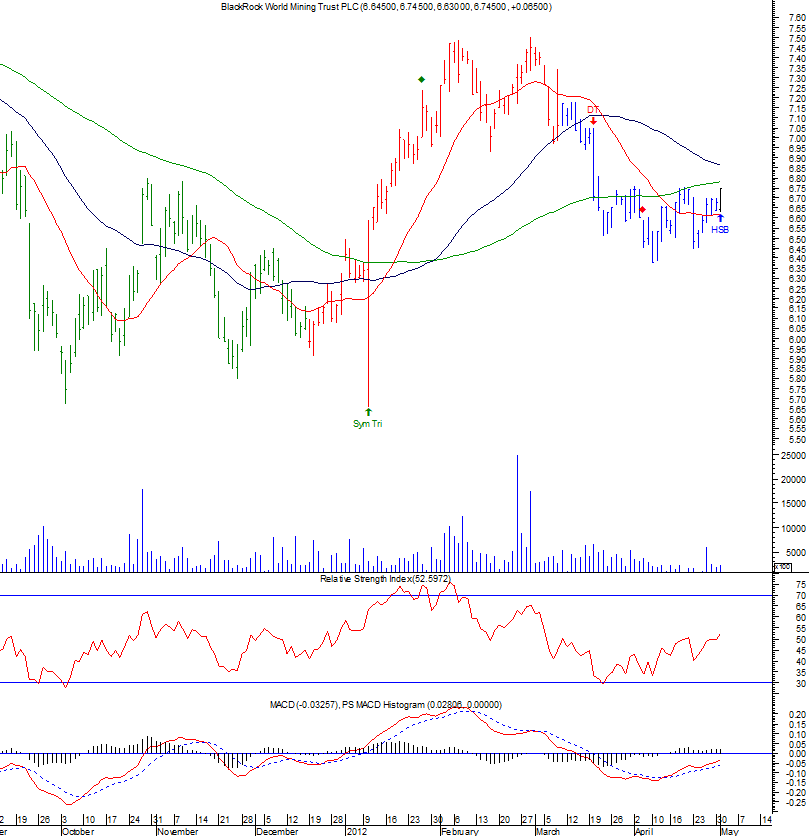
And a double bottom on Genesis Emerging Markets (GSS)
A head and shoulders bottom on Blackrock World Mining Trust (BRWM)..
And a double bottom on Genesis Emerging Markets (GSS)
skinny
- 02 May 2012 16:34
- 2494 of 3532
PSPI (post 2344) down another 10% today.
;MA(50);MA(100)&IND=RSI(14);MTM(6,6);VOLMA&Layout=2Line;Default;Price;HisDate&XCycle=&XFormat=)
goldfinger
- 02 May 2012 17:10
- 2495 of 3532
4 charts taken out of Bullish Trending Charts (might be a couple more tomorrow aswel.)
Trend upwards faltered.
They are....COB ALY IMG AIE
Been a real kull today for momentum stocks.
Trend upwards faltered.
They are....COB ALY IMG AIE
Been a real kull today for momentum stocks.
goldfinger
- 02 May 2012 17:11
- 2496 of 3532
New Bullish Trending Stocks and Bearish Trending Stocks to be updated early evening when data comes to hand.
goldfinger
- 03 May 2012 08:07
- 2497 of 3532
Been a technical glitch, should be OK later today.
Seymour Clearly
- 03 May 2012 09:41
- 2498 of 3532
DRX had a storming day yesterday. For those not on board might be a pullback soon, although the true chartists will want 580 cleared.

goldfinger
- 03 May 2012 14:28
- 2499 of 3532
sc drx GOOD DEFENSIVE PLAY.
| About MoneyAM | Ts and Cs | Privacy Policy | Investment Warning | Content Standards | Corporate Solutions | Advertise With Us | Site Map | © 2026 MoneyAM |
Register now for FREE
Share Prices,
Stock Quotes,
Charts, Bulletin Boards, Indices, Watchlists, Portfolio, Market News, Research
or see our Premium Services including Level 2, Terminal and much more.