
| Home | Log In | Register | Our Services | My Account | Contact | Help |
You are NOT currently logged in
Register now or login to post to this thread.
CHART ATTACK - Longs and Shorts. (epic char) (CHAR)
goldfinger

 - 12 Jan 2010 20:42


A thread created for the TA of charts on the LSE markets. (aim and plus included)
Beginners and advanced wellcome. Long or short, just post your views and lets have some positive discussion. FIRE AWAY.
NB, UK indicies and sector charts can also to be included in posters analysis
Money am instructions for posting a chart..http://www.moneyam.com/help/?page=charts
My Twitter Platform, please feel free to visit me and post..http://twitter.com/#!/MickKipper
Kipper System 1 http://t.co/heOgs9b
nb, you may have to log in to get access to some of the links here. Every one is free.
RESOURCES
http://blog.tradersdaytrading.com/ http://stockcharts.com/school/doku.php?id=chart_school http://www.cantos.com/charts/masterclass http://www.onlinetradingconcepts.com/TechnicalAnalysis/ZigZag.html http://bigcharts.marketwatch.com/ http://www.stockmarket-coach.com/index.html http://www.trade2win.com/knowledge/equities/ http://www.financial-spread-betting.com/
CHART SCREENERS
http://www.iii.co.uk/spreadbetting/?type=technical http://www.barchart.com/lookup.php?field=name&search=contains&string=YELL&e=nf&type[]=2&type[]=1&type[]=5&type[]=9&type[]=10&type[]=4&type[]=CAN&type[]=LON&type[]=IND#results http://www.autochartist.com/ Nb, only free to IG Index Members. http://www.britishbulls.com/
BULLISH TRENDING CHARTS. Timeframe 3 Daily. Updates And Renewals Will Take Place On a regular basis.
MOMENTUM http://www.onlinetradingconcepts.com/TechnicalAnalysis/Momentum.html ADX http://stockcharts.com/school/doku.php?st=adx&id=chart_school:technical_indicators:average_directional_
;EMA(26);EMA(50);EMA(200)&IND=VOLMA(60);MTM(6,6);ADX(14)&Layout=2Line;Default;Price;HisDate&XCycle=&XFormat=)
;EMA(50);EMA(200)&IND=VOLMA(60);MTM(6,6);ADX(14)&Layout=2Line;Default;Price;HisDate&XCycle=&XFormat=)
;EMA(50);EMA(200)&IND=VOLMA(60);MTM(6,6);ADX(14)&Layout=2Line;Default;Price;HisDate&XCycle=&XFormat=)
;EMA(50);EMA(200)&IND=VOLMA(60);MTM(6,6);ADX(14)&Layout=2Line;Default;Price;HisDate&XCycle=&XFormat=)
;EMA(50);EMA(200)&IND=VOLMA(60);MTM(6,6);ADX(14)&Layout=2Line;Default;Price;HisDate&XCycle=&XFormat=)
;EMA(50);EMA(200)&IND=VOLMA(60);MTM(6,6);ADX(14)&Layout=2Line;Default;Price;HisDate&XCycle=&XFormat=)
;EMA(50);EMA(200)&IND=VOLMA(60);MTM(6,6);ADX(14)&Layout=2Line;Default;Price;HisDate&XCycle=&XFormat=)
;EMA(12);EMA(200)&IND=VOLMA(60);MTM(6,6);ADX(14)&Layout=2Line;Default;Price;HisDate&XCycle=&XFormat=)
;EMA(12);EMA(200)&IND=VOLMA(60);MTM(6,6);ADX(14)&Layout=2Line;Default;Price;HisDate&XCycle=&XFormat=)
;EMA(50);EMA(200)&IND=VOLMA(60);MTM(6,6);ADX(14)&Layout=2Line;Default;Price;HisDate&XCycle=&XFormat=)
;EMA(50);EMA(200)&IND=VOLMA(60);MTM(6,6);ADX(14)&Layout=2Line;Default;Price;HisDate&XCycle=&XFormat=)
;EMA(50);EMA(200)&IND=VOLMA(60);MTM(6,6);ADX(14)&Layout=2Line;Default;Price;HisDate&XCycle=&XFormat=)
;EMA(25);EMA(50);EMA(200)&IND=VOLMA(60);MTM(6,6);ADX(14)&Layout=2Line;Default;Price;HisDate&XCycle=&XFormat=)
;EMA(25);EMA(50);EMA(200)&IND=VOLMA(60);MTM(6,6);ADX(14)&Layout=2Line;Default;Price;HisDate&XCycle=&XFormat=)
;EMA(25);EMA(50);EMA(200)&IND=VOLMA(60);MTM(6,6);ADX(14)&Layout=2Line;Default;Price;HisDate&XCycle=&XFormat=)
;EMA(25);EMA(50);EMA(200)&IND=VOLMA(60);MTM(6,6);ADX(14)&Layout=2Line;Default;Price;HisDate&XCycle=&XFormat=)
;EMA(25);EMA(50);EMA(200)&IND=VOLMA(60);MTM(6,6);ADX(14)&Layout=2Line;Default;Price;HisDate&XCycle=&XFormat=)
;EMA(25);EMA(50);EMA(200)&IND=VOLMA(60);MTM(6,6);ADX(14)&Layout=2Line;Default;Price;HisDate&XCycle=&XFormat=)
;EMA(25);EMA(50);EMA(200)&IND=VOLMA(60);MTM(6,6);ADX(14)&Layout=2Line;Default;Price;HisDate&XCycle=&XFormat=)
;EMA(25);EMA(50);EMA(200)&IND=VOLMA(60);MTM(6,6);ADX(14)&Layout=2Line;Default;Price;HisDate&XCycle=&XFormat=)
;EMA(25);EMA(50);EMA(200)&IND=VOLMA(60);MTM(6,6);ADX(14)&Layout=2Line;Default;Price;HisDate&XCycle=&XFormat=)
;EMA(25);EMA(50);EMA(200)&IND=VOLMA(60);MTM(6,6);ADX(14)&Layout=2Line;Default;Price;HisDate&XCycle=&XFormat=)
;EMA(25);EMA(50);EMA(200)&IND=VOLMA(60);MTM(6,6);ADX(14)&Layout=2Line;Default;Price;HisDate&XCycle=&XFormat=)
;EMA(25);EMA(50);EMA(200)&IND=VOLMA(60);MTM(6,6);ADX(14)&Layout=2Line;Default;Price;HisDate&XCycle=&XFormat=)
;EMA(25);EMA(50);EMA(200)&IND=VOLMA(60);MTM(6,6);ADX(14)&Layout=2Line;Default;Price;HisDate&XCycle=&XFormat=)
;EMA(25);EMA(50);EMA(200)&IND=VOLMA(60);MTM(6,6);ADX(14)&Layout=2Line;Default;Price;HisDate&XCycle=&XFormat=)
;EMA(25);EMA(50);EMA(200)&IND=VOLMA(60);MTM(6,6);ADX(14)&Layout=2Line;Default;Price;HisDate&XCycle=&XFormat=)
 BEARISH TRENDING CHARTS Timeframe 3 Daily. Updates And Renewals Will Take Place On A Regular Basis.
BEARISH TRENDING CHARTS Timeframe 3 Daily. Updates And Renewals Will Take Place On A Regular Basis.
;EMA(50);EMA(200)&IND=VOLMA(60);MTM(6,6);ADX(14)&Layout=2Line;Default;Price;HisDate&XCycle=&XFormat=)
;EMA(50);EMA(200)&IND=VOLMA(60);MTM(6,6);ADX(14)&Layout=2Line;Default;Price;HisDate&XCycle=&XFormat=)
;EMA(25);EMA(50);EMA(200)&IND=VOLMA(60);MTM(6,6);ADX(14)&Layout=2Line;Default;Price;HisDate&XCycle=&XFormat=)
;EMA(50);EMA(200)&IND=VOLMA(60);MTM(6,6);ADX(14)&Layout=2Line;Default;Price;HisDate&XCycle=&XFormat=)
;EMA(25);EMA(50);EMA(200)&IND=VOLMA(60);MTM(6,6);ADX(14)&Layout=2Line;Default;Price;HisDate&XCycle=&XFormat=)
 12 WEEK HIGHS Timeframe 3 Daily. Updates And Renewals Will Take Place On A Regular Basis.
12 WEEK HIGHS Timeframe 3 Daily. Updates And Renewals Will Take Place On A Regular Basis.
;EMA(50);EMA(200)&IND=VOLMA(60);MTM(6,6);ADX(14)&Layout=2Line;Default;Price;HisDate&XCycle=&XFormat=)
;EMA(50);EMA(200)&IND=VOLMA(60);MTM(6,6);ADX(14)&Layout=2Line;Default;Price;HisDate&XCycle=&XFormat=)
;EMA(50);EMA(200)&IND=VOLMA(60);MTM(6,6);ADX(14)&Layout=2Line;Default;Price;HisDate&XCycle=&XFormat=)
;EMA(50);EMA(200)&IND=VOLMA(60);MTM(6,6);ADX(14)&Layout=2Line;Default;Price;HisDate&XCycle=&XFormat=)
;EMA(50);EMA(200)&IND=VOLMA(60);MTM(6,6);ADX(14)&Layout=2Line;Default;Price;HisDate&XCycle=&XFormat=)
;EMA(50);EMA(200)&IND=VOLMA(60);MTM(6,6);ADX(14)&Layout=2Line;Default;Price;HisDate&XCycle=&XFormat=)
;EMA(50);EMA(200)&IND=VOLMA(60);MTM(6,6);ADX(14)&Layout=2Line;Default;Price;HisDate&XCycle=&XFormat=)
;EMA(50);EMA(200)&IND=VOLMA(60);MTM(6,6);ADX(14)&Layout=2Line;Default;Price;HisDate&XCycle=&XFormat=)
;EMA(50);EMA(200)&IND=VOLMA(60);MTM(6,6);ADX(14)&Layout=2Line;Default;Price;HisDate&XCycle=&XFormat=)
;EMA(50);EMA(200)&IND=VOLMA(60);MTM(6,6);ADX(14)&Layout=2Line;Default;Price;HisDate&XCycle=&XFormat=)
;EMA(25);EMA(50);EMA(200)&IND=VOLMA(60);MTM(6,6);ADX(14)&Layout=2Line;Default;Price;HisDate&XCycle=&XFormat=)
;EMA(25);EMA(50);EMA(200)&IND=VOLMA(60);MTM(6,6);ADX(14)&Layout=2Line;Default;Price;HisDate&XCycle=&XFormat=)
;EMA(25);EMA(50);EMA(200)&IND=VOLMA(60);MTM(6,6);ADX(14)&Layout=2Line;Default;Price;HisDate&XCycle=&XFormat=)
;EMA(25);EMA(50);EMA(200)&IND=VOLMA(60);MTM(6,6);ADX(14)&Layout=2Line;Default;Price;HisDate&XCycle=&XFormat=)
 <
< ;EMA(25);EMA(50);EMA(200)&IND=VOLMA(60);MTM(6,6);ADX(14)&Layout=2Line;Default;Price;HisDate&XCycle=&XFormat=)
;EMA(25);EMA(50);EMA(200)&IND=VOLMA(60);MTM(6,6);ADX(14)&Layout=2Line;Default;Price;HisDate&XCycle=&XFormat=)
;EMA(25);EMA(50);EMA(200)&IND=VOLMA(60);MTM(6,6);ADX(14)&Layout=2Line;Default;Price;HisDate&XCycle=&XFormat=)
;EMA(25);EMA(50);EMA(200)&IND=VOLMA(60);MTM(6,6);ADX(14)&Layout=2Line;Default;Price;HisDate&XCycle=&XFormat=)
;EMA(25);EMA(50);EMA(200)&IND=VOLMA(60);MTM(6,6);ADX(14)&Layout=2Line;Default;Price;HisDate&XCycle=&XFormat=)
;EMA(25);EMA(50);EMA(200)&IND=VOLMA(60);MTM(6,6);ADX(14)&Layout=2Line;Default;Price;HisDate&XCycle=&XFormat=)
;EMA(25);EMA(50);EMA(200)&IND=VOLMA(60);MTM(6,6);ADX(14)&Layout=2Line;Default;Price;HisDate&XCycle=&XFormat=)
;EMA(25);EMA(50);EMA(200)&IND=VOLMA(60);MTM(6,6);ADX(14)&Layout=2Line;Default;Price;HisDate&XCycle=&XFormat=)
;EMA(25);EMA(50);EMA(200)&IND=VOLMA(60);MTM(6,6);ADX(14)&Layout=2Line;Default;Price;HisDate&XCycle=&XFormat=)
;EMA(25);EMA(50);EMA(200)&IND=VOLMA(60);MTM(6,6);ADX(14)&Layout=2Line;Default;Price;HisDate&XCycle=&XFormat=)
Beginners and advanced wellcome. Long or short, just post your views and lets have some positive discussion. FIRE AWAY.
NB, UK indicies and sector charts can also to be included in posters analysis
Money am instructions for posting a chart..http://www.moneyam.com/help/?page=charts
My Twitter Platform, please feel free to visit me and post..http://twitter.com/#!/MickKipper
Kipper System 1 http://t.co/heOgs9b
nb, you may have to log in to get access to some of the links here. Every one is free.
RESOURCES
http://blog.tradersdaytrading.com/ http://stockcharts.com/school/doku.php?id=chart_school http://www.cantos.com/charts/masterclass http://www.onlinetradingconcepts.com/TechnicalAnalysis/ZigZag.html http://bigcharts.marketwatch.com/ http://www.stockmarket-coach.com/index.html http://www.trade2win.com/knowledge/equities/ http://www.financial-spread-betting.com/
CHART SCREENERS
http://www.iii.co.uk/spreadbetting/?type=technical http://www.barchart.com/lookup.php?field=name&search=contains&string=YELL&e=nf&type[]=2&type[]=1&type[]=5&type[]=9&type[]=10&type[]=4&type[]=CAN&type[]=LON&type[]=IND#results http://www.autochartist.com/ Nb, only free to IG Index Members. http://www.britishbulls.com/
BULLISH TRENDING CHARTS. Timeframe 3 Daily. Updates And Renewals Will Take Place On a regular basis.
MOMENTUM http://www.onlinetradingconcepts.com/TechnicalAnalysis/Momentum.html ADX http://stockcharts.com/school/doku.php?st=adx&id=chart_school:technical_indicators:average_directional_
goldfinger
- 01 May 2012 15:27
- 2490 of 3532
Gone long on DPLM results in about 10 days hoping for run up. Trading ahead on last statement. P/E of just 13 to 2013 and that looks like its going to fall.
Chart in Bullish stocks header above.
Chart in Bullish stocks header above.
goldfinger
- 02 May 2012 09:48
- 2491 of 3532
This market has got that bank holiday feeling. Volumes well down.
jonuk76
- 02 May 2012 10:30
- 2493 of 3532
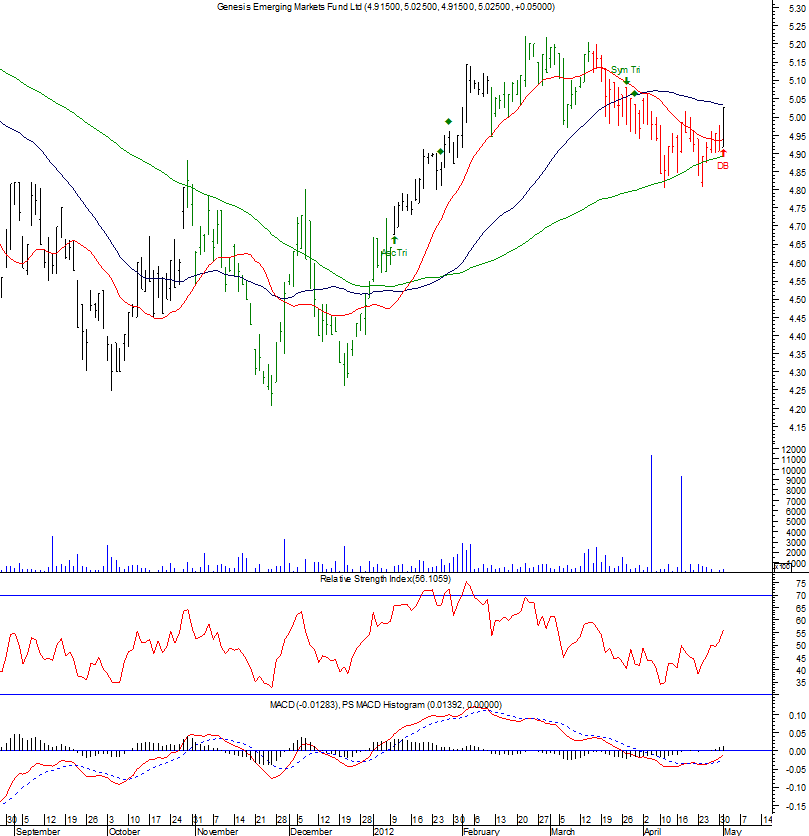
Here's a couple of investment trusts showing bullish chart formations.
A head and shoulders bottom on Blackrock World Mining Trust (BRWM)..
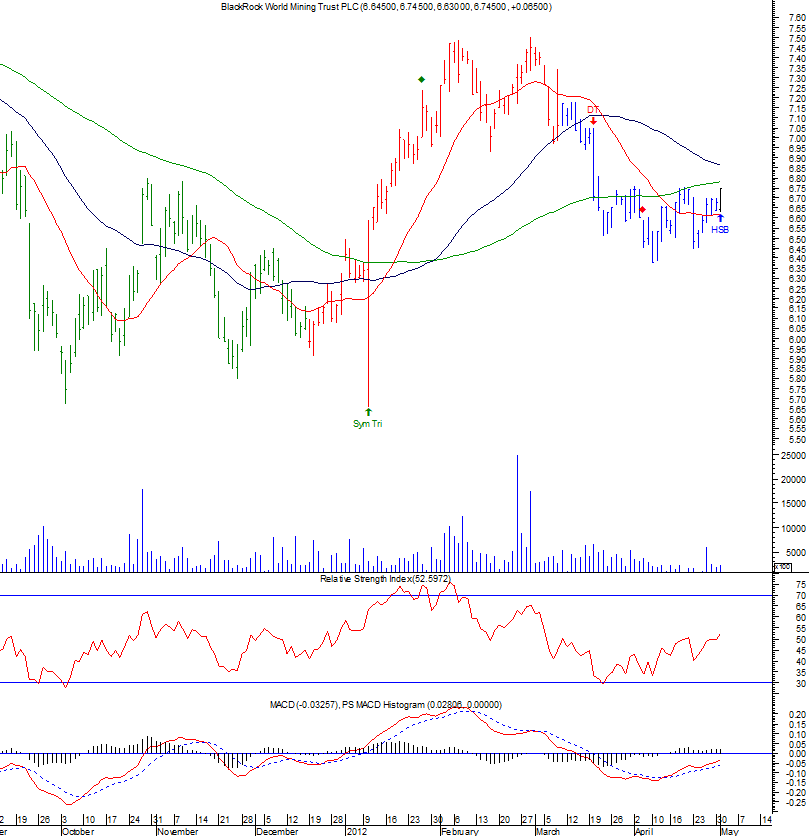
And a double bottom on Genesis Emerging Markets (GSS)
A head and shoulders bottom on Blackrock World Mining Trust (BRWM)..
And a double bottom on Genesis Emerging Markets (GSS)
skinny
- 02 May 2012 16:34
- 2494 of 3532
PSPI (post 2344) down another 10% today.
;MA(50);MA(100)&IND=RSI(14);MTM(6,6);VOLMA&Layout=2Line;Default;Price;HisDate&XCycle=&XFormat=)
goldfinger
- 02 May 2012 17:10
- 2495 of 3532
4 charts taken out of Bullish Trending Charts (might be a couple more tomorrow aswel.)
Trend upwards faltered.
They are....COB ALY IMG AIE
Been a real kull today for momentum stocks.
Trend upwards faltered.
They are....COB ALY IMG AIE
Been a real kull today for momentum stocks.
goldfinger
- 02 May 2012 17:11
- 2496 of 3532
New Bullish Trending Stocks and Bearish Trending Stocks to be updated early evening when data comes to hand.
goldfinger
- 03 May 2012 08:07
- 2497 of 3532
Been a technical glitch, should be OK later today.
Seymour Clearly
- 03 May 2012 09:41
- 2498 of 3532
DRX had a storming day yesterday. For those not on board might be a pullback soon, although the true chartists will want 580 cleared.

goldfinger
- 03 May 2012 14:28
- 2499 of 3532
sc drx GOOD DEFENSIVE PLAY.
goldfinger
- 03 May 2012 14:29
- 2500 of 3532
Sorry still problems with data feed.
goldfinger
- 03 May 2012 16:47
- 2501 of 3532
And similar. Quality here not quantity
KullyB - 04 May 2012 08:44 - 2502 of 3532
Morning gents, gone short IMT this am, not much on the indicator's side I could comment on but recently 2600 has proven a big resistance level and also going back historically seller's have stepped in at this level.
Combined with the downtrend on the Daily FTSE chart which started on 14/03/2012 I think a few more shorts go in the folio, have a gr8 bank holiday all.
KullyB

Combined with the downtrend on the Daily FTSE chart which started on 14/03/2012 I think a few more shorts go in the folio, have a gr8 bank holiday all.
KullyB
goldfinger
- 07 May 2012 01:57
- 2503 of 3532
Big week ahead after those elections...Helppppppppp
goldfinger
- 08 May 2012 08:44
- 2504 of 3532
Oppps.
goldfinger
- 08 May 2012 08:50
- 2505 of 3532
Got a couple of best sellers will try and find how u download them . Way of the Turtle and Come into my trading room.
Seymour Clearly
- 08 May 2012 10:12
- 2506 of 3532
GF, have sent you a pm.
goldfinger
- 08 May 2012 10:54
- 2507 of 3532
Havent got it yet SC was it today?.
goldfinger
- 08 May 2012 11:03
- 2508 of 3532
Still havent got it.
Seymour Clearly
- 08 May 2012 11:22
- 2509 of 3532
Sorry, bit busy, will send you a twitter message later when I get a mo if it hasn't come through. Will be lunchtime.
| About MoneyAM | Ts and Cs | Privacy Policy | Investment Warning | Content Standards | Corporate Solutions | Advertise With Us | Site Map | © 2026 MoneyAM |
Register now for FREE
Share Prices,
Stock Quotes,
Charts, Bulletin Boards, Indices, Watchlists, Portfolio, Market News, Research
or see our Premium Services including Level 2, Terminal and much more.