
| Home | Log In | Register | Our Services | My Account | Contact | Help |
You are NOT currently logged in
Register now or login to post to this thread.
CHART ATTACK - Longs and Shorts. (epic char) (CHAR)
goldfinger

 - 12 Jan 2010 20:42


A thread created for the TA of charts on the LSE markets. (aim and plus included)
Beginners and advanced wellcome. Long or short, just post your views and lets have some positive discussion. FIRE AWAY.
NB, UK indicies and sector charts can also to be included in posters analysis
Money am instructions for posting a chart..http://www.moneyam.com/help/?page=charts
My Twitter Platform, please feel free to visit me and post..http://twitter.com/#!/MickKipper
Kipper System 1 http://t.co/heOgs9b
nb, you may have to log in to get access to some of the links here. Every one is free.
RESOURCES
http://blog.tradersdaytrading.com/ http://stockcharts.com/school/doku.php?id=chart_school http://www.cantos.com/charts/masterclass http://www.onlinetradingconcepts.com/TechnicalAnalysis/ZigZag.html http://bigcharts.marketwatch.com/ http://www.stockmarket-coach.com/index.html http://www.trade2win.com/knowledge/equities/ http://www.financial-spread-betting.com/
CHART SCREENERS
http://www.iii.co.uk/spreadbetting/?type=technical http://www.barchart.com/lookup.php?field=name&search=contains&string=YELL&e=nf&type[]=2&type[]=1&type[]=5&type[]=9&type[]=10&type[]=4&type[]=CAN&type[]=LON&type[]=IND#results http://www.autochartist.com/ Nb, only free to IG Index Members. http://www.britishbulls.com/
BULLISH TRENDING CHARTS. Timeframe 3 Daily. Updates And Renewals Will Take Place On a regular basis.
MOMENTUM http://www.onlinetradingconcepts.com/TechnicalAnalysis/Momentum.html ADX http://stockcharts.com/school/doku.php?st=adx&id=chart_school:technical_indicators:average_directional_
;EMA(26);EMA(50);EMA(200)&IND=VOLMA(60);MTM(6,6);ADX(14)&Layout=2Line;Default;Price;HisDate&XCycle=&XFormat=)
;EMA(50);EMA(200)&IND=VOLMA(60);MTM(6,6);ADX(14)&Layout=2Line;Default;Price;HisDate&XCycle=&XFormat=)
;EMA(50);EMA(200)&IND=VOLMA(60);MTM(6,6);ADX(14)&Layout=2Line;Default;Price;HisDate&XCycle=&XFormat=)
;EMA(50);EMA(200)&IND=VOLMA(60);MTM(6,6);ADX(14)&Layout=2Line;Default;Price;HisDate&XCycle=&XFormat=)
;EMA(50);EMA(200)&IND=VOLMA(60);MTM(6,6);ADX(14)&Layout=2Line;Default;Price;HisDate&XCycle=&XFormat=)
;EMA(50);EMA(200)&IND=VOLMA(60);MTM(6,6);ADX(14)&Layout=2Line;Default;Price;HisDate&XCycle=&XFormat=)
;EMA(50);EMA(200)&IND=VOLMA(60);MTM(6,6);ADX(14)&Layout=2Line;Default;Price;HisDate&XCycle=&XFormat=)
;EMA(12);EMA(200)&IND=VOLMA(60);MTM(6,6);ADX(14)&Layout=2Line;Default;Price;HisDate&XCycle=&XFormat=)
;EMA(12);EMA(200)&IND=VOLMA(60);MTM(6,6);ADX(14)&Layout=2Line;Default;Price;HisDate&XCycle=&XFormat=)
;EMA(50);EMA(200)&IND=VOLMA(60);MTM(6,6);ADX(14)&Layout=2Line;Default;Price;HisDate&XCycle=&XFormat=)
;EMA(50);EMA(200)&IND=VOLMA(60);MTM(6,6);ADX(14)&Layout=2Line;Default;Price;HisDate&XCycle=&XFormat=)
;EMA(50);EMA(200)&IND=VOLMA(60);MTM(6,6);ADX(14)&Layout=2Line;Default;Price;HisDate&XCycle=&XFormat=)
;EMA(25);EMA(50);EMA(200)&IND=VOLMA(60);MTM(6,6);ADX(14)&Layout=2Line;Default;Price;HisDate&XCycle=&XFormat=)
;EMA(25);EMA(50);EMA(200)&IND=VOLMA(60);MTM(6,6);ADX(14)&Layout=2Line;Default;Price;HisDate&XCycle=&XFormat=)
;EMA(25);EMA(50);EMA(200)&IND=VOLMA(60);MTM(6,6);ADX(14)&Layout=2Line;Default;Price;HisDate&XCycle=&XFormat=)
;EMA(25);EMA(50);EMA(200)&IND=VOLMA(60);MTM(6,6);ADX(14)&Layout=2Line;Default;Price;HisDate&XCycle=&XFormat=)
;EMA(25);EMA(50);EMA(200)&IND=VOLMA(60);MTM(6,6);ADX(14)&Layout=2Line;Default;Price;HisDate&XCycle=&XFormat=)
;EMA(25);EMA(50);EMA(200)&IND=VOLMA(60);MTM(6,6);ADX(14)&Layout=2Line;Default;Price;HisDate&XCycle=&XFormat=)
;EMA(25);EMA(50);EMA(200)&IND=VOLMA(60);MTM(6,6);ADX(14)&Layout=2Line;Default;Price;HisDate&XCycle=&XFormat=)
;EMA(25);EMA(50);EMA(200)&IND=VOLMA(60);MTM(6,6);ADX(14)&Layout=2Line;Default;Price;HisDate&XCycle=&XFormat=)
;EMA(25);EMA(50);EMA(200)&IND=VOLMA(60);MTM(6,6);ADX(14)&Layout=2Line;Default;Price;HisDate&XCycle=&XFormat=)
;EMA(25);EMA(50);EMA(200)&IND=VOLMA(60);MTM(6,6);ADX(14)&Layout=2Line;Default;Price;HisDate&XCycle=&XFormat=)
;EMA(25);EMA(50);EMA(200)&IND=VOLMA(60);MTM(6,6);ADX(14)&Layout=2Line;Default;Price;HisDate&XCycle=&XFormat=)
;EMA(25);EMA(50);EMA(200)&IND=VOLMA(60);MTM(6,6);ADX(14)&Layout=2Line;Default;Price;HisDate&XCycle=&XFormat=)
;EMA(25);EMA(50);EMA(200)&IND=VOLMA(60);MTM(6,6);ADX(14)&Layout=2Line;Default;Price;HisDate&XCycle=&XFormat=)
;EMA(25);EMA(50);EMA(200)&IND=VOLMA(60);MTM(6,6);ADX(14)&Layout=2Line;Default;Price;HisDate&XCycle=&XFormat=)
;EMA(25);EMA(50);EMA(200)&IND=VOLMA(60);MTM(6,6);ADX(14)&Layout=2Line;Default;Price;HisDate&XCycle=&XFormat=)
 BEARISH TRENDING CHARTS Timeframe 3 Daily. Updates And Renewals Will Take Place On A Regular Basis.
BEARISH TRENDING CHARTS Timeframe 3 Daily. Updates And Renewals Will Take Place On A Regular Basis.
;EMA(50);EMA(200)&IND=VOLMA(60);MTM(6,6);ADX(14)&Layout=2Line;Default;Price;HisDate&XCycle=&XFormat=)
;EMA(50);EMA(200)&IND=VOLMA(60);MTM(6,6);ADX(14)&Layout=2Line;Default;Price;HisDate&XCycle=&XFormat=)
;EMA(25);EMA(50);EMA(200)&IND=VOLMA(60);MTM(6,6);ADX(14)&Layout=2Line;Default;Price;HisDate&XCycle=&XFormat=)
;EMA(50);EMA(200)&IND=VOLMA(60);MTM(6,6);ADX(14)&Layout=2Line;Default;Price;HisDate&XCycle=&XFormat=)
;EMA(25);EMA(50);EMA(200)&IND=VOLMA(60);MTM(6,6);ADX(14)&Layout=2Line;Default;Price;HisDate&XCycle=&XFormat=)
 12 WEEK HIGHS Timeframe 3 Daily. Updates And Renewals Will Take Place On A Regular Basis.
12 WEEK HIGHS Timeframe 3 Daily. Updates And Renewals Will Take Place On A Regular Basis.
;EMA(50);EMA(200)&IND=VOLMA(60);MTM(6,6);ADX(14)&Layout=2Line;Default;Price;HisDate&XCycle=&XFormat=)
;EMA(50);EMA(200)&IND=VOLMA(60);MTM(6,6);ADX(14)&Layout=2Line;Default;Price;HisDate&XCycle=&XFormat=)
;EMA(50);EMA(200)&IND=VOLMA(60);MTM(6,6);ADX(14)&Layout=2Line;Default;Price;HisDate&XCycle=&XFormat=)
;EMA(50);EMA(200)&IND=VOLMA(60);MTM(6,6);ADX(14)&Layout=2Line;Default;Price;HisDate&XCycle=&XFormat=)
;EMA(50);EMA(200)&IND=VOLMA(60);MTM(6,6);ADX(14)&Layout=2Line;Default;Price;HisDate&XCycle=&XFormat=)
;EMA(50);EMA(200)&IND=VOLMA(60);MTM(6,6);ADX(14)&Layout=2Line;Default;Price;HisDate&XCycle=&XFormat=)
;EMA(50);EMA(200)&IND=VOLMA(60);MTM(6,6);ADX(14)&Layout=2Line;Default;Price;HisDate&XCycle=&XFormat=)
;EMA(50);EMA(200)&IND=VOLMA(60);MTM(6,6);ADX(14)&Layout=2Line;Default;Price;HisDate&XCycle=&XFormat=)
;EMA(50);EMA(200)&IND=VOLMA(60);MTM(6,6);ADX(14)&Layout=2Line;Default;Price;HisDate&XCycle=&XFormat=)
;EMA(50);EMA(200)&IND=VOLMA(60);MTM(6,6);ADX(14)&Layout=2Line;Default;Price;HisDate&XCycle=&XFormat=)
;EMA(25);EMA(50);EMA(200)&IND=VOLMA(60);MTM(6,6);ADX(14)&Layout=2Line;Default;Price;HisDate&XCycle=&XFormat=)
;EMA(25);EMA(50);EMA(200)&IND=VOLMA(60);MTM(6,6);ADX(14)&Layout=2Line;Default;Price;HisDate&XCycle=&XFormat=)
;EMA(25);EMA(50);EMA(200)&IND=VOLMA(60);MTM(6,6);ADX(14)&Layout=2Line;Default;Price;HisDate&XCycle=&XFormat=)
;EMA(25);EMA(50);EMA(200)&IND=VOLMA(60);MTM(6,6);ADX(14)&Layout=2Line;Default;Price;HisDate&XCycle=&XFormat=)
 <
< ;EMA(25);EMA(50);EMA(200)&IND=VOLMA(60);MTM(6,6);ADX(14)&Layout=2Line;Default;Price;HisDate&XCycle=&XFormat=)
;EMA(25);EMA(50);EMA(200)&IND=VOLMA(60);MTM(6,6);ADX(14)&Layout=2Line;Default;Price;HisDate&XCycle=&XFormat=)
;EMA(25);EMA(50);EMA(200)&IND=VOLMA(60);MTM(6,6);ADX(14)&Layout=2Line;Default;Price;HisDate&XCycle=&XFormat=)
;EMA(25);EMA(50);EMA(200)&IND=VOLMA(60);MTM(6,6);ADX(14)&Layout=2Line;Default;Price;HisDate&XCycle=&XFormat=)
;EMA(25);EMA(50);EMA(200)&IND=VOLMA(60);MTM(6,6);ADX(14)&Layout=2Line;Default;Price;HisDate&XCycle=&XFormat=)
;EMA(25);EMA(50);EMA(200)&IND=VOLMA(60);MTM(6,6);ADX(14)&Layout=2Line;Default;Price;HisDate&XCycle=&XFormat=)
;EMA(25);EMA(50);EMA(200)&IND=VOLMA(60);MTM(6,6);ADX(14)&Layout=2Line;Default;Price;HisDate&XCycle=&XFormat=)
;EMA(25);EMA(50);EMA(200)&IND=VOLMA(60);MTM(6,6);ADX(14)&Layout=2Line;Default;Price;HisDate&XCycle=&XFormat=)
;EMA(25);EMA(50);EMA(200)&IND=VOLMA(60);MTM(6,6);ADX(14)&Layout=2Line;Default;Price;HisDate&XCycle=&XFormat=)
;EMA(25);EMA(50);EMA(200)&IND=VOLMA(60);MTM(6,6);ADX(14)&Layout=2Line;Default;Price;HisDate&XCycle=&XFormat=)
Beginners and advanced wellcome. Long or short, just post your views and lets have some positive discussion. FIRE AWAY.
NB, UK indicies and sector charts can also to be included in posters analysis
Money am instructions for posting a chart..http://www.moneyam.com/help/?page=charts
My Twitter Platform, please feel free to visit me and post..http://twitter.com/#!/MickKipper
Kipper System 1 http://t.co/heOgs9b
nb, you may have to log in to get access to some of the links here. Every one is free.
RESOURCES
http://blog.tradersdaytrading.com/ http://stockcharts.com/school/doku.php?id=chart_school http://www.cantos.com/charts/masterclass http://www.onlinetradingconcepts.com/TechnicalAnalysis/ZigZag.html http://bigcharts.marketwatch.com/ http://www.stockmarket-coach.com/index.html http://www.trade2win.com/knowledge/equities/ http://www.financial-spread-betting.com/
CHART SCREENERS
http://www.iii.co.uk/spreadbetting/?type=technical http://www.barchart.com/lookup.php?field=name&search=contains&string=YELL&e=nf&type[]=2&type[]=1&type[]=5&type[]=9&type[]=10&type[]=4&type[]=CAN&type[]=LON&type[]=IND#results http://www.autochartist.com/ Nb, only free to IG Index Members. http://www.britishbulls.com/
BULLISH TRENDING CHARTS. Timeframe 3 Daily. Updates And Renewals Will Take Place On a regular basis.
MOMENTUM http://www.onlinetradingconcepts.com/TechnicalAnalysis/Momentum.html ADX http://stockcharts.com/school/doku.php?st=adx&id=chart_school:technical_indicators:average_directional_
skinny
- 09 Aug 2010 17:15
- 350 of 3532
Anyone for @5500

ptholden
- 09 Aug 2010 19:43
- 351 of 3532
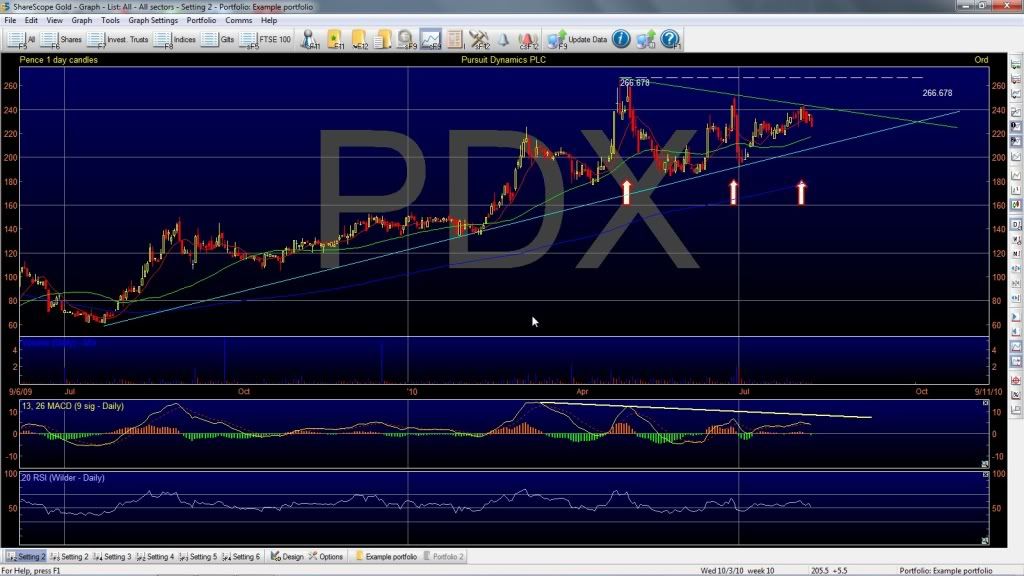
Here's an old fave, ye olde dog PDX.
Since the dark days of 60p, the SP has managed to scale the heights of 270p, but the company has still to turn a profit. Since the high during May the SP has been in a slow but steady decline and has now made three consecutive lower highs (indicated by the arrows). Additionally, a reasonably solid downtread is acting as firm resistance and in conjunction with the horizonatal resistance offers a good idea where to place stops if short. Alternatively a push through may signal a continuation of the uptrend.
goldfinger
- 09 Aug 2010 21:14
- 352 of 3532
Yep PTH...... class coming out now.
Its been coming up on my screener for a month or so...........PDX.
Its been coming up on my screener for a month or so...........PDX.
jonuk76
- 11 Aug 2010 17:28
- 353 of 3532

goldfinger
- 14 Aug 2010 20:31
- 354 of 3532
IPO IP Group
Chart looks like its presenting a buying opportunity.
Fundies look good going into 2011 aswell..
IP Group Forecasts
Year Ending Revenue (m) Pre-tax (m) EPS P/E PEG EPS Grth. Div Yield
31-Dec-10 12.40 5.20 2.03p 15.5 n/a n/a n/a 0.0%
31-Dec-11 18.50 10.25 4.01p 7.9 0.1 +97% n/a 0.0%
3 year chart

1 year chart

Chart looks like its presenting a buying opportunity.
Fundies look good going into 2011 aswell..
IP Group Forecasts
Year Ending Revenue (m) Pre-tax (m) EPS P/E PEG EPS Grth. Div Yield
31-Dec-10 12.40 5.20 2.03p 15.5 n/a n/a n/a 0.0%
31-Dec-11 18.50 10.25 4.01p 7.9 0.1 +97% n/a 0.0%
3 year chart
1 year chart
Master RSI - 16 Aug 2010 11:56 - 355 of 3532
PHTM
On a higher BREAKOUT as it goes over the Intraday high last December

On a higher BREAKOUT as it goes over the Intraday high last December
Master RSI - 17 Aug 2010 09:25 - 356 of 3532
BREAKOUT
COV
Lots of volume this morning, with just over 1 hour trading

COV
Lots of volume this morning, with just over 1 hour trading
Seymour Clearly
- 17 Aug 2010 15:37
- 357 of 3532
Chanced my arm again today :-)

cynic
- 17 Aug 2010 17:40
- 358 of 3532
mrsi - sorry to see you called COV all wrong .... no idea what spooked it, other than just suckers being suckered i guess
ptholden
- 17 Aug 2010 18:54
- 359 of 3532
PDX got within touching distance of trendline support and today bounced (downwards) off trendline resistance. Where to next? Convention would dictate onwards and upwards......hmm (will post the chart later)
jonuk76
- 18 Aug 2010 00:27
- 360 of 3532
Drax Group is now above its 200 day moving average for the first time since late 2008. Maybe a continuation of the move upwards that started in June? Volume is not fantastic, but otherwise it looks fairly positive to me.

skinny
- 19 Aug 2010 09:27
- 361 of 3532
420 interesting area for TATE.

Seymour Clearly
- 19 Aug 2010 12:15
- 362 of 3532
Mentioned in last w/e's FT as a low risk prospect. I'll have a look tonight and try and post the info.

skinny
- 24 Aug 2010 17:20
- 363 of 3532
Its a big gap to 4!

jonuk76
- 09 Sep 2010 11:51
- 364 of 3532
After a period of doing nothing JII looks like it might be on the move again, hopefully!
;EMA(40)&IND=VOLMA(60);ADX(14)&Layout=2Line;Default;Price;HisDate&XCycle=&XFormat=)
goldfinger
- 12 Sep 2010 17:32
- 365 of 3532
Anyone fancy a spreadbet long on this one.... 290p SP target. looks like it could have a good chance having been there 4 times before

goldfinger
- 16 Sep 2010 16:41
- 366 of 3532
French Connection Seems to have a lot going for it at the moment.
Retailers outperforming and company recovering

Retailers outperforming and company recovering
goldfinger
- 16 Sep 2010 21:34
- 367 of 3532
Lifted from across the road........
Investtech the Pro TA providers to Banks and Institutions like it.......

Positive Candidate -Medium term, Sep 16, 2010 Analysis Explanation
FRENCH CONNECTION GROUP is within a rising trend, which indicates a continued growth. Has given positive signal from a inverse head and shoulders formation by a break up through the resistance at 45.64. Further rise to 86.62 or more is signaled. The stock has broken up through the resistance at pence 47.00. This predicts a further rise. In case of negative reactions, there will now be support at pence 47.00. Positive volume balance, i.e. high volume in days of rising prices and low volume in days of falling prices, strengthens the stock in the short term. The RSI curve shows a rising trend, which supports the positive trend. The stock is overall assessed as technically positive for the medium long term.
Period Vol.bal. Volatility Liquidity +/- %
1 day - 3.02% 133.04 +5.85%
5 days 85.63 9.66% 34.31 +11.17%
22 days 58.13 26.55% 10.57 +1.53%
66 days 32.09 52.83% 19.52 +18.45%
Investtech the Pro TA providers to Banks and Institutions like it.......
Positive Candidate -Medium term, Sep 16, 2010 Analysis Explanation
FRENCH CONNECTION GROUP is within a rising trend, which indicates a continued growth. Has given positive signal from a inverse head and shoulders formation by a break up through the resistance at 45.64. Further rise to 86.62 or more is signaled. The stock has broken up through the resistance at pence 47.00. This predicts a further rise. In case of negative reactions, there will now be support at pence 47.00. Positive volume balance, i.e. high volume in days of rising prices and low volume in days of falling prices, strengthens the stock in the short term. The RSI curve shows a rising trend, which supports the positive trend. The stock is overall assessed as technically positive for the medium long term.
Period Vol.bal. Volatility Liquidity +/- %
1 day - 3.02% 133.04 +5.85%
5 days 85.63 9.66% 34.31 +11.17%
22 days 58.13 26.55% 10.57 +1.53%
66 days 32.09 52.83% 19.52 +18.45%
splat
- 17 Sep 2010 11:56
- 368 of 3532
thanks for bringing this to my attention Goldy, in @ 53 today.
goldfinger
- 17 Sep 2010 14:25
- 369 of 3532
Well done, should have made a few bob.
| About MoneyAM | Ts and Cs | Privacy Policy | Investment Warning | Content Standards | Corporate Solutions | Advertise With Us | Site Map | © 2026 MoneyAM |
Register now for FREE
Share Prices,
Stock Quotes,
Charts, Bulletin Boards, Indices, Watchlists, Portfolio, Market News, Research
or see our Premium Services including Level 2, Terminal and much more.