
| Home | Log In | Register | Our Services | My Account | Contact | Help |
You are NOT currently logged in
Register now or login to post to this thread.
CHART ATTACK 2 - Longs And Shorts, Stocks, Indicies, FX. (CHAR)
goldfinger

 - 19 Mar 2013 13:57


A thread created for the TA of charts on the LSE markets. (aim and plus included)
Beginners and advanced wellcome. Long or short, just post your views and lets
have some positive discussion. FIRE AWAY.
NB, UK indicies and sector charts plus FX can also to be included in posters analysis.
Money am instructions for posting a chart..http://www.moneyam.com/help/?page=charts
Kipper System 1 http://t.co/heOgs9b
nb, you may have to log in to get access to some of the links here below. Every one is free.
DAILY MORNING CHARLES STANLEY Traders Bulletin
http://www.charles-stanley.co.uk/traders-bulletin
Central Research Morning Report,
http://t.co/BTw64ZxW5e
RESOURCES
http://blog.tradersdaytrading.com/
http://stockcharts.com/school/doku.php?id=chart_school
http://www.cantos.com/masterclass
http://www.onlinetradingconcepts.com/TechnicalAnalysis/ZigZag.html
http://bigcharts.marketwatch.com/http://www.stockmarket-coach.com/index.html
http://www.trade2win.com/knowledge/equities/
http://www.babypips.com/school
CHART SCREENERS
http://www.iii.co.uk/spreadbetting/type=technical
http://www.barchart.com
http://www.autochartist.com/
http://www.britishbulls.com/
skinny
- 01 Jul 2014 06:03
- 1981 of 2763
jimmy b
- 01 Jul 2014 08:14
- 1982 of 2763
Thanks skinny ..
ExecLine
 - 01 Jul 2014 09:46
- 1983 of 2763
- 01 Jul 2014 09:46
- 1983 of 2763

Will it or won't it? 6 month chart shows this best.

skinny
- 01 Jul 2014 09:50
- 1984 of 2763
12 month low is 278.50p
ExecLine
- 01 Jul 2014 11:07
- 1985 of 2763
I'm 'doing a Croc' and watching and learning about Level 2 on RGS.
eg.
The idea is to make only three sections appear on each side. Two or four sections (or even more) mean you need to correct the filter.
Set the filter at 0.8 on both sides then see what happens.
As the first three sections fill and overflow or underflow, see how you need to change the filter setting so as to reset one side or the other to keep showing ONLY three sections of Buy and Sell prices.
As I type, BOs are set at 0.6% and SOs at 0.8% to maintain three section balance and the robots have quietened down quite a bit from previous high activity this morning.
Sometimes the settings are very wide apart, say 4.0% - 0.5%. This is when you can tell which way the market is being directed and place trading orders accordingly.
Have a play around yourself.
Time for a coffee.
PS. Anyone got any interesting links on this subject?
ExecLine
- 01 Jul 2014 13:24
- 1986 of 2763
Year end was 30 June and growth is expected to continue along current lines for this well run and very ambitious company. If you like this sort of thing, here's an interesting YouTube clip:
Oversold of late I suspect, and now on the way back up to 350p (and beyond?).

Oversold of late I suspect, and now on the way back up to 350p (and beyond?).
ExecLine
- 01 Jul 2014 13:59
- 1987 of 2763
Wandisco 'WAND' is now also on the move back up:

goldfinger
- 07 Jul 2014 12:12
- 1988 of 2763
Right thats me out of the market for 6 weeks or so unless we get beyond 6900 on the ftse 100.
From a fundies point of view stocks look expensive.......
FTSE 100 has an average P/E ratio of 14.2, and the FTSE 250 has an average P/E ratio of 19.4.
Probably far better prospects come mid september.
Might go in if I see extreme value.
goldfinger
- 18 Jul 2014 10:34
- 1989 of 2763
On the daily FTSE 100 it looks to me like we have a target of approx 6550 the base of the uptrend channel. I might come back into the market if that develops before September.

goldfinger
- 23 Jul 2014 09:55
- 1990 of 2763
Long on ARM yesterday, long here this morning............

AND 1 year chart........

AND 1 year chart........
skinny
- 23 Jul 2014 14:31
- 1991 of 2763
I don't follow these, but a gap below and above at the current price.
;MA(50);MA(200)&IND=MACD(26,12,9);RSI(14);VOLMA(60)&Layout=2Line;Default;Price;HisDate&XCycle=&XFormat=)
goldfinger
- 23 Jul 2014 14:36
- 1992 of 2763
High volume today aswel.
skinny
- 23 Jul 2014 14:42
- 1993 of 2763
Results today.
goldfinger
- 23 Jul 2014 18:57
- 1994 of 2763
Testing, testing.......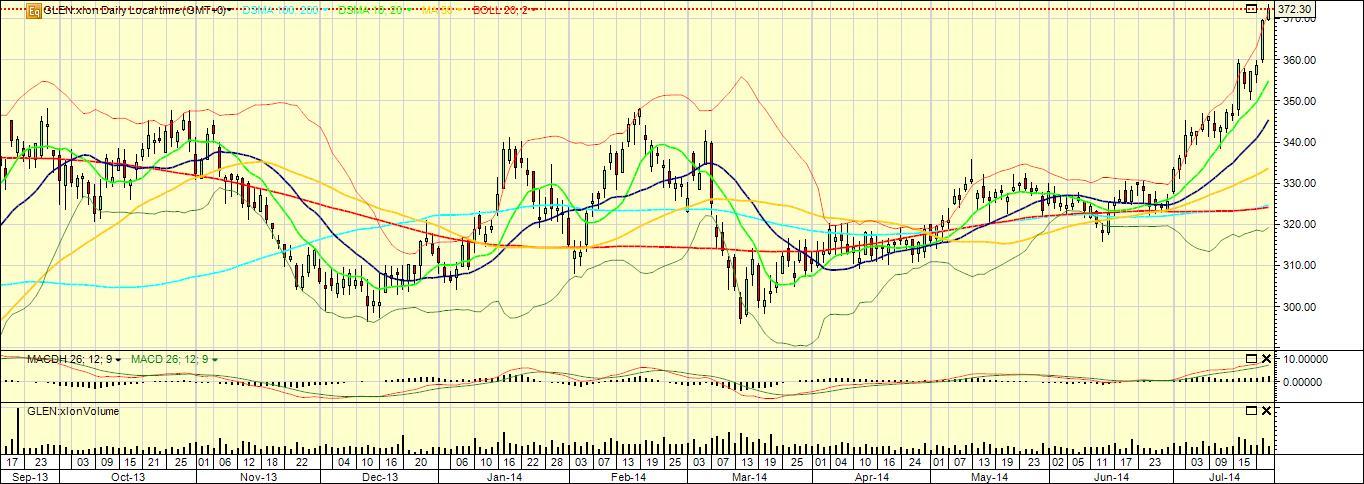
goldfinger
- 23 Jul 2014 18:59
- 1995 of 2763
hmmmmm this new system works.......Yipes.
goldfinger
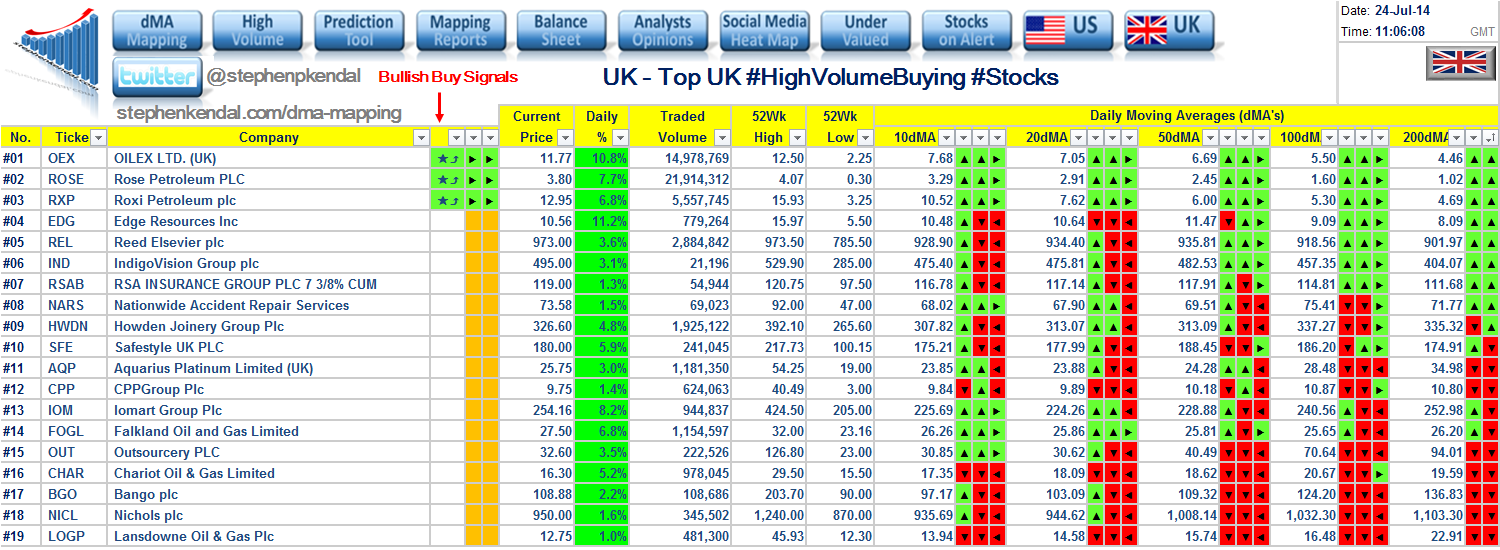
- 24 Jul 2014 14:28
- 1996 of 2763
Interesting. Forward indictors price volume and moving average.
skinny
- 24 Jul 2014 14:34
- 1997 of 2763
skinny
- 28 Jul 2014 11:47
- 1998 of 2763
I've gone long on HSBA this morning.
;MA(50);MA(200)&IND=MACD(26,12,9);RSI(14)&Layout=2Line;Default;Price;HisDate&XCycle=&XFormat=)
goldfinger
- 28 Jul 2014 14:29
- 1999 of 2763
Recovering from a triple bottom. Through the downward trend line aswel. Interesting.
skinny
- 29 Jul 2014 09:34
- 2000 of 2763
Another of those 'boring yielders (4.98%)'.
;MA(50);MA(200)&IND=MACD(26,12,9);RSI(14)&Layout=2Line;Default;Price;HisDate&XCycle=&XFormat=)
| About MoneyAM | Ts and Cs | Privacy Policy | Investment Warning | Content Standards | Corporate Solutions | Advertise With Us | Site Map | © 2026 MoneyAM |
Register now for FREE
Share Prices,
Stock Quotes,
Charts, Bulletin Boards, Indices, Watchlists, Portfolio, Market News, Research
or see our Premium Services including Level 2, Terminal and much more.