
| Home | Log In | Register | Our Services | My Account | Contact | Help |
You are NOT currently logged in
Davai - 18 Apr 2012 11:13


Thread designed to record set-ups and targets on index and FX pairs.
'A market is only your enemy until you understand it, then it becomes your best friend.'
Any questions, please feel free to ask.
From time to time i may openly state an opinion regarding direction of a set-up and wish to add that in no way am i recommending a trade. I am sometimes only in trades for a matter of minutes and can't always update as to entry/exits taken.
As always, markets are dangerous places to be and must be respected as such. Always use stop losses and never over-leverage; 3% of your pot as a maximum per trade. As always, YOU are responsible for your own trades! Happy pip hunting!
Click HERE to visit me at FXtechnicals.net
Davai - 25 Apr 2012 10:07 - 43 of 423
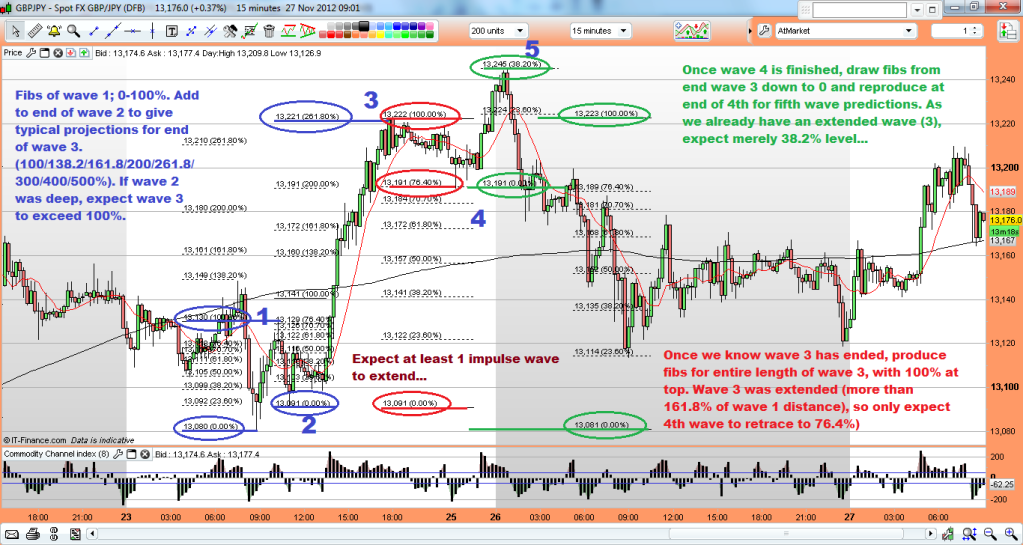
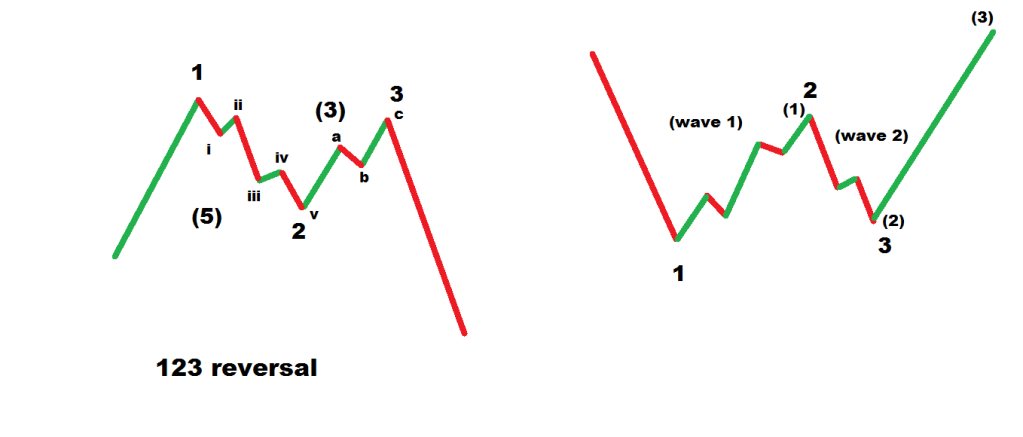
Ok, so without trying to label every last minuette subwave, this is how it looks. It's obvious to me that extended 5th waves occur frequently during corrective cycles, so point learnt. I have shown this in the following chart. I was right to expect a HH as per post 41, but didn't realise we were printing a larger (and somewhat out of proportion, it has to be said) 4th, (red circle)... Whilst looking for an end to the 5th, i look out for what is essentially a 123 reversal. As explained before, it is basically waves 1&2 of the next move, (blue circle)... the 123 is numbered 5,1&2 in that order, within the blue circle. Entry is upon break of point 2 and stop a pip above point 3... I went short earlier @ 13,120 using this popular reversal pattern, the poor GDP data sped things up a tad!


Davai - 25 Apr 2012 10:22 - 44 of 423
So back to post 39 when i posted this;

and now you can see how i first have a plan to work to and then scale down to follow PA in more detail. The updated chart (overall plan);

so far, so good...

and now you can see how i first have a plan to work to and then scale down to follow PA in more detail. The updated chart (overall plan);

so far, so good...
Davai - 25 Apr 2012 14:47 - 45 of 423
Update to trade and i think the markets done me a beauty. Originally banked a whack from the sharp drop this morning, but a bit of ill-discipline later and i find myself shorting free-style within what i presumed was a 4th wave, feeling safe in the knowledge a 5th wave and LL (lower low) was to come. Except, it took me far too long to accept or realise that the move wasn't flat enough. Pullback of '2' was quite sharp as per last chart, so '4' should be flat. Looking at the following chart, we have what i believe was a short 4th, (now shown as 'iv') with the 5th ('v') ending exactly to the tenth of a pip level with '3' ('iii'). This means back in 3 waves corrective for an ABC to form a much larger 1&2... I decided to close out giving back a large chunk of what i had gained earlier!... follow me so far?!
The chart;

I could have raised my stops, but would rather let it play out and look for more confirmation instead. I'm watching two fib retracement levels (orange and red) for a bounce, (the orange 61.8% being favourable as it should be a resistance turned support level). We then go back to looking for another 123 reversal pattern to form subwaves 1&2 of the 3rd. If correct a much larger drop should ensue. lets see...
Davai - 25 Apr 2012 15:13 - 46 of 423
The bigger picture of above;


Davai - 25 Apr 2012 16:06 - 47 of 423
Right now, its a case of waiting to see how it pans out. Next requirement is a clear 123 which will be subwaves 'i' & 'ii' of the 3rd, if my reading is still correct. I want to see a fairly clear 5 & 3 structure within it and then the trigger will be a break of wave 'i', (or point 2 as a 123);

Davai - 25 Apr 2012 18:05 - 48 of 423
Wouldn't surprise me at all if it reverses between the blue lines;


Davai - 25 Apr 2012 20:11 - 49 of 423
Could be time to get excited soon with cable. Just a case now of working out where the current rise will end (if it hasn't already) and we could be good for a very rapid descent...


Davai - 25 Apr 2012 20:44 - 50 of 423
Just getting the impression that there is a big rush on to complete some wave counts. Cable has (so far) only made a HH for its final 'C' wave of the corrective move, over point 'A' by a mere 16 pips. You may be scratching your head as to why its higher now than when the dire GDP data came out earlier showing we are back in a recession! That is your answer! It has to complete its obligations. Looking for 123 reversals and need a small one which will be subwaves 'i'&'ii' of a larger 1&2. I may even try to get a decent swing trade on the go to run alongside my system trades.
Davai - 25 Apr 2012 21:44 - 51 of 423


Davai - 25 Apr 2012 23:18 - 52 of 423
Maybe a bit further to go yet?


Davai - 25 Apr 2012 23:32 - 53 of 423
Maybe another good indicator for a reversal; target met, although it might have a little further push for a HH by a handful of points yet if my workings are correct, still more than likely today has been an 'A' and 'B' correction with a down day tomorrow...


Davai - 26 Apr 2012 09:16 - 54 of 423
Possible plan;


Davai - 26 Apr 2012 09:31 - 55 of 423
In more detail, (but still very speculative);


Davai - 26 Apr 2012 17:29 - 56 of 423
I should have shown 'C' as 5 waves, thus a triple 3, (11 moves). I'm currently trying to determine if according to the rules, 'x' is allowed to breach a 'b' within the cycle. If not and you get your counts right, it would make for an absolutely fantastic high probability/low risk trade right now. If the minor 'c' of the final 'x' wave has to make a HH over minor 'a', but can't breach the previous 'x', (between the blue lines), we can short there knowing there is one more abc to come and put our stop merely a dozen or so points above, (a pip above 'b'). Target is around the previous low of 'A' as this is a flat corrective. Watching;


Davai - 26 Apr 2012 20:36 - 57 of 423
Couple of things making me wonder if we are about to head down sharply;


Chris Carson

 - 26 Apr 2012 21:50
- 58 of 423
- 26 Apr 2012 21:50
- 58 of 423


Davai - I like this chart better, I am no technical analyst (no shit I hear you say :O) but if, a very big if, volume was to increase dramatically isn't it just possible Dow could go higher to close to 5yr highs? I'm not trading it to find out scares the shxt out of me.
Chris Carson
- 26 Apr 2012 21:56
- 59 of 423
Chris Carson
- 26 Apr 2012 21:56
- 60 of 423
Davai - 26 Apr 2012 22:24 - 61 of 423
Chris, in short, i am expecting higher to come this summer, but probably not a fresh high over 2007 level. This whole move since October 2007 is corrective and we still have a final leg up before it completes the 'B' wave, (well, my reckoning anyway), there are a couple of different ways to label it, but it might see us well into late summer/autumn, hell, even into 2013 before the death spiral of wave 'C' back down to new lows...
Right now, my thinking is that we are in a complex corrective wave, of which A is finished and to repost my chart from earlier (below) i actually think tonight sees us end wave B too. That leaves us free to weave our way back down to a new low (12,700 area) before starting a more orderly climb back up.
Of course these are just my own workings and thus an opinion.
Chris Carson
- 26 Apr 2012 22:28
- 62 of 423
Thanks for that Davai, interesting.
| About MoneyAM | Ts and Cs | Privacy Policy | Investment Warning | Content Standards | Corporate Solutions | Advertise With Us | Site Map | © 2026 MoneyAM |
Register now for FREE
Share Prices,
Stock Quotes,
Charts, Bulletin Boards, Indices, Watchlists, Portfolio, Market News, Research
or see our Premium Services including Level 2, Terminal and much more.