
| Home | Log In | Register | Our Services | My Account | Contact | Help |
You are NOT currently logged in
Davai - 18 Apr 2012 11:13


Thread designed to record set-ups and targets on index and FX pairs.
'A market is only your enemy until you understand it, then it becomes your best friend.'
Any questions, please feel free to ask.
From time to time i may openly state an opinion regarding direction of a set-up and wish to add that in no way am i recommending a trade. I am sometimes only in trades for a matter of minutes and can't always update as to entry/exits taken.
As always, markets are dangerous places to be and must be respected as such. Always use stop losses and never over-leverage; 3% of your pot as a maximum per trade. As always, YOU are responsible for your own trades! Happy pip hunting!
Click HERE to visit me at FXtechnicals.net
Davai - 26 Apr 2012 20:36 - 57 of 423
Couple of things making me wonder if we are about to head down sharply;


Chris Carson

 - 26 Apr 2012 21:50
- 58 of 423
- 26 Apr 2012 21:50
- 58 of 423


Davai - I like this chart better, I am no technical analyst (no shit I hear you say :O) but if, a very big if, volume was to increase dramatically isn't it just possible Dow could go higher to close to 5yr highs? I'm not trading it to find out scares the shxt out of me.
Chris Carson
- 26 Apr 2012 21:56
- 59 of 423
Chris Carson
- 26 Apr 2012 21:56
- 60 of 423
Davai - 26 Apr 2012 22:24 - 61 of 423
Chris, in short, i am expecting higher to come this summer, but probably not a fresh high over 2007 level. This whole move since October 2007 is corrective and we still have a final leg up before it completes the 'B' wave, (well, my reckoning anyway), there are a couple of different ways to label it, but it might see us well into late summer/autumn, hell, even into 2013 before the death spiral of wave 'C' back down to new lows...
Right now, my thinking is that we are in a complex corrective wave, of which A is finished and to repost my chart from earlier (below) i actually think tonight sees us end wave B too. That leaves us free to weave our way back down to a new low (12,700 area) before starting a more orderly climb back up.
Of course these are just my own workings and thus an opinion.
Chris Carson
- 26 Apr 2012 22:28
- 62 of 423
Thanks for that Davai, interesting.
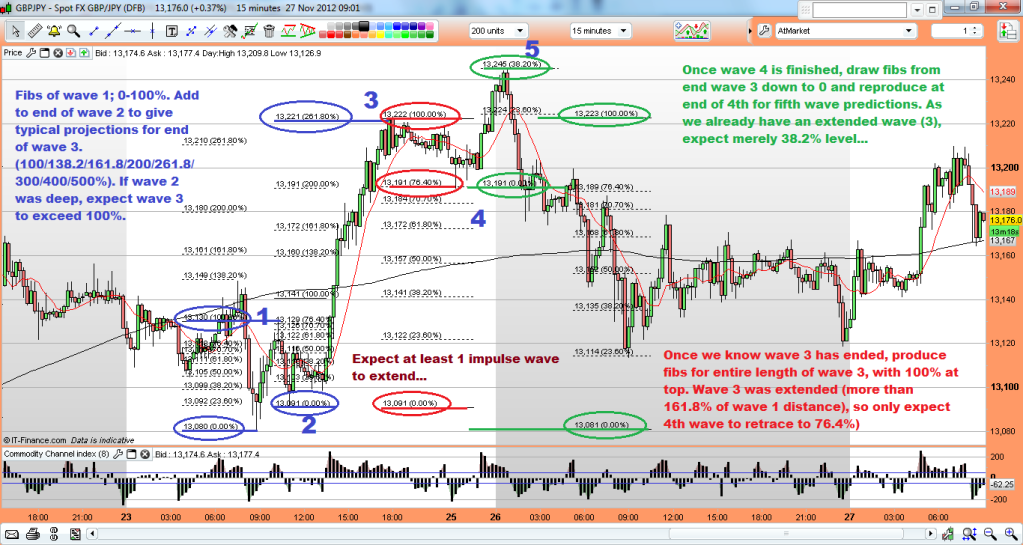
Davai - 27 Apr 2012 09:12 - 63 of 423
Back to post 56 now;
Davai - 26 Apr 2012 17:29 - 56 of 62 edit this post
'I should have shown 'C' as 5 waves, thus a triple 3, (11 moves). I'm currently trying to determine if according to the rules, 'x' is allowed to breach a 'b' within the cycle.'
'Target is around the previous low of 'A' as this is a flat corrective. Watching;'

-----------------------------
Ok learnt a couple of things. The market mixes it up enough to make it difficult to label the moves for certain before they are completed, therefore better to keep your stop above either the last known 'X' or better still a pip above point 'B'
I'm happy with the way i've labeled the following chart and it says to me that 'X' can breach the previous 'b', but obviously not the previous 'X'
If you strip all the workings down, then the important part was this,
'Target is around the previous low of 'A' as this is a flat corrective.' ('A' being the low to the left of the chart)
So, with your stop above point 'B' (after the abcde wave) we had a target of approx point 'A' because we had determined this was a flat corrective move.
Some overnight news caused some very rapid movements, but the second chart shows in detail the last abc move to print the target req'd;


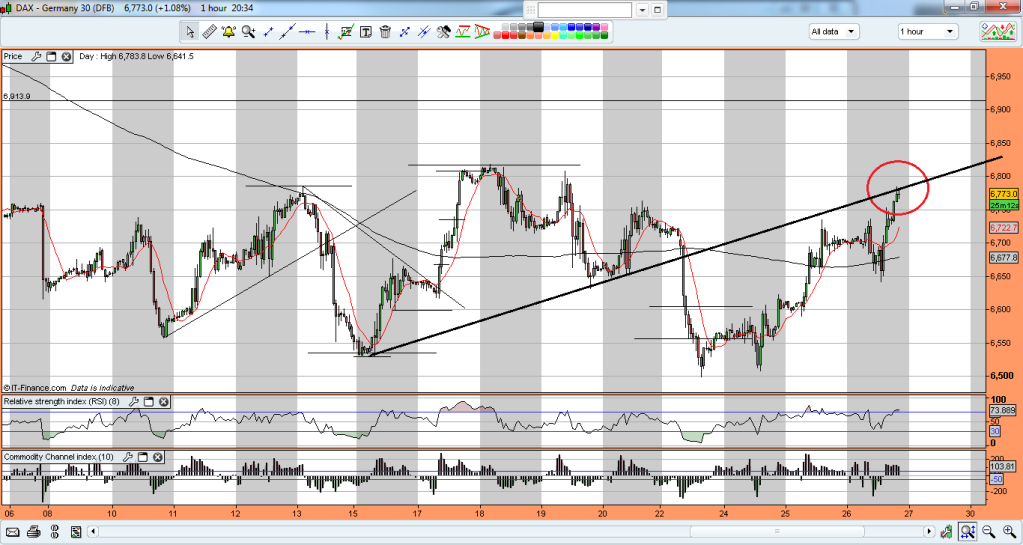
Davai - 27 Apr 2012 15:24 - 64 of 423
The Dow made a HH this morning and thus invalidated the possible set-up that i mentioned last night. The pullback was actually abc corrective (label ('iii'),('iv') & ('v') as a,b & c respectively. Here is a chart as to what would have been a great set-up. Its this kind of thing that i look for constantly. The primary 123 can be traded in its own right, but they occur quite frequently and don't always give the points, so i prefer to use them as a 'heads up' of a larger 1&2 (secondary 123). Entry is the break of point 2 (by a full pip), stop above point 1, (or 3 aggressively and only if the pullback was deep)

Anyway, moving on, we may still be a whisker away from an intermediate top; possibility for the Dax. Last nights short off of the line gave a good hundred pips plus, but was a likely abc 4th wave instead, therefore we might have the scenario in the bottom two charts;
last night;
this morning;

and how i view it right now;

wave 'B' in close up;
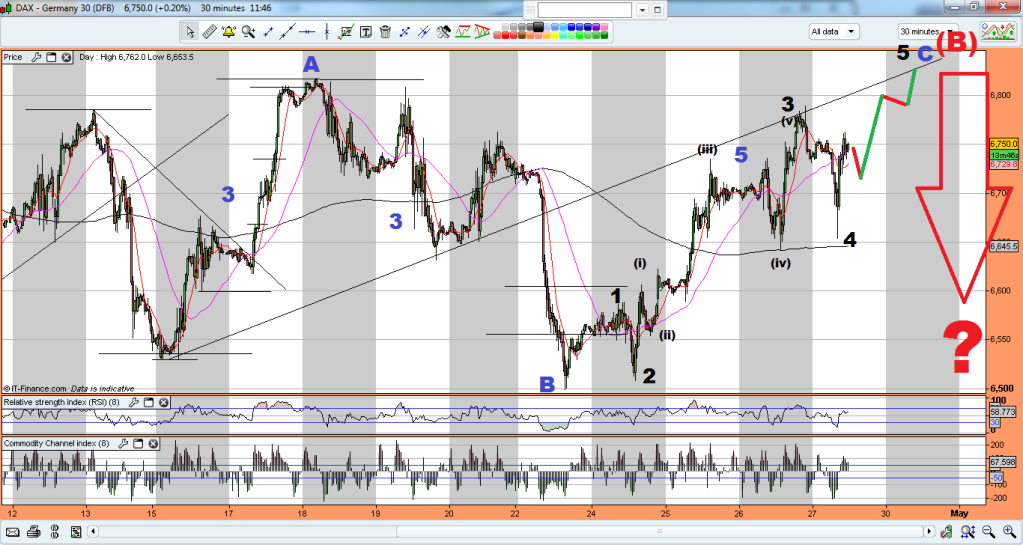

Davai - 27 Apr 2012 19:48 - 65 of 423
Something was bugging me earlier. The GbpJpy usually correlates to the markets and as my charts suggest, i reckon there is a good blast north around the corner. However, i have also posted i expect the markets to tank shortly. Well, its possible we will have a couple more days or so yet and end up with an irregular correction on the Dow, ('B' wave making a fresh high), with 'C' a slightly LL and probably a flat for the £/yen. All three that i watch correlate closely together with this particular count which involves the Dax and the Dow reaching a 1.62 fib extension of their 'a' of the 'B' wave.
Here's all three charts;
(as prev posted), £/yen;

the Dow plan;

and the Dax;

all three give us probably into the middle of the week for more gains before a major turn, with the £/yen in particular looking good for some great gains. Well, its only analysis at this stage, but at least with a plan i can now look on smaller timescales to see if it works out and of course trade it accordingly.
Davai - 27 Apr 2012 20:49 - 66 of 423
Chris, i reckon you stand a very good chance of winning the M&S vouchers this month mate!
Chris Carson
- 27 Apr 2012 21:04
- 67 of 423
Well it would be a first Davai, I'll believe it when I see it mate :O)
As regards Monday never mind next month I haven't got a clue where the indeces are going. To be honest just wish it would stop bloody raining so I could play some golf. Good luck with your trading.
As regards Monday never mind next month I haven't got a clue where the indeces are going. To be honest just wish it would stop bloody raining so I could play some golf. Good luck with your trading.
Davai - 27 Apr 2012 21:28 - 68 of 423
Just got a feeling it might add 30 odd points on Monday, but lets see! Have a good weekend!
Davai - 30 Apr 2012 18:43 - 69 of 423
So, bit surprised by todays moves, still biased for upside soon and am wondering if its looking for the 1.62% level of 'a' for the target. Decisive break of this and its a completely different count entirely, with another fib level at 12890 being the 61.8% retrace of the recent move up. As it is, its just back to how i envisaged it last week;

last week;

last week;
Davai - 30 Apr 2012 19:22 - 70 of 423
So, the alternative count. Although i would even consider this a more natural looking corrective move, (retracing 50/61.8% of wave 1) for wave 2, i struggle to accept the final part ('c') of the 'B' wave being the recent 'abcde' expanding triangle move, (although it is in 5 waves). It also appears massively out of symmetry. So i will try to see if its possible/likely,


Davai - 01 May 2012 16:03 - 71 of 423
Ok so reminder of the chart in post 69;
Now i can show a reversal which is ongoing from this fib level;

Now i can show a reversal which is ongoing from this fib level;

Davai - 01 May 2012 16:19 - 72 of 423
So, now in closer detail;
The reversal was easy to spot. Three 15min candles with a bit of impetus and on closer inspection gave me a fast 5wave impulse move, the pullbacks of each being so minor, it was clearly showing the way, (these i have listed as (i) through to (v) of '1'). Then follows another clear abc corrective move, before climbing up to trigger the set-up long on a break of point (v). Reading it as a 123 reversal; this is point 2. Stop is a pip below point 3. the ISM data did the rest;

The reversal was easy to spot. Three 15min candles with a bit of impetus and on closer inspection gave me a fast 5wave impulse move, the pullbacks of each being so minor, it was clearly showing the way, (these i have listed as (i) through to (v) of '1'). Then follows another clear abc corrective move, before climbing up to trigger the set-up long on a break of point (v). Reading it as a 123 reversal; this is point 2. Stop is a pip below point 3. the ISM data did the rest;

Davai - 01 May 2012 16:29 - 73 of 423
Looking at the above again, but this time concentrating on the Fibonacci retracement levels, you will see how accurate they can be for expected reversal points. I have circled the more important ones in orange;


Davai - 02 May 2012 09:28 - 74 of 423
So you've realised that the £/Yen is my favourite pair for trading right now.
This may be repetitive from yesterday, but the count became clear from the overnight action, so i want to post the relevant charts and updates;
Expected reversal point from Mondays action;
update;
Updated update (with overnight action);

and in closer detail with the wave counts etc;

That is surely proof to any doubters that charts and Elliott wave do work!
Davai - 02 May 2012 13:11 - 75 of 423
Current thinking;


Davai - 02 May 2012 13:11 - 76 of 423
Arguments for long/short;


| About MoneyAM | Ts and Cs | Privacy Policy | Investment Warning | Content Standards | Corporate Solutions | Advertise With Us | Site Map | © 2026 MoneyAM |
Register now for FREE
Share Prices,
Stock Quotes,
Charts, Bulletin Boards, Indices, Watchlists, Portfolio, Market News, Research
or see our Premium Services including Level 2, Terminal and much more.